. 2022 Jul 27;13(1):4319.
doi: 10.1038/s41467-022-31757-8.

Rare loss of function variants in the hepatokine gene INHBE protect from abdominal obesity

Affiliations

Rare loss of function variants in the hepatokine gene INHBE protect from abdominal obesity

Aimee M Deaton et al. Nat Commun. .

Abstract

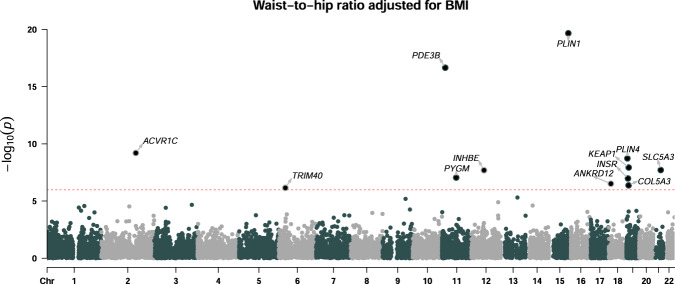
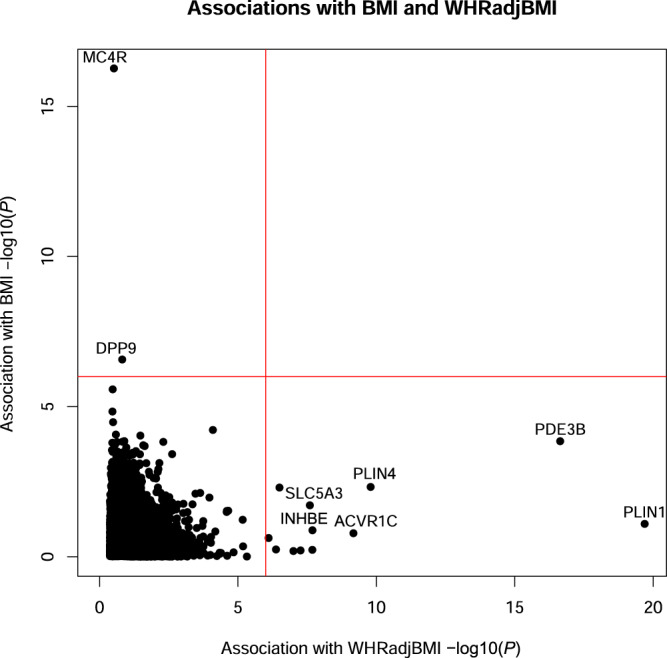
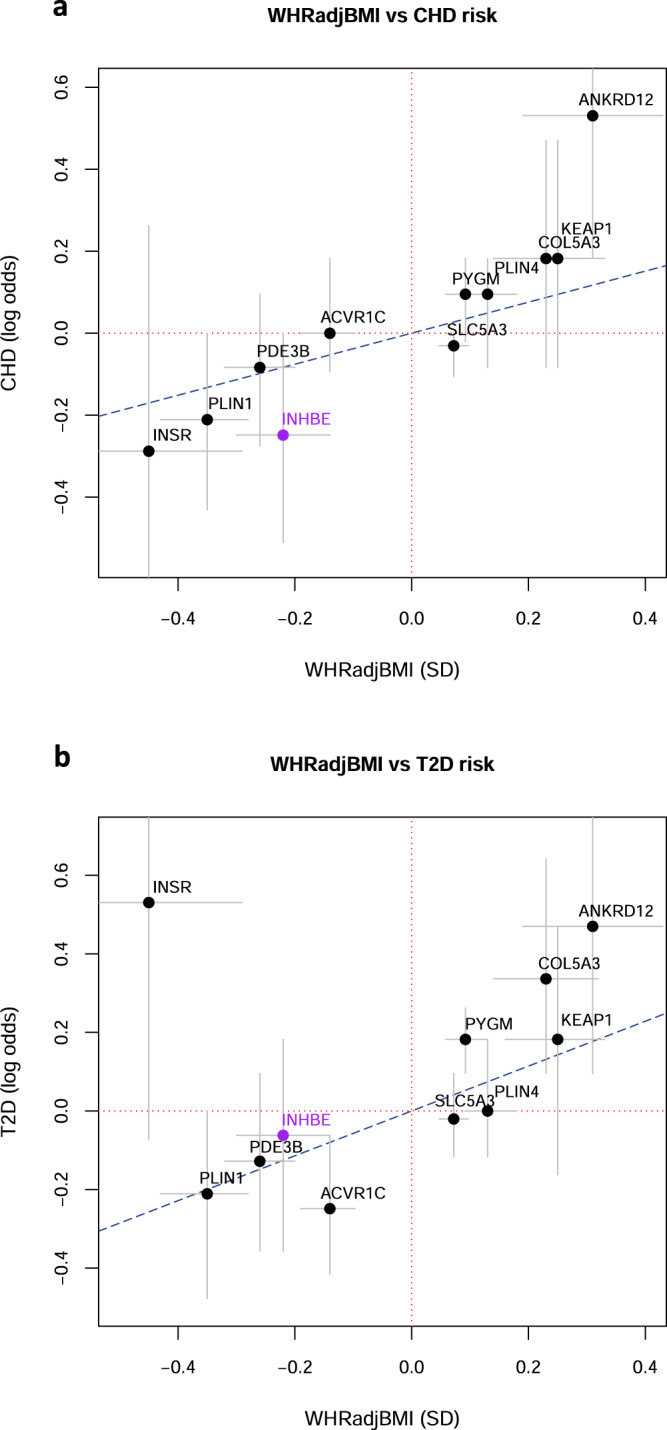
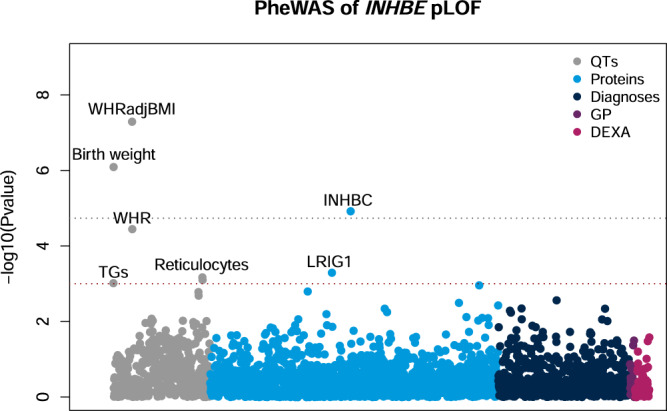
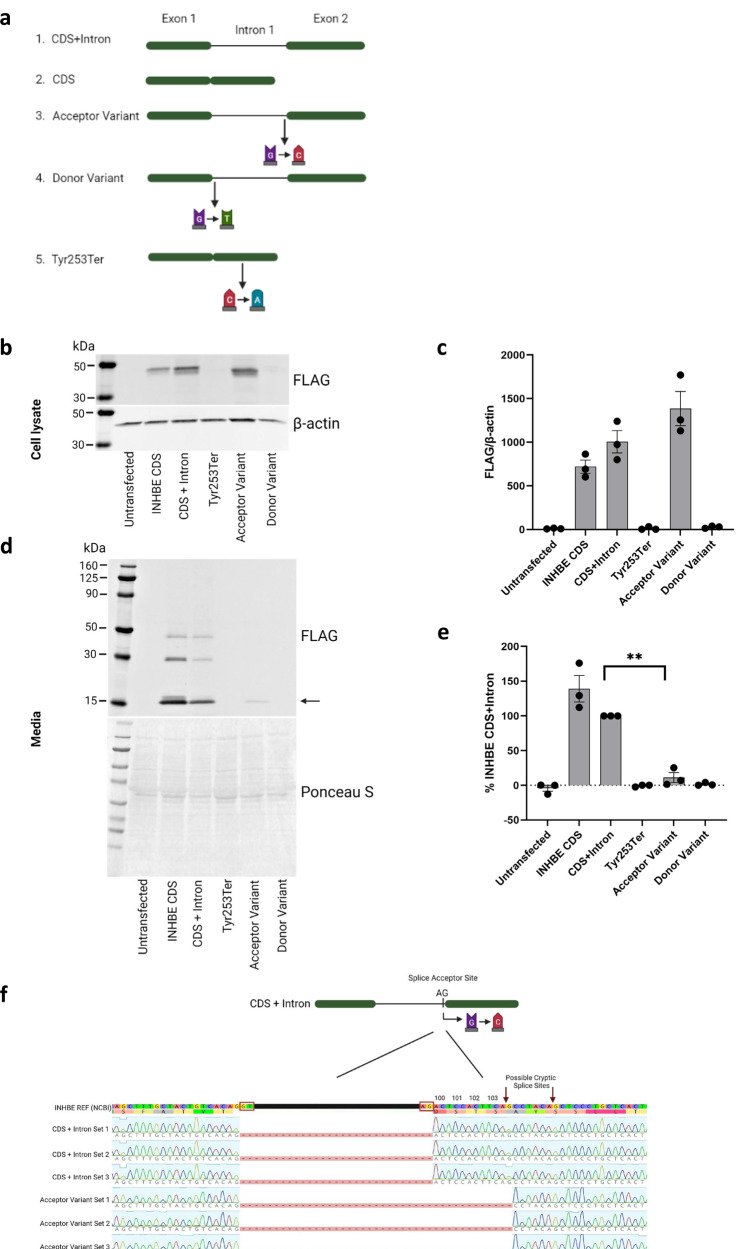
Identifying genetic variants associated with lower waist-to-hip ratio can reveal new therapeutic targets for abdominal obesity. We use exome sequences from 362,679 individuals to identify genes associated with waist-to-hip ratio adjusted for BMI (WHRadjBMI), a surrogate for abdominal fat that is causally linked to type 2 diabetes and coronary heart disease. Predicted loss of function (pLOF) variants in INHBE associate with lower WHRadjBMI and this association replicates in data from AMP-T2D-GENES. INHBE encodes a secreted protein, the hepatokine activin E. In vitro characterization of the most common INHBE pLOF variant in our study, indicates an in-frame deletion resulting in a 90% reduction in secreted protein levels. We detect associations with lower WHRadjBMI for variants in ACVR1C, encoding an activin receptor, further highlighting the involvement of activins in regulating fat distribution. These findings highlight activin E as a potential therapeutic target for abdominal obesity, a phenotype linked to cardiometabolic disease.


Conflict of interest statement

A.Deaton, A.Dubey, L.D.W., E.Y., S.T., L.N., R.A.H., C.W., M.E.P., A.M.H., K.F., A.K.V. and P.N. are employees and stockholders of Alnylam Pharmaceuticals. G.H. is an employee and stockholder of Alnylam Pharmaceuticals and a paid consultant to 54Gene. M.M.P. is a former employee and stockholder of Alnylam Pharmaceuticals and a current employee and stockholder of Beam Therapeutics. As of April 2022, P.D. is an employee and stockholder of Regeneron Pharmaceuticals. J.F. has no competing interests.

Figures

Fig. 1
Fig. 1. Gene-level associations with waist-to-hip ratio adjusted for BMI.
Gene-based burden analysis of WHRadjBMI in 362,679 European ancestry individuals. Association testing was performed using a generalized linear model adjusting for the first 30 principal components of genetic ancestry. The best variant set per gene is shown and significant genes are labeled (P ≤ 1.05 × 10−6; Bonferroni correcting for the number of genes and variant masks tested). The dashed line indicates the threshold for statistical significance.
Fig. 2
Fig. 2. Comparison of associations for WHRadjBMI and BMI.
Results of gene-based association tests for WHRadjBMI and BMI in 362,679 European ancestry individuals performed using a generalized linear model. −log10(P) is shown for the most significant variant set per gene. The red lines indicate the threshold for statistical significance (P ≤ 1.05 × 10−6; Bonferroni correcting for the number of genes and variant masks tested) and selected genes are labeled.
Fig. 3
Fig. 3. Relationship between effect on WHRadjBMI and risk of CHD and T2D.
For significant genes, we plotted the estimated log odds of disease risk as a function of the estimated effect in standard deviations (SD) on WHRadjBMI calculated in 362,679 European ancestry participants. Effects are shown for INHBE pLOF and, for the other genes, the most significant variant set per gene. a Effect on WHRadjBMI (in SD) versus the log odds of CHD (b) Effect on WHRadjBMI (in SD) versus the log odds of T2D. Grey bars represent the 95% confidence interval. The blue dotted line represents the estimated effect on disease predicted by a MR study of WHRadjBMI.
Fig. 4
Fig. 4. PheWAS of INHBE pLOF.
The association of INHBE pLOF with quantitative traits (QTs), circulating proteins (Proteins), disease diagnoses (Diagnoses), biomarkers from primary care (GP) and measures of body composition (DEXA) was tested using either a generalized linear regression or a mixed-effects model. The y-axis shows −log10(P) for each trait tested. Phenome-wide significant (P ≤ 1.84 × 10−5 Bonferroni correcting for the number of phenotypes tested; grey line) and suggestive (P ≤ 1 × 10−3; red line) associations are labeled. TGs; triglycerides, Reticulocytes; high light scatter reticulocyte count and percentage, INHBC; inhibin βC/activin C, LRIG1; leucine-rich repeats and immunoglobulin-like domains protein 1.
Fig. 5
Fig. 5. In vitro characterization of INHBE pLOF variants.
a Design of INHBE expression constructs containing the splice acceptor variant, the splice donor variant and stop gain variant Tyr253Ter which were transfected into HEK293T cells. CDS; coding sequence (b) Western blot analysis of FLAG-tagged inhibin βE protein from cell lysate. The expected size of the FLAG-tagged inhibin βE pro-protein is 39–42 kDa. β-actin was used as a loading control. c Quantification of inhibin βE in cell lysate from 3 independent biological replicates, error bars represent the standard error of the mean (SEM). d Western blot analysis of secreted FLAG-tagged inhibin βE protein harvested from the media. Ponceau S protein stain was used as a loading control. The arrow represents the expected size of the FLAG-tagged inhibin βE mature domain (14–16 kDa). e Quantification of inhibin βE in cell media from 3 independent biological replicates. Values are normalized to non-variant INHBE (CDS + intron). Error bars represent SEM, **P = 0.0065 using a two-sided unpaired t-test. f Sequencing of the mRNA produced by cells expressing non-variant INHBE (CDS + intron) and cells expressing the splice acceptor variant. Amino acid residues are numbered, and red boxes indicate splice sites. Set 1, 2 and 3 refer to independent biological replicates. Panels (a) and (f) were created with BioRender.com.

References

    1. Emdin CA, et al. Genetic association of waist-to-hip ratio with cardiometabolic traits, type 2 diabetes, and coronary heart disease. JAMA. 2017;317:626–634. doi: 10.1001/jama.2016.21042. - DOI - PMC - PubMed
    1. Pischon T, et al. General and abdominal adiposity and risk of death in Europe. N. Engl. J. Med. 2008;359:2105–2120. doi: 10.1056/NEJMoa0801891. - DOI - PubMed
    1. Dale CE, et al. Causal associations of adiposity and body fat distribution with coronary heart disease, stroke subtypes, and type 2 diabetes mellitus: a mendelian randomization analysis. Circulation. 2017;135:2373–2388. doi: 10.1161/CIRCULATIONAHA.116.026560. - DOI - PMC - PubMed
    1. Yusuf S, et al. Obesity and the risk of myocardial infarction in 27,000 participants from 52 countries: a case-control study. Lancet. 2005;366:1640–1649. doi: 10.1016/S0140-6736(05)67663-5. - DOI - PubMed
    1. Neeland IJ, et al. Visceral and ectopic fat, atherosclerosis, and cardiometabolic disease: a position statement. Lancet Diabetes Endocrinol. 2019;7:715–725. doi: 10.1016/S2213-8587(19)30084-1. - DOI - PubMed

Publication types