. 2022 Jul 27;7(1):255.
doi: 10.1038/s41392-022-01048-1.

SARS-CoV-2 nucleocapsid protein triggers hyperinflammation via protein-protein interaction-mediated intracellular Cl- accumulation in respiratory epithelium

Affiliations

SARS-CoV-2 nucleocapsid protein triggers hyperinflammation via protein-protein interaction-mediated intracellular Cl- accumulation in respiratory epithelium

Lei Chen et al. Signal Transduct Target Ther. .

Abstract

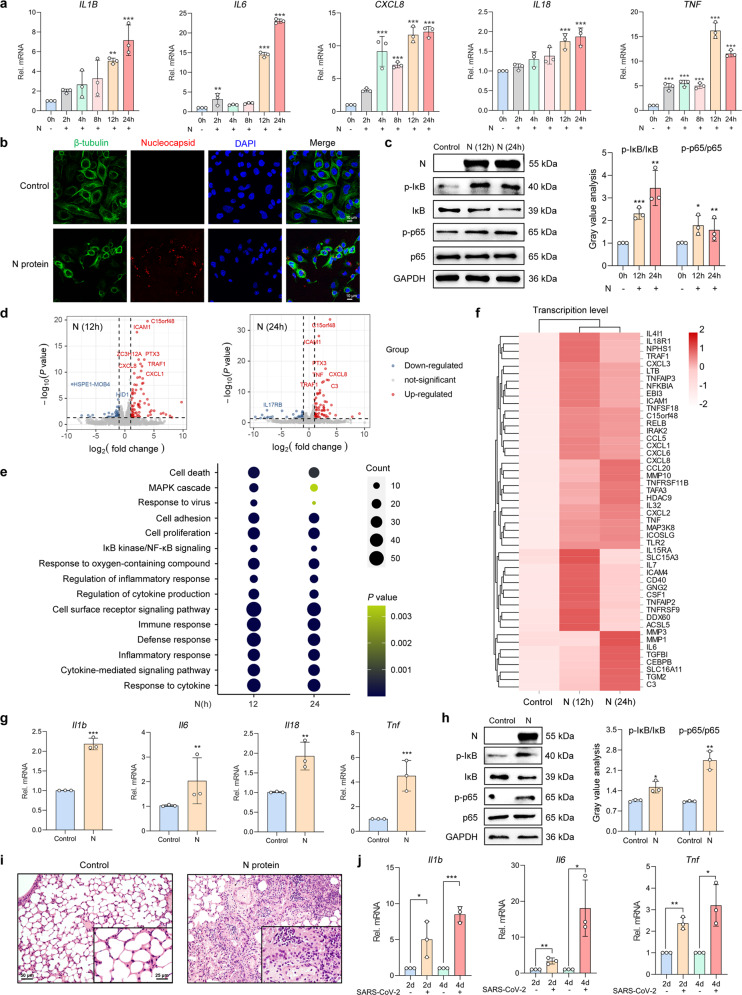
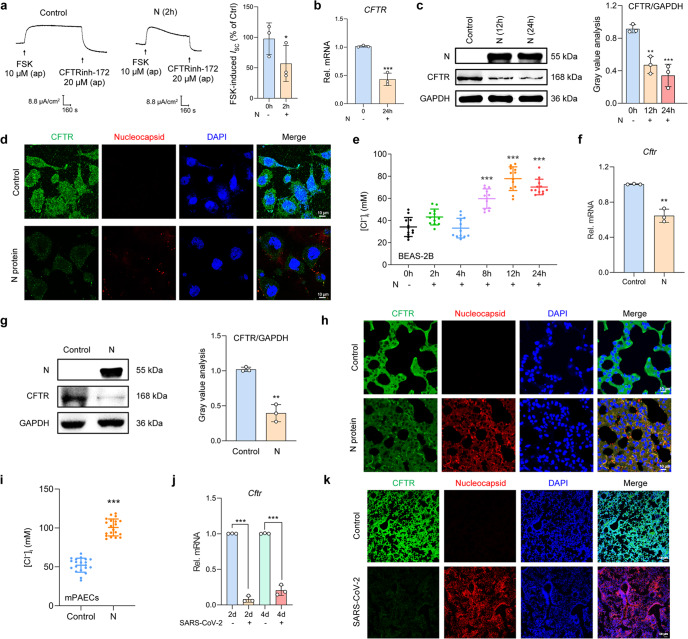
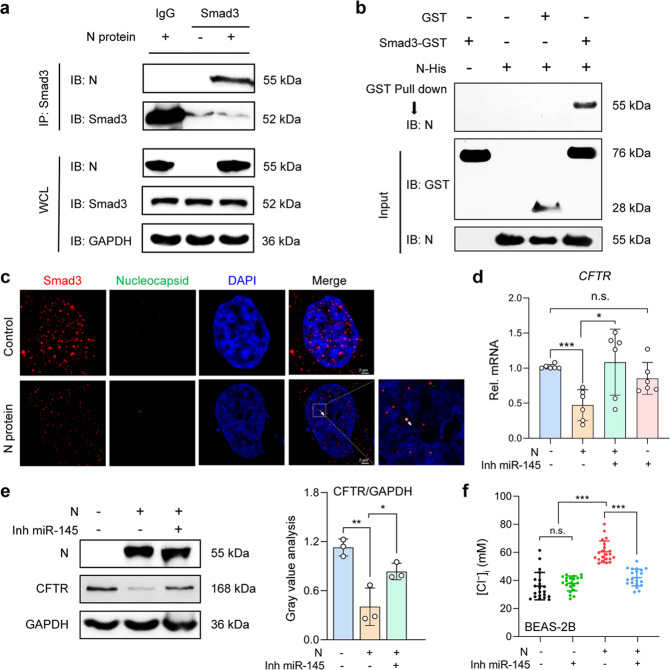
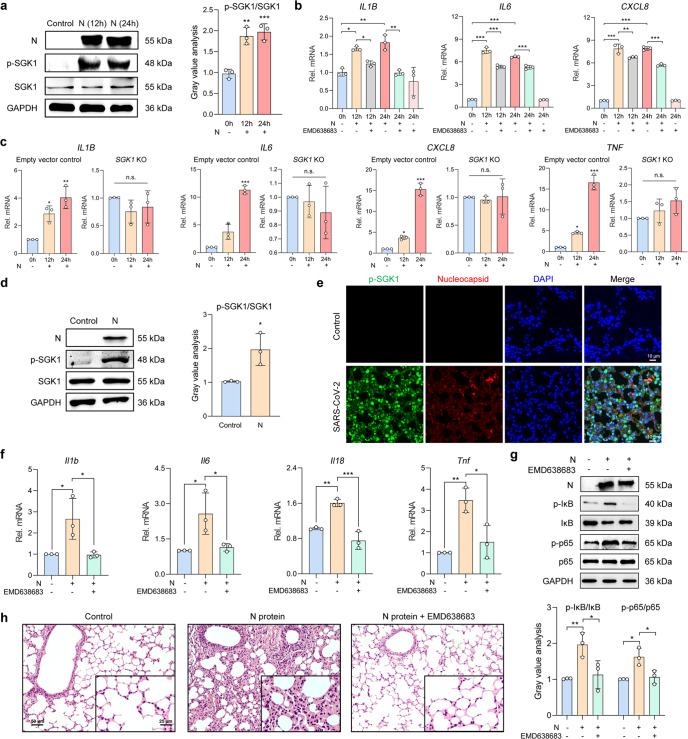
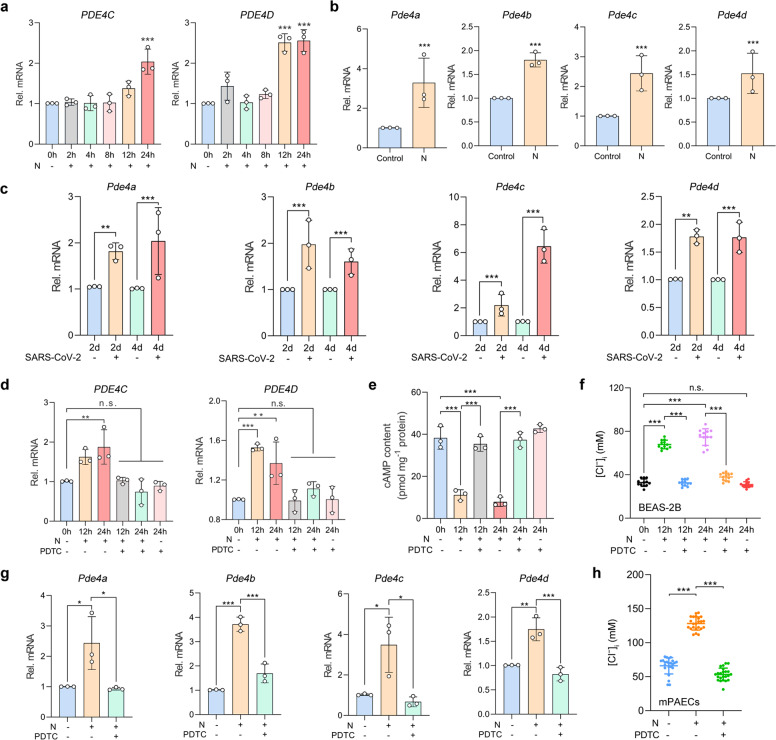
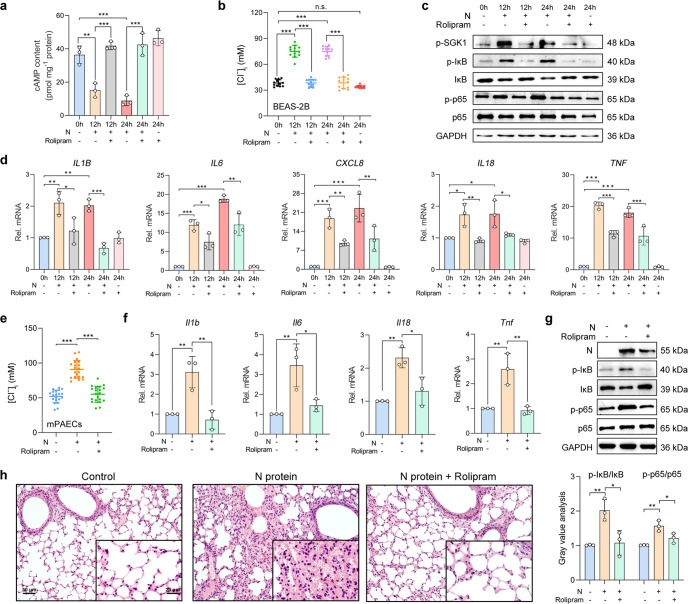
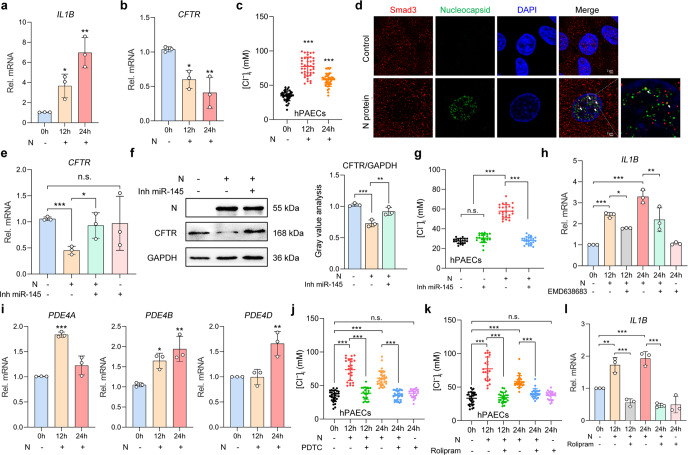
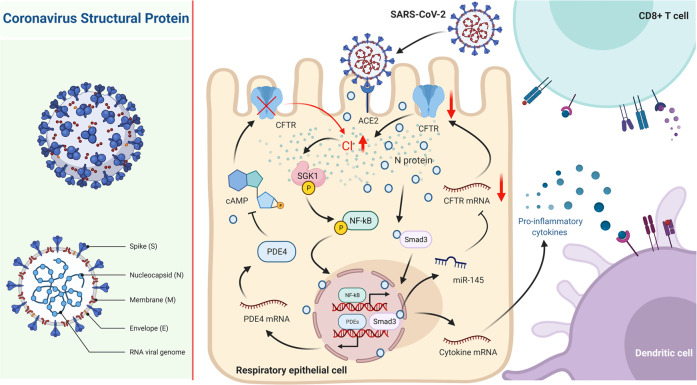
SARS-CoV-2, the culprit pathogen of COVID-19, elicits prominent immune responses and cytokine storms. Intracellular Cl- is a crucial regulator of host defense, whereas the role of Cl- signaling pathway in modulating pulmonary inflammation associated with SARS-CoV-2 infection remains unclear. By using human respiratory epithelial cell lines, primary cultured human airway epithelial cells, and murine models of viral structural protein stimulation and SARS-CoV-2 direct challenge, we demonstrated that SARS-CoV-2 nucleocapsid (N) protein could interact with Smad3, which downregulated cystic fibrosis transmembrane conductance regulator (CFTR) expression via microRNA-145. The intracellular Cl- concentration ([Cl-]i) was raised, resulting in phosphorylation of serum glucocorticoid regulated kinase 1 (SGK1) and robust inflammatory responses. Inhibition or knockout of SGK1 abrogated the N protein-elicited airway inflammation. Moreover, N protein promoted a sustained elevation of [Cl-]i by depleting intracellular cAMP via upregulation of phosphodiesterase 4 (PDE4). Rolipram, a selective PDE4 inhibitor, countered airway inflammation by reducing [Cl-]i. Our findings suggested that Cl- acted as the crucial pathological second messenger mediating the inflammatory responses after SARS-CoV-2 infection. Targeting the Cl- signaling pathway might be a novel therapeutic strategy for COVID-19.


Conflict of interest statement

The authors declare no competing interests.

Figures

Fig. 1
Fig. 1
SARS-CoV-2 N protein-elicited respiratory epithelial inflammation. a The mRNA expression levels of pro-inflammatory cytokines in N protein (50 μg/ml)-stimulated BEAS-2B cells (n = 3). b Fluorescence labeling of β-tubulin (green) and N protein (red) in BEAS-2B cells with DAPI-labeled nuclei (blue) after stimulation with N protein (50 μg/ml) for 24 h. Scale bars, 10 μm. c The phosphorylation level of IκB and NF-κB p65 subunit after N protein (50 μg/ml) stimulation in BEAS-2B cells, with the gray value analysis (n = 3). d Volcano plot visualization of the global RNA-seq DEGs in N protein (50 μg/ml)-stimulated BEAS-2B cells. e Dot plot of the enriched GO terms of the mRNAs exhibiting the enriched genes of BEAS-2B cells which were stimulated with N protein (50 μg/ml). f A heatmap showing the mRNA expression levels of the DEGs upregulated by N protein (50 μg/ml) stimulation compared with the control group, with the genes belonging to the GO annotations for cytokine activity and chemokine activity (GO: 0005125 and GO: 0008009). g The mRNA expression levels of cytokines in mice stimulated with N protein (0.25 mg/kg) (n = 3). h The phosphorylation level of IκB and p65 after N protein (0.25 mg/kg) stimulation in mice, with the gray value analysis (n = 3). i H&E staining of lung slices from N protein (0.25 mg/kg)-stimulated mice. Scale bars, 50 and 25 μm. j The mRNA expression levels of cytokines in SARS-CoV-2 (1 × 105 PFU)-infected hACE2-transduced mice (n = 3). Data were shown as mean ± SD, *P < 0.05, **P < 0.01, ***P < 0.001 compared with the control group or indicated by lines
Fig. 2
Fig. 2
SARS-CoV-2 N protein triggered the downregulation of CFTR and increased [Cl]i in RECs. a Representative traces showing the effect of N protein (50 μg/ml) on ISC responses induced by forskolin (FSK, 10 μM) in 16HBE14o- cells, with the statistical analysis (n = 3). b The mRNA expression levels of CFTR in N protein (50 μg/ml)-stimulated BEAS-2B cells (n = 3). c The expression of CFTR after N protein (50 μg/ml) stimulation in BEAS-2B cells, with the gray value analysis (n = 3). d Fluorescence labeling of CFTR (green) and N protein (red) in BEAS-2B cells with DAPI-labeled nuclei (blue) after stimulation with N protein (50 μg/ml) for 24 h. Scale bars, 10 μm. e The changes in [Cl]i of BEAS-2B cells after N protein (50 μg/ml) stimulation (n = 12 cells). f The mRNA expression level of Cftr in the lungs of N protein (0.25 mg/kg)-stimulated mice (n = 3). g The expression of CFTR after N protein (0.25 mg/kg) stimulation in the lungs of mice, with the gray value analysis (n = 3). h Fluorescence labeling of CFTR (green) and N protein (red) in mouse lung slices with DAPI-labeled nuclei (blue) after N protein (0.25 mg/kg) stimulation. Scale bars, 10 μm. i The changes in [Cl]i of mPAECs from mice after N protein (0.25 mg/kg) stimulation (n = 20 cells). j The mRNA expression level of Cftr in the lungs of hACE2-transduced mice infected with SARS-CoV-2 (1 × 105 PFU) (n = 3). k Fluorescence labeling of CFTR (green) and N protein (red) in lung slices of hACE2-transduced mice infected with SARS-CoV-2 (1 × 105 PFU). Scale bars, 50 μm. Data were shown as mean ± SD, *P < 0.05, **P < 0.01, ***P < 0.001 compared with the control group or indicated by lines
Fig. 3
Fig. 3
SARS-CoV-2 N protein interacted with Smad3 to induce miR-145-mediated downregulation of CFTR and increased [Cl]i in RECs. a Whole-cell lysates (WCL) from BEAS-2B cells stimulated by N protein (50 μg/ml) for 24 h were subject to immunoprecipitation with anti-Smad3 beads and immunoblotted with an anti-N protein antibody. b GST pull-down assays using GST-Smad3 and N protein. N proteins binding to GST-Smad3 were detected by using an anti-N protein antibody. c Fluorescence labeling of Smad3 (red) and N protein (green) in BEAS-2B cells with DAPI-labeled nuclei (blue) after stimulation with N protein (50 μg/ml) for 24 h. Scale bars, 2 μm. d The effect of Inh miR-145 (100 nM) on the mRNA expression levels of CFTR in BEAS-2B cells stimulated with N protein (50 μg/ml) for 24 h (n = 3). e The effect of Inh miR-145 (100 nM) on the expression of CFTR in BEAS-2B cells stimulated by N protein (50 μg/ml) for 24 h, with the gray value analysis (n = 3). f The effect of Inh miR-145 (100 nM) on [Cl]i of BEAS-2B cells stimulated by N protein (50 μg/ml) for 24 h (n = 20 cells). Data are shown as mean ± SD, *P < 0.05, **P < 0.01, ***P < 0.001, n.s. P > 0.05
Fig. 4
Fig. 4
SARS-CoV-2 N protein-triggered inflammation via the activation of SGK1 in RECs. a The phosphorylation level of SGK1 after N protein (50 μg/ml) stimulation in BEAS-2B cells, with the gray value analysis (n = 3). b The effect of EMD638683 (50 μM) on the mRNA expressions of pro-inflammatory cytokines in N protein (50 μg/ml)-stimulated BEAS-2B cells (n = 3). c The mRNA expressions of cytokines after N protein (50 μg/ml) stimulation in the empty vector control or SGK1 KO BEAS-2B cells (n = 3). d The phosphorylation level of SGK1 in lungs of N protein (0.25 mg/kg)-stimulated mice, with the gray value analysis (n = 3). e Fluorescence labeling of phosphorylated SGK1 (green) and N protein (red) in lung slices of hACE2-transduced mice infected with SARS-CoV-2 (1 × 105 PFU). Scale bars, 10 μm. f The effect of EMD638683 (10 mg/kg) on the mRNA expressions of cytokines in N protein (0.25 mg/kg)-stimulated mice (n = 3). g The effect of EMD638683 (10 mg/kg) on the phosphorylation level of IκB and NF-κB p65 subunit in N protein (0.25 mg/kg)-stimulated mice, with the gray value analysis (n = 3). h H&E staining of lung slices from N protein (0.25 mg/kg)-stimulated mice with or without treatment with EMD638683 (10 mg/kg). Scale bars, 50 μm and 25 μm. Data were shown as mean ± SD, *P < 0.05, **P < 0.01, ***P < 0.001 compared with the control group or indicated by lines, n.s. P > 0.05
Fig. 5
Fig. 5
SARS-CoV-2 N protein contributed to the sustained elevation in [Cl]i via NF-κB-PDE4-cAMP signaling pathway in RECs. a The mRNA expressions of PDE4C and PDE4D in the N protein (50 μg/ml)-stimulated BEAS-2B cells (n = 3). b The mRNA expressions of Pde4 in the lung tissues of N protein (0.25 mg/kg)-stimulated mice (n = 3). c The mRNA expressions of Pde4 in the lung tissues of SARS-CoV-2 (1 × 105 PFU)-infected hACE2-transduced mice (n = 3). d The effect of PDTC (100 μM) on PDE4 mRNA expression in BEAS-2B cells stimulated with N protein (50 μg/ml) (n = 3). e The effect of PDTC (100 μM) on intracellular cAMP levels in BEAS-2B cells stimulated with N protein (50 μg/ml) (n = 3). f The effect of PDTC (100 μM) on [Cl]i of BEAS-2B cells stimulated with the N protein (50 μg/ml) (n = 12 cells). g The effect of PDTC (100 mg/kg) on Pde4 mRNA expression in the lung tissues of N protein (0.25 mg/kg)-stimulated mice (n = 3). h The effect of PDTC (100 mg/kg) on [Cl]i of mPAECs from mice after N protein (0.25 mg/kg) stimulation (n = 20 cells). Data were shown as mean ± SD, *P < 0.05, **P < 0.01, ***P < 0.001 compared with the control group or indicated by lines, n.s. P > 0.05
Fig. 6
Fig. 6
Inhibition of PDE4 suppressed the SARS-CoV-2 N protein-induced ongoing inflammation via downregulation of the [Cl]i. a The effect of rolipram (20 μM) on the intracellular cAMP content after the N protein (50 μg/ml) stimulation in BEAS-2B cells (n = 3). b The effect of rolipram (20 μM) on [Cl]i in BEAS-2B cells stimulated with the N protein (50 μg/ml) (n = 12 cells). c The effect of rolipram (20 μM) on phosphorylation level of SGK1, IκB, and NF-κB p65 subunit after N protein (50 μg/ml) stimulation in BEAS-2B cells. d The effect of rolipram (20 μM) on the mRNA expression levels of pro-inflammatory cytokines stimulated with the N protein (50 μg/ml) in BEAS-2B cells (n = 3). e The effect of rolipram (10 mg/kg) on [Cl]i in mPAECs from mice after N protein (0.25 mg/kg) stimulation (n = 20 cells). f The effect of rolipram (10 mg/kg) on the expression levels of cytokines stimulated with the N protein (0.25 mg/kg) in mice (n = 3). g The effect of rolipram (10 mg/kg) on the phosphorylation level of IκB and p65 after N protein (0.25 mg/kg) stimulation in mice, with the gray value analysis (n = 3). h H&E staining of lung slices from N protein (0.25 mg/kg)-stimulated mice with or without treatment with rolipram (10 mg/kg). Scale bars, 50 μm and 25 μm. Data were shown as mean ± SD, *P < 0.05, **P < 0.01, ***P < 0.001, n.s. P > 0.05
Fig. 7
Fig. 7
Involvement of Cl signaling mediated by SARS-CoV-2 N protein-Smad3 interactions in N protein-triggered inflammatory responses in hPAECs. a The mRNA expression levels of IL1B in N protein (50 μg/ml)-stimulated hPAECs (n = 3). b The mRNA expression levels of CFTR in N protein (50 μg/ml)-stimulated hPAECs (n = 3). c The changes in [Cl]i of hPAECs after N protein (50 μg/ml) stimulation (n = 39 cells from 3 individuals). d Fluorescence labeling of Smad3 (red) and N protein (green) in hPAECs with DAPI-labeled nuclei (blue) after stimulation with N protein (50 μg/ml) for 24 h. Scale bars, 2 μm. e The effect of Inh miR-145 (100 nM) on the mRNA expression levels of CFTR in hPAECs stimulated with N protein (50 μg/ml) for 24 h (n = 3). f The effect of Inh miR-145 (100 nM) on the expression of CFTR in hPAECs stimulated by N protein (50 μg/ml) for 24 h, with the gray value analysis (n = 3). g The effect of Inh miR-145 (100 nM) on the [Cl]i of hPAECs stimulated with N protein (50 μg/ml) for 24 h (n = 20 cells from three individuals). h The effect of EMD638683 (50 μM) on the mRNA expressions of IL1B in N protein (50 μg/ml)-stimulated hPAECs (n = 3). i The mRNA expressions of PDE4 in the N protein (50 μg/ml)-stimulated hPAECs (n = 3). j The effect of PDTC (100 μM) on the [Cl]i of the N protein (50 μg/ml)-stimulated hPAECs (n = 20 cells from three individuals). k The effect of rolipram (20 μM) on [Cl]i of the N protein (50 μg/ml)-stimulated hPAECs (n = 3 cells from 3 individuals). l The effect of rolipram (20 μM) on the mRNA expression levels of IL1B in the N protein (50 μg/ml)-stimulated hPAECs (n = 3). Data were shown as mean ± SD, *P < 0.05, **P < 0.01, ***P < 0.001 compared with the control group or indicated by lines, n.s. P > 0.05
Fig. 8
Fig. 8
Schematic diagram depicting the role of intracellular Cl accumulation in eliciting an ongoing inflammatory response after SARS-CoV-2 N protein stimulation in RECs. In RECs, the N protein interacted with Smad3, which triggered the downregulation of the CFTR via miR-145. Thereafter, the [Cl]i was elevated and elicited inflammatory responses through activating the Cl-sensing SGK1. Moreover, the expression of PDE4 was upregulated owing to the activation of NF-κB, which resulted in cAMP degradation and dysfunction of CFTR, contributing to the sustained high [Cl]i and ongoing airway inflammation. [Created with BioRender.com (Canada)]

Similar articles

Cited by

References

    1. Zhu N, et al. A novel coronavirus from patients with pneumonia in China, 2019. N. Engl. J. Med. 2020;382:727–733. - PMC - PubMed
    1. Gordon DE, et al. A SARS-CoV-2 protein interaction map reveals targets for drug repurposing. Nature. 2020;583:459–468. doi: 10.1038/s41586-020-2286-9. - DOI - PMC - PubMed
    1. Knight DA, Holgate ST. The airway epithelium: structural and functional properties in health and disease. Respirology. 2003;8:432–446. doi: 10.1046/j.1440-1843.2003.00493.x. - DOI - PubMed
    1. Kotton DN, Morrisey EE. Lung regeneration: mechanisms, applications and emerging stem cell populations. Nat. Med. 2014;20:822–832. doi: 10.1038/nm.3642. - DOI - PMC - PubMed
    1. Perrone LA, et al. H5N1 and 1918 pandemic influenza virus infection results in early and excessive infiltration of macrophages and neutrophils in the lungs of mice. PLoS Pathog. 2008;4:e1000115. doi: 10.1371/journal.ppat.1000115. - DOI - PMC - PubMed

Publication types