. 2022 Jul 27;13(1):4363.
doi: 10.1038/s41467-022-32038-0.

Actin nano-architecture of phagocytic podosomes

Affiliations

Actin nano-architecture of phagocytic podosomes

J Cody Herron et al. Nat Commun. .

Abstract

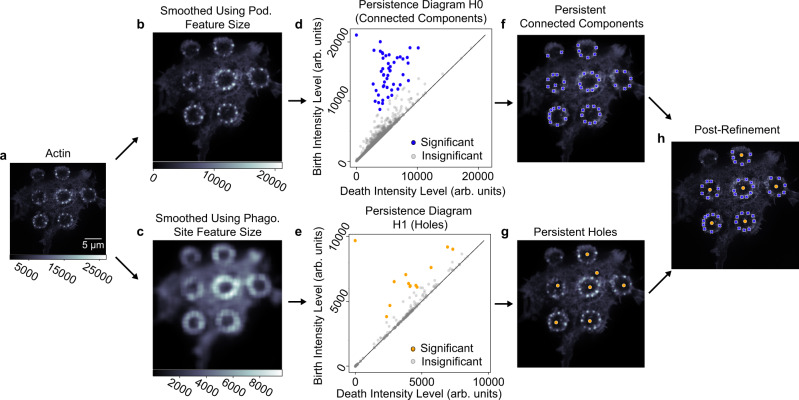
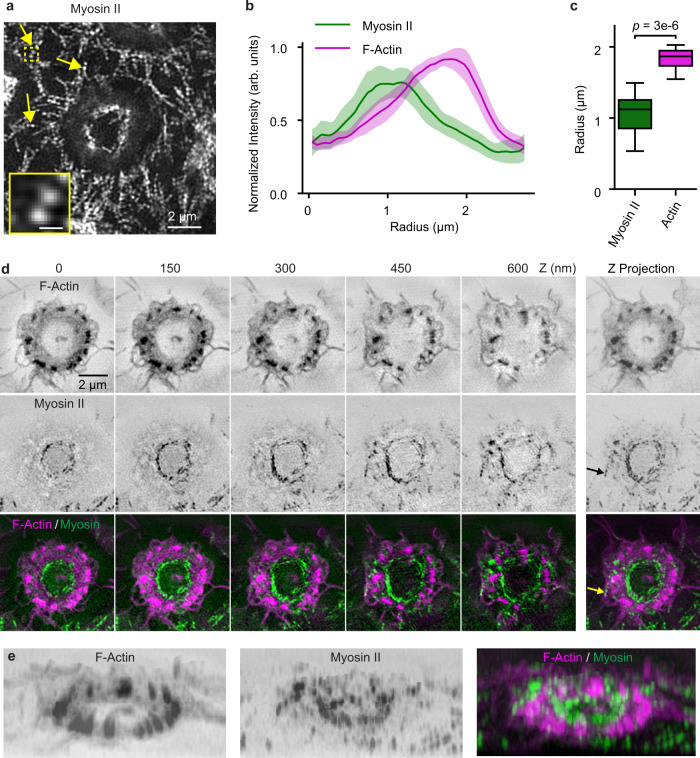
Podosomes are actin-enriched adhesion structures important for multiple cellular processes, including migration, bone remodeling, and phagocytosis. Here, we characterize the structure and organization of phagocytic podosomes using interferometric photoactivated localization microscopy, a super-resolution microscopy technique capable of 15-20 nm resolution, together with structured illumination microscopy and localization-based super-resolution microscopy. Phagocytic podosomes are observed during frustrated phagocytosis, a model in which cells attempt to engulf micropatterned IgG antibodies. For circular patterns, this results in regular arrays of podosomes with well-defined geometry. Using persistent homology, we develop a pipeline for semi-automatic identification and measurement of podosome features. These studies reveal an hourglass shape of the podosome actin core, a protruding knob at the bottom of the core, and two actin networks extending from the core. Additionally, the distributions of paxillin, talin, myosin II, α-actinin, cortactin, and microtubules relative to actin are characterized.


Conflict of interest statement

The authors declare no competing interests.

Figures

Fig. 1
Fig. 1. Podosomes on different substrates.
ad F-actin in RAW 267.4 cells. Enlargements show marked areas (dashed boxes). a = uniform fibronectin (phalloidin Alexa 568, SIM). b = uniform IgG (phalloidin Alexa 568, SIM). c = frustrated phagocytosis on micropatterned IgG disks, showing podosomes organized around the disk. (Lifeact-Halo549, IgG visualized with Alexa647 secondary antibody, TIRF-SIM). d = frustrated phagocytosis, showing the FcγRIIA receptor localized over the IgG disk, forming clusters (Lifeact-Halo 549, FcγRIIA-EGFP, TIRF-SIM). e Radial profile of proteins from the center of IgG disks (data are presented as mean with 95% CI, n = 24 sites from 6 cells). f The inflection radius of FcγRIIA-EGFP, IgG, and F-actin measured from individual radial profiles (n as in e) showing IgG localization over the IgG disks. Boxes show the median with first and third quartiles. Whiskers show the last datum within 1.5*IQR of the box. P values determined using a two-tailed Mann–Whitney U test with Bonferroni correction. g A circle of podosomes at different time points during frustrated phagocytosis, with kymograph below. Arrow marks podosome that disappears and reappears at the same position (FTractin-EGFP, TIRF-SIM). Source data are provided as a source data file.
Fig. 2
Fig. 2. iPALM imaging of actin in frustrated phagocytosis.
a Color coded Z-projection of a frustrated phagocytosis site. Color scale indicates distance of actin from coverslip (Phalloidin Alexa 647). b Normalized actin intensity for multiple sites (data are presented as mean with 95% CI, n = 7 sites from one cell). c Actin images from heights shown by colored diamonds in b. Source data are provided as a source data file.
Fig. 3
Fig. 3. Methods for identifying podosomes and site locations.
a TIRF-SIM imaging of actin in a cell with multiple frustrated phagocytosis sites. Color scale shows pixel intensity (arb. units). b, c Smoothed images of the entire cell based on the features of interest (podosomes i.e., pod. or phagocytosis sites i.e., phago.). An insignificant amount of noise is added for uniqueness. Color scales show pixel intensity (arb. units). d, e Persistence diagram based on images from b and c. In d, dots (homology-0) represent connected components, and in e dots (homology-1) represent holes. Significantly persistent features are colored. Due to pixel uniqueness, the birth intensity of significantly persistent features corresponds to maxima of clustered components and minima of holes. f, g Locations of significantly persistent clustered components (f) and holes (g). h Final locations of podosomes and phagocytosis site centers after post-processing to exclude podosomes far away from phagocytosis sites and center phagocytosis sites.
Fig. 4
Fig. 4. Podosome visualizations reveal 3D nanoarchitecture.
a, b Mean heatmap for n = 72 podosomes from one cell using either (a) perpendicular line scan (negative D is inward toward the center of the phagocytosis site, positive is outward) or (b) radial averaging. Color scale shows normalized mean intensity (arb. units). c, d Schematic representations for analyses performed. A perpendicular line scan, as shown in c is oriented toward the center of the phagocytosis site, and scans through a podosome perpendicular to the circle of podosomes. Radial averaging, as shown in d only depends on the podosome location. e Three-dimensional contour rendering of b rotated 180 degrees around the Z-axis. Color scale shows normalized mean intensity (arb. units). f Perpendicular line scan and radial averaging heatmaps for individual podosomes. Dashed magenta (above 150 nm in Z) and green (below 150 nm) lines are contours based on the mean value within a radius of 350 nm. Color scale shows normalized mean intensity (arb. units). g Zoomed view of the podosome protrusions (Z: 0–150 nm), row-wise the same individual podosomes as in f. The green contour is the same as in f. Color scale shows normalized (as in f) mean intensity (arb. units).
Fig. 5
Fig. 5. Individual podosome features quantified from iPALM radial averaging heatmaps.
a A radial averaging heatmap for an individual podosome with quantified features. Blue line is podosome height, pink line is protrusion length. Red diamond is the neck location. The location (diamond), Z full-width half-max (FWHM, vertical line), and R half-max radii (horizontal line, only for the cores) are shown for orange = upper core, brown = lower core, green = upper actin network, purple = lower actin network. b For the podosome in a, mean intensity versus height plot for portions within 100 nm of the center (dashed) and beyond 400 nm (dotted). Peaks, troughs, and FWHM shown correspond to a. c Mean intensity versus height plots of distributions within 100 nm and outside 400 nm (n = 72 podosomes from one cell, data are presented as mean with 95% CI). d Z locations of relevant features (diamonds in a, b). N = 72 for the upper core, 61 for the upper network, 61 for the neck, 64 for the lower network, and 48 for the lower core. Boxes show the median with first and third quartiles. Whiskers show the last datum within 1.5*IQR of the box. P values determined using a two-tailed Mann–Whitney U test with Bonferroni correction. e Z measurements of relevant features (vertical lines in a, b). N = 72 for the height, 64 for the protrusion, and otherwise as in d. Box plots and P values determined as in d. f Half-max radii for the upper and lower cores (horizontal lines in a). N as in d. Box plots and P values determined as in d. Source data are provided as a source data file.
Fig. 6
Fig. 6. Characterization of radial filaments around individual podosomes.
a Volumetric (3D) visualization of a podosome viewed from the top (top row) and side (bottom row). From left to right: whole image stack, 0 to 410 nm; 0 to 80 nm; 80 to 200 nm; 200 to 410 nm. Radial filaments around the central podosome core are labeled A–F. bd Radial traces for filaments A-F are produced by 3D object analysis (Methods). Traced radial filaments are highlighted in yellow. The dimensions of the bounding box are 1212 x 986 x 410 nm. e Three examples from two phagocytosis sites of radial fibers extending away from the podosome core. Z-projected image stacks from iPALM are color-coded from 200 to 410 nm.
Fig. 7
Fig. 7. Relative positions of podosome actin core and other proteins.
a, b TIRF-SIM images of F-actin (lifeact-Halo-549), paxillin-EGFP (a), and talin- EGFP (b) in RAW 264.7 macrophages plated on disks of micropatterned IgG-Alexa 647. c Perpendicular line scans for F-actin, paxillin, and talin with podosome center at 0 (Paxillin: n = 60 podosomes across 2 cells. Talin: n = 134 podosomes across 4 cells). Data are presented as the mean with 95% CI. Arrows for IgG and FcγR show their distribution relative to the actin peak, with the flat end corresponding to the mean inflection points from Fig. 1e, f. d Distance from the podosome center to paxillin and talin peaks (n as in c). Boxes show the median with first and third quartiles. Whiskers show the last datum within 1.5*IQR of the box. P values determined using a two-tailed Mann-Whitney U test with Bonferroni correction. e Full-width half max of each species peak (n as in c). Box plots and P values determined as in d. f Distance between the inner (in, toward site center) and outer (out, away from the site) peaks for each species (n as in c). Box plots and P values determined as in d. Source data are provided as a source data file.
Fig. 8
Fig. 8. Myosin II filaments in macrophage frustrated phagocytosis.
a Macrophages plated on micropatterned IgG-Alexa 647 disks, with myosin II marked using RLC-EGFP and imaged with TIRF-SIM. Myosin II filaments formed a small ring within the circle of podosomes during macrophage frustrated phagocytosis. Individual myosin II bipolar filaments were visualized as doublets (arrows). The insert, showing a doublet, is a zoom of the dashed box. The scale bar of the insert is 300 nm. b Radial distributions of actin and myosin II (n = 15 sites across 7 cells, data are presented as mean with 95% CI). c Radial distance to the actin and myosin II peaks. Boxes show the median with first and third quartiles (n as in b). Whiskers show the last datum within 1.5*IQR of the box. P values determined using a two-tailed Mann-Whitney U test with Bonferroni correction. d Z-stack of actin 3D-SIM images (lifeact-Halo-549), myosin II (RLC-EGFP), and merged. e 3D view of actin and myosin II filaments shown in d. Source data are provided as a source data file.
Fig. 9
Fig. 9. Schematic of podosome constituents drawn to scale.
a Cartoon of actin (magenta) based on iPALM, showing upper radial fibers, lower actin network, and the ventral protrusion. The cross-section shows intensity contours quantified in Fig. 4e. The IgG disk is shown in cyan. Grid unit length = 50 nm. b One-dimensional density plots from TIRF-SIM imaging of species centered on the F-actin peak. Plots correspond to the mean values for each species in Fig. 1e (IgG and FcγRIIA), Fig. 7c (F-Actin, Paxillin, Talin), and Fig. 8b (Myosin II). For IgG and FcγRIIA, white lines correspond to the mean inflection points (Fig. 1f). For paxillin, talin, and myosin, the white lines show the peak and FWHM boundary values. For myosin, the left-hand boundary of the FWHM is beyond the end of the plot but would be at −1.28 μm. PALM/STORM imaging showed cortactin co-localized with actin in both lobes of the podosome (Supplementary Fig. 7).

References

    1. Linder S, Nelson D, Weiss M, Aepfelbacher M. Wiskott-Aldrich syndrome protein regulates podosomes in primary human macrophages. Proc. Natl Acad. Sci. USA. 1999;96:9648–9653. doi: 10.1073/pnas.96.17.9648. - DOI - PMC - PubMed
    1. Linder S, Kopp P. Podosomes at a glance. J. Cell Sci. 2005;118:2079–2082. doi: 10.1242/jcs.02390. - DOI - PubMed
    1. Marchisio PC, et al. Cell-substratum interaction of cultured avian osteoclasts is mediated by specific adhesion structures. J. Cell Biol. 1984;99:1696–1705. doi: 10.1083/jcb.99.5.1696. - DOI - PMC - PubMed
    1. Destaing O, Saltel F, Geminard JC, Jurdic P, Bard F. Podosomes display actin turnover and dynamic self-organization in osteoclasts expressing actin-green fluorescent protein. Mol. Biol. Cell. 2003;14:407–416. doi: 10.1091/mbc.e02-07-0389. - DOI - PMC - PubMed
    1. Burns S, Thrasher AJ, Blundell MP, Machesky L, Jones GE. Configuration of human dendritic cell cytoskeleton by Rho GTPases, the WAS protein, and differentiation. Blood. 2001;98:1142–1149. doi: 10.1182/blood.V98.4.1142. - DOI - PubMed

Publication types

LinkOut - more resources