. 2022 Jul 27;13(1):4343.
doi: 10.1038/s41467-022-32071-z.

Real-time precision opto-control of chemical processes in live cells

Affiliations

Real-time precision opto-control of chemical processes in live cells

Matthew G Clark et al. Nat Commun. .

Abstract

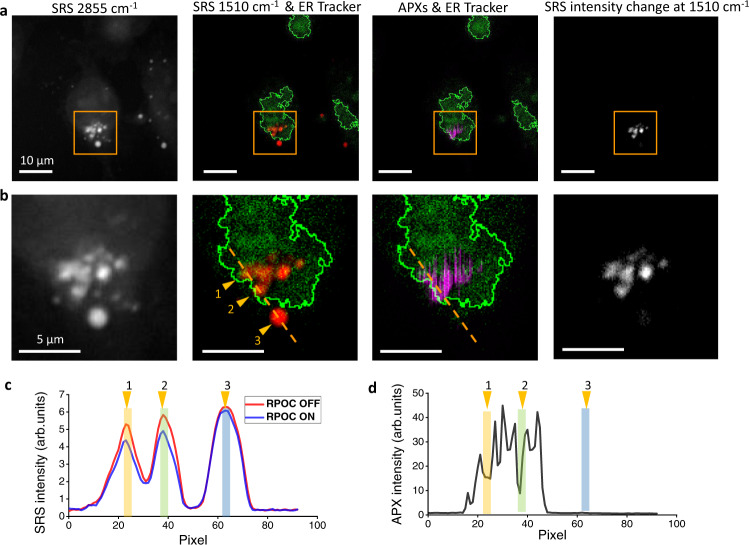
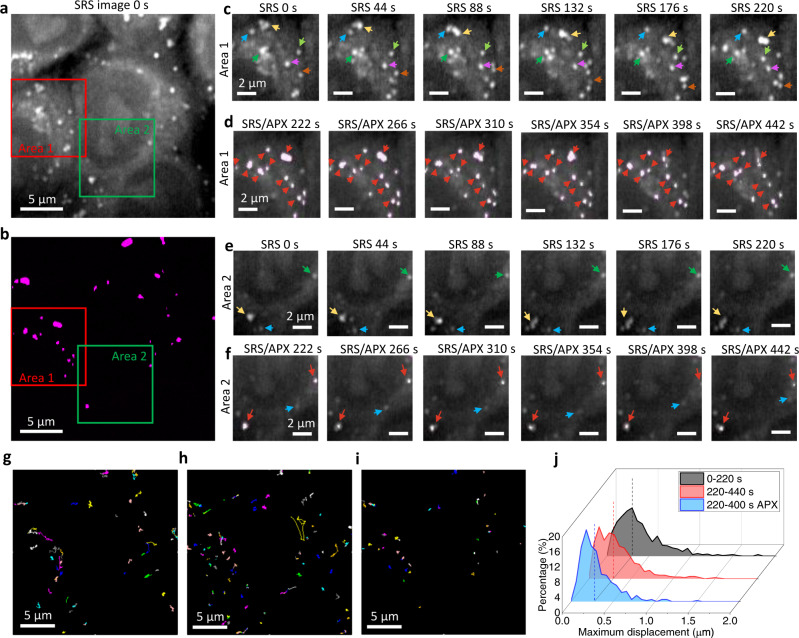
Precision control of molecular activities and chemical reactions in live cells is a long-sought capability by life scientists. No existing technology can probe molecular targets in cells and simultaneously control the activities of only these targets at high spatial precision. We develop a real-time precision opto-control (RPOC) technology that detects a chemical-specific optical response from molecular targets during laser scanning and uses the optical signal to couple a separate laser to only interact with these molecules without affecting other sample locations. We demonstrate precision control of molecular states of a photochromic molecule in different regions of the cells. We also synthesize a photoswitchable compound and use it with RPOC to achieve site-specific inhibition of microtubule polymerization and control of organelle dynamics in live cells. RPOC can automatically detect and control biomolecular activities and chemical processes in dynamic living samples with submicron spatial accuracy, fast response time, and high chemical specificity.


Conflict of interest statement

Authors declare that they have no competing interests.

Figures

Fig. 1
Fig. 1. The RPOC concept and optical configuration.
a An illustration of the RPOC concept. b An illustration of RPOC for selective control of molecular activities in a cell during laser scanning. c A schematic of the RPOC experimental setup. HWP half-wave plate, L lens, M mirror, DBS dichroic beam splitter, PBS polarization beam splitter, AOM acousto-optic modulator, BBO Beta Barium Borate. d The profile of the control laser beam (at 522 nm) after the AOM when the AOM is turned off. e The profile of the control laser beam after the AOM when the AOM is turned on (the 1st order deflection is highlighted). f The response time of the comparator box is measured to be ~15 ns.
Fig. 2
Fig. 2. Mapping out RPOC active pixels (APXs).
a An illustration of APX selection using different signal thresholds in the over-sampling condition. The green pulses and pixels indicate optical signals, the magenta pixels indicate APXs, and the blue pulses and pixels indicate the interaction pulses and pixels. b An illustration of APX selection using different optical intensities in the over-sampling condition. c An illustration of APX selection at larger pixel sizes for different optical signals. d Mixed fluorescent particles detected in the 570/60 nm channel excited by 800 nm pulses (left) and 1045 nm pulses (right). e APXs determined using different voltage threshold VT values for the signals from the 570/60 nm channel. f Comparing the 570/60 nm channel optical intensity when the RPOC is turned on (red) and off (green). g A pseudo-color stimulated Raman scattering (SRS) image containing PMMA (red) and PS (green) particles. h APXs determined using the PS peak at 2955 cm−1 (left), PMMA peak at 3060 cm−1 (right), and no Raman peaks at 2990 cm−1 (middle). i SRS spectra of PMMA (red) and PS (green). The red, green, and blue bars indicate wavenumbers used for RPOC in panel h. j An SRS image of MIA PaCa-2 cells in the lipid CH2 stretching region. k APXs determined using SRS signals from lipid droplets (LDs). l An overlay of the SRS image and the APXs turned on only at the LDs. m Time-lapse SRS images of an LD in a live MIA PaCa-2 cell (top row) and the corresponding APXs (bottom row) determined by the SRS signals. The color curves plot trajectories of the LD and the APXs in 200 s.
Fig. 3
Fig. 3. Digital logic control of active pixels (APXs).
a An illustration of electronics to select an intensity passband for the determination of APXs. b The APXs selected using only one comparator box with VT = 0.3 V (upper panel), the overlay of the APXs with the corresponding SRS image from the same field of view (middle panel), and a magnified image from the selected area (bottom panel). c APXs selected using two comparator boxes with the intensity range between 0.2–0.3 V (left panels) and 0.1–0.16 V (right panels). d Illustration of electronics to choose the AND function for determination of APXs using two comparator boxes. e An stimulated Raman scattering (SRS) image of MIA PaCa-2 cells at the CH2 stretching vibration. f A two-photon excitation fluorescence (TPEF) image of the MIA PaCa-2 cells labeled using endoplasmic reticulum (ER) Tracker. g An overlay of the TPEF image from the ER and the APXs determined using VT1 = 0.25 V (SRS) and VT2 = 0.1 V (TPEF). h An overlay of the TPEF image from ER and the APXs using VT1 = 0.25 V (SRS) and VT2 = 0.25 V (TPEF).
Fig. 4
Fig. 4. Precision control and quantitative comparison of site-specific chemical changes using RPOC.
a An illustration of switching states of CMTE between the open cis isomer (1a) and the closed isomer (1b) forms using blue and green light. b An illustration of the workflow for CMTE conversion by the RPOC using the 1510 cm−1 SRS signal and a 522 nm laser. AOM: acousto-optic modulator. c An stimulated Raman scattering (SRS) image at 2855 cm−1, at 1510 cm−1 before RPOC, the active pixels (APXs), at 1510 cm−1 after RPOC using VT = 0.17 V, the SRS intensity difference before and after RPOC, at 1510 cm−1 after the AOM constantly on for 20 frames. d Magnified images of the selected areas in panel c. e SRS intensity profiles of images and APXs along the dotted lines in panel d. The dashed curve shows the SRS intensity profile along the same line after 20 scan frames with AOM constantly on. f Integrated SRS intensity changes of CMTE as a function of the number of APXs for CMTE aggregates. Open squares are experimental results, the curve is the quadratic fitting. g Mean SRS intensity changes of CMTE as a function of the number of APXs for CMTE aggregates. Open circles are experimental results, the line is the linear fitting.
Fig. 5
Fig. 5. Precision control of chemical changes by RPOC using different optical intensity ranges.
a A stimulated Raman scattering (SRS) image of CMTE at 1510 cm−1 before RPOC (left), APXs selected by an upper threshold (VU) of 0.4 V and lower threshold (VL) of 0.15 V (middle left), an SRS image at 1510 cm−1 after the RPOC of the CMTE (middle right), and the SRS intensity difference before and after RPOC (right). b Magnified images from the highlighted regions in panel a. c SRS and APXs intensity profiles along the dotted lines in panel b. The dashed curve shows the SRS intensity profile along the same line after 20 scan frames with the acousto-optic modulator (AOM) constantly on. d Similar images as in panel a, using VU = 0.12 V and VL = 0.10 V for APX selection. e Magnified images from the selected regions in panel d. f SRS and APXs intensity profiles along the dotted lines in panel e. The dashed curve shows the SRS intensity profile along the same line after 20 scan frames with the AOM constantly on. The middle panel plots SRS intensity difference before and after RPOC.
Fig. 6
Fig. 6. Precision control of chemical changes by RPOC using digital logic from two detectors.
a Images of MIA PaCa-2 cells showing stimulated Raman scattering (SRS) signals at 2855 cm−1 CH2 stretching, the overlay of SRS signals from CMTE at 1510 cm−1 (red) and endoplasmic reticulum (ER) Tracker fluorescence signals (green), the overlay of active pixels (APXs, magenta) and ER-Tracker signals (green), and the CMTE SRS signal changes after RPOC. b Magnified images from the highlighted areas in panel a. c CMTE SRS intensity profiles before and after RPOC along the selected lines in panel b. d Intensity profiles of APXs. Colored bars highlight the positions of selected CMTE aggregrates in panel b.
Fig. 7
Fig. 7. Control of microtubule polymerization in cells using RPOC.
a Structures and light responses of PST-1. b UV-Vis spectra of PST-1 after blue and green light exposure. c Averaged two-photon excitation fluorescence (TPEF) images of EGFP-EB3 signals from transfected Kyoto HeLa cells before and after 400 nm light exposure. d Image analysis procedures and four time-windows for EGFP-EB3 TPEF signal comparison. e Overlays of EGFP-EB3 TPEF signals averaged for T1 (red) and T3 (green). f Active pixels (APXs) averaged in T2. Cells are treated with 4 μM PST-1 for 15 min before imaging and RPOC. g, h Area 1 selected in panel e (T1 vs T3) and Supplementary Fig. 12a (T3 vs T4), respectively. Arrows point out EGFP signal mismatches, indicating changing EB3 dynamics at the two time-windows. i TPEF intensity outlines of T1, T3, and T4 for Area 1. j Calculated percentage of TPEF signal changes for the three time-windows before and after RPOC in the centrosome areas for PST-1 treated and untreated cells. k, l Area 2 selected in panels e and Supplementary Fig. 12a, respectively. m Calculated percentage of TPEF signal changes for the three time-windows before and after RPOC in Area 2 for cells treated with PST-1.
Fig. 8
Fig. 8. Precision control of lipid droplet (LD) dynamics in live Kyoto HeLa cells.
a A stimulated Raman scattering (SRS) image of Kyoto HeLa cells at time 0. b Active pixels (APXs) from the same field of view at time 222 s. c Time-lapse SRS images of LDs from time 0 s to 220 s for Area 1 in panel a. Arrows showing dynamics of LDs in cells. d Overlays of SRS images and APXs from time 222 s to 442 s for Area 1 in panel a. Arrows show reduced LD dynamics during RPOC. e, f Time-lapse images similar to panels c and d but from Area 2 in panel a. The blue arrows in panel f show the active transport of an LD not associated with APXs. The red arrows show LDs controlled by RPOC associated with APXs. g LD trajectories before RPOC. h LD trajectories during RPOC. i LD trajectories during RPOC from only the APX-associated LDs. j Histograms of LD maximum displacement before RPOC (gray), during RPOC (red), and during RPOC for only LDs at APXs (blue).

References

    1. Enger J, Goksör M, Ramser K, Hagberg P, Hanstorp D. Optical tweezers applied to a microfluidic system. Lab. Chip. 2004;4:196–200. doi: 10.1039/B307960K. - DOI - PubMed
    1. Zhang H, Liu K-K. Optical tweezers for single cells. J. R. Soc. Interface. 2008;5:671–690. doi: 10.1098/rsif.2008.0052. - DOI - PMC - PubMed
    1. Daly M, Sergides M, Nic Chormaic S. Optical trapping and manipulation of micrometer and submicrometer particles. Laser Photonics Rev. 2015;9:309–329. doi: 10.1002/lpor.201500006. - DOI
    1. Boppart SA, et al. High-resolution optical coherence tomography-guided laser ablation of surgical tissue. J. Surg. Res. 1999;82:275–284. doi: 10.1006/jsre.1998.5555. - DOI - PubMed
    1. He H, et al. Manipulation of cellular light from green fluorescent protein by a femtosecond laser. Nat. Photonics. 2012;6:651–656. doi: 10.1038/nphoton.2012.207. - DOI

Publication types