. 2022 Jul 27;13(1):4340.
doi: 10.1038/s41467-022-32028-2.

Body size, shape and ecology in tetrapods

Affiliations

Body size, shape and ecology in tetrapods

Alice E Maher et al. Nat Commun. .

Abstract

Body size and shape play fundamental roles in organismal function and it is expected that animals may possess body proportions that are well-suited to their ecological niche. Tetrapods exhibit a diverse array of body shapes, but to date this diversity in body proportions and its relationship to ecology have not been systematically quantified. Using whole-body skeletal models of 410 extinct and extant tetrapods, we show that allometric relationships vary across individual body segments thereby yielding changes in overall body shape as size increases. However, we also find statistical support for quadratic relationships indicative of differential scaling in small-medium versus large animals. Comparisons of locomotor and dietary groups highlight key differences in body proportions that may mechanistically underlie occupation of major ecological niches. Our results emphasise the pivotal role of body proportions in the broad-scale ecological diversity of tetrapods.


Conflict of interest statement

The authors declare no competing interests.

Figures

Fig. 1
Fig. 1. Body size, shape and ecology in tetrapods.
To investigate the evolution of body shape and ecology in tetrapods we assembled a data set of A 410 extinct and extant terrestrial vertebrates from across Tetrapoda that captured major evolution changes in B locomotor and C trophic ecology and D body size. E From 3D digital skeletal models of these taxa we extracted a range of linear and volumetric measures and used them to derive measures of body size and shape using phylogenetic comparative approaches. Linear measurements included gleno-acetabular distance (GA), femur length (FL), shank segment length (SL), metatarsal segment length (MtL), pes segment length (PL), humerus length (HL), forearm segment length (FaL), metacarpal segment length (McL) and manus segment length (ML). WBCHV, whole-body convex hull volume. Animal images created with BioRender.com.
Fig. 2
Fig. 2. Scaling of major body segments in tetrapods.
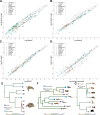
Scaling relationships between major body segment size and overall body size (total whole-body skeletal convex hull volume, WBCHV) in 410 terrestrial tetrapods using phylogenetically-informed linear (thick dashed lines) and quadratic (thin dotted lines) fits (Hypotheses 1-2). The A head, B neck and C torso are represented by volumes, while D gleno-acetabular (GA) distance, E total forelimb and F total hind limb size is represented by lengths. Isometry in AC would therefore be a slope of 1, and in DF a slope of 0.33. Full details of the regression model information can be found in Supplementary Data 1–14, including additional comparisons of scaling in individual limb segment lengths (Supplementary Fig. 1) and volumes. Taxa have been colour-coded by taxonomic order for display purposes. Source data are provided as a Source Data file.
Fig. 3
Fig. 3. Models of body size evolution in tetrapods.
Parameter estimates from the best fitting model of body size evolution under different evolutionary regimes defined by trophic ecology (80 OUMA and 20 OUMVA), for 100 sampled simulated evolutionary histories. A Long-term mean (θ), B selection strength (α), and C evolutionary rate (σ2) (Hypothesis 3). Each point corresponds to the parameter estimate for one of the sampled simulated evolutionary histories. Source data are provided as a Source Data file.
Fig. 4
Fig. 4. Relative limb and torso lengths in tetrapods.
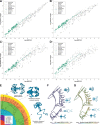
AG Limb reduction and torso elongation in aquatic, semi-aquatic and fossorial tetrapods (Hypothesis 4), and A elongate hind limbs in saltatorial tetrapods (Hypothesis 7). Phylogenetic-informed regression provides support for relatively small A hind limbs and B forelimbs, and large GA distance relative to overall size and particularly D average limb length in these locomotor groups. This tendency towards reduced limbs and an elongate torso can be seen within major taxonomic sub-groups that contain aquatic, semi-aquatic and fossorial species, including E Testudines (turtles and tortoises), F lizards and G rodents. WBCHV, whole-body convex hull volume. Source data are provided as a Source Data file. Animal images created with BioRender.com.
Fig. 5
Fig. 5. Forelimb lengths in tetrapods.
Forelimb elongation in flying and arboreal taxa (Hypothesis 5). Arboreal taxa have relatively long forelimb segments and are statistically different to several other locomotor groups. Active and soaring fliers are statistically supported as having the longest A humeral, B forearm, C metacarpal and D manus segment lengths of all locomotor categories. Both groups also show similar positive allometry in proximal limbs segments (A, B) that are statistically greater than most other locomotor categories but differ from each other in the allometry of distal forelimb segments (C, D). Colour-shaded phylogenetic trees to the right of each regression graph show the evolution of forelimb segment proportions in bats and across the non-avian to avian theropod transition using ancestral state reconstruction to highlight the nature and timing of the evolutionary acquisition of enlarged forelimbs relative to body size. WBCHV, whole-body convex hull volume. Source data are provided as a Source Data file. Animal images created with BioRender.com.
Fig. 6
Fig. 6. Evolution and scaling of torso and forelimb lengths in tetrapods.
Relative torso and forelimb size in quadrupedal striding and herbivorous taxa (Hypothesis 6). Results for the OUwie analysis for normalised torso volume in dietary categories, showing estimates of A macroevolutionary optimum (θ), B selection strength (ɑ) and C evolutionary rate (Hypothesis 3). In all three panels, each point corresponds to the parameter estimate for one of the sampled simulated evolutionary regimes. For all trophic regimes across tetrapods generally, the best fitting models for the torso were OU models, indicating some selection towards different torso volumes for taxa with different trophic ecologies. Consistent with Hypothesis 6, herbivores have higher long-term mean (θ) torso volume compared to other trophic ecologies. Insectivores had the lowest θ values, whereas piscivores show high uncertainty regarding the long-term mean. Carnivores are indistinguishable from omnivores, insectivores and piscivores in terms of θ. Allometric patterns support relatively large torso sizes and GA distances in D, E quadrupeds and G, H herbivores, supporting Hypothesis 6. However, contra to Hypothesis 6, these groups have relatively short forelimbs (F&I). WBCHV, whole-body convex hull volume. Source data are provided as a Source Data file.
Fig. 7
Fig. 7. Body proportions and quadrupedality in dinosaurs.
Ancestral state reconstructions of A trunk volume, B forelimb length, C hind limb to forelimb length ratio and D neck to forelimb length ratio during the transitions to quadrupedality in Dinosauria. The patterns seen during the independent acquisition of quadrupedality in ornithischians and sauropods in the relative proportions of the torso and forelimb mirror the wider allometric patterns seen in quadrupeds and herbivores generally (Fig. 6, Hypothesis 6). Relatively short forelimbs in quadrupedal dinosaurs may relate to coupling of forelimb and neck lengths to maintain the ability to graze near ground level. This is indirectly supported by the narrow and uniform range of neck to forelimb length ratio observed across quadrupedal dinosaurs with very different overall body proportions (D). Circled numbers represent: 1 = Ornithischia; 2 = Ceratopsia; 3=Ornithopoda; 4 = Thyreophora; 5 = Sauropods; 6 = Neosauropoda; 7= Titanisauriformes; 8 = Theropoda; 9 = Eumaniraptora. WBCHV, whole-body convex hull volume. Source data are provided as a Source Data file. Animal images created with BioRender.com.
Fig. 8
Fig. 8. Body proportions in saltatorial tetrapods.
Phylogenetic-informed regression provides support for relatively long A femur B, shank C metatarsal and D pes segment lengths in saltatorial taxa compared to most other tetrapod groups. Our saltatorial group is dominated by anurans, which have been hypothesised to have been conservative in their overall body proportions since the Triassic, which is qualitatively consistent with EG visual trends in ancestral state values recovered here. This apparent conservatism underpins the low levels of variability (e.g. coefficients of variation; Supplementary Data 63-84) seen in limb and body proportions in saltatorial taxa. This contrasts with much greater variability in distal limb segments seen in other locomotor groups, which may reflect the need for distal limb segments to interact directly with disparate environments in a range of locomotor and non-locomotor functions that carry varied mechanical demands. WBCHV, whole-body convex hull volume. Source data are provided as a Source Data file.
Fig. 9
Fig. 9. Evolution and scaling of relative head, neck and torso size in herbivorous tetrapods.
Results for the OUwie analysis for head to neck ratio evolution with respect to dietary ecology, showing estimates of A macroevolutionary optimum (θ), B selection strength (ɑ) and C evolutionary rate (Hypothesis 3). In all three panels, each point corresponds to the parameter estimate for one of the sampled simulated evolutionary regimes. Consistent with Hypothesis 8, carnivores have greater D head sizes relative to body size and A, G relative to neck size compared to herbivores and other trophic groups. Contra to Hypothesis 8, E neck size relative to body size appears to be similar between carnivores and herbivores. The tendency towards larger heads and smaller necks in carnivores compared to herbivores (particularly at larger body sizes) is reflected in evolutionary transitions between these dietary ecologies in H mammals, I dinosaurs and J birds. F Carnivores and herbivores have larger torso volumes relative to limb lengths than other trophic groups, but do not differ from each other. Circled numbers in H represent: 1= Pecora; 2 = Suina; 3 = Arctoidea; 4 = Canidae; 5 = Felidae). Circled numbers in I represent: 1 = Sauropoda; 2 = Neosauropoda; 3 = Titanasauriformes; 4 = Theropoda; 5 = Eumaniraptora). Circled numbers in (J) represent: 1= Aves; 2 = Palaeognathae; 3= Galliformes; 4 = Aequorlitornithes; 5 = Aequornithes; 6 = Accipitriformes; 7 = Afroaves; 8 = Australaves). WBCHV, whole-body convex hull volume. Source data are provided as a Source Data file. Animal images created with BioRender.com.

References

    1. Cuvier, G. L. C. F. D. Le règne animale. Deterville, Paris. (1817).
    1. Russell, E. S. Form and function: A contribution to the history of animal morphology. J. Murray. (1916).
    1. Lauder GV. Form and function: structural analysis in evolutionary morphology. Paleobiology. 1981;7:430–442. doi: 10.1017/S0094837300025495. - DOI
    1. Rushton JP, Rushton EW. Progressive changes in brain size and musculo-skeletal traits in seven hominoid populations. Hum. Evolution. 2004;19:173–196. doi: 10.1007/BF02438913. - DOI
    1. Clauss M, Steuer P, Müller DW, Codron D, Hummel J. Herbivory and body size: allometries of diet quality and gastrointestinal physiology, and implications for herbivore ecology and dinosaur gigantism. PLoS One. 2013;10:e68714. doi: 10.1371/journal.pone.0068714. - DOI - PMC - PubMed

Publication types