. 2022 Aug;608(7921):217-225.
doi: 10.1038/s41586-022-04994-6. Epub 2022 Jul 27.

Recording gene expression order in DNA by CRISPR addition of retron barcodes

Affiliations

Recording gene expression order in DNA by CRISPR addition of retron barcodes

Santi Bhattarai-Kline et al. Nature. 2022 Aug.

Abstract

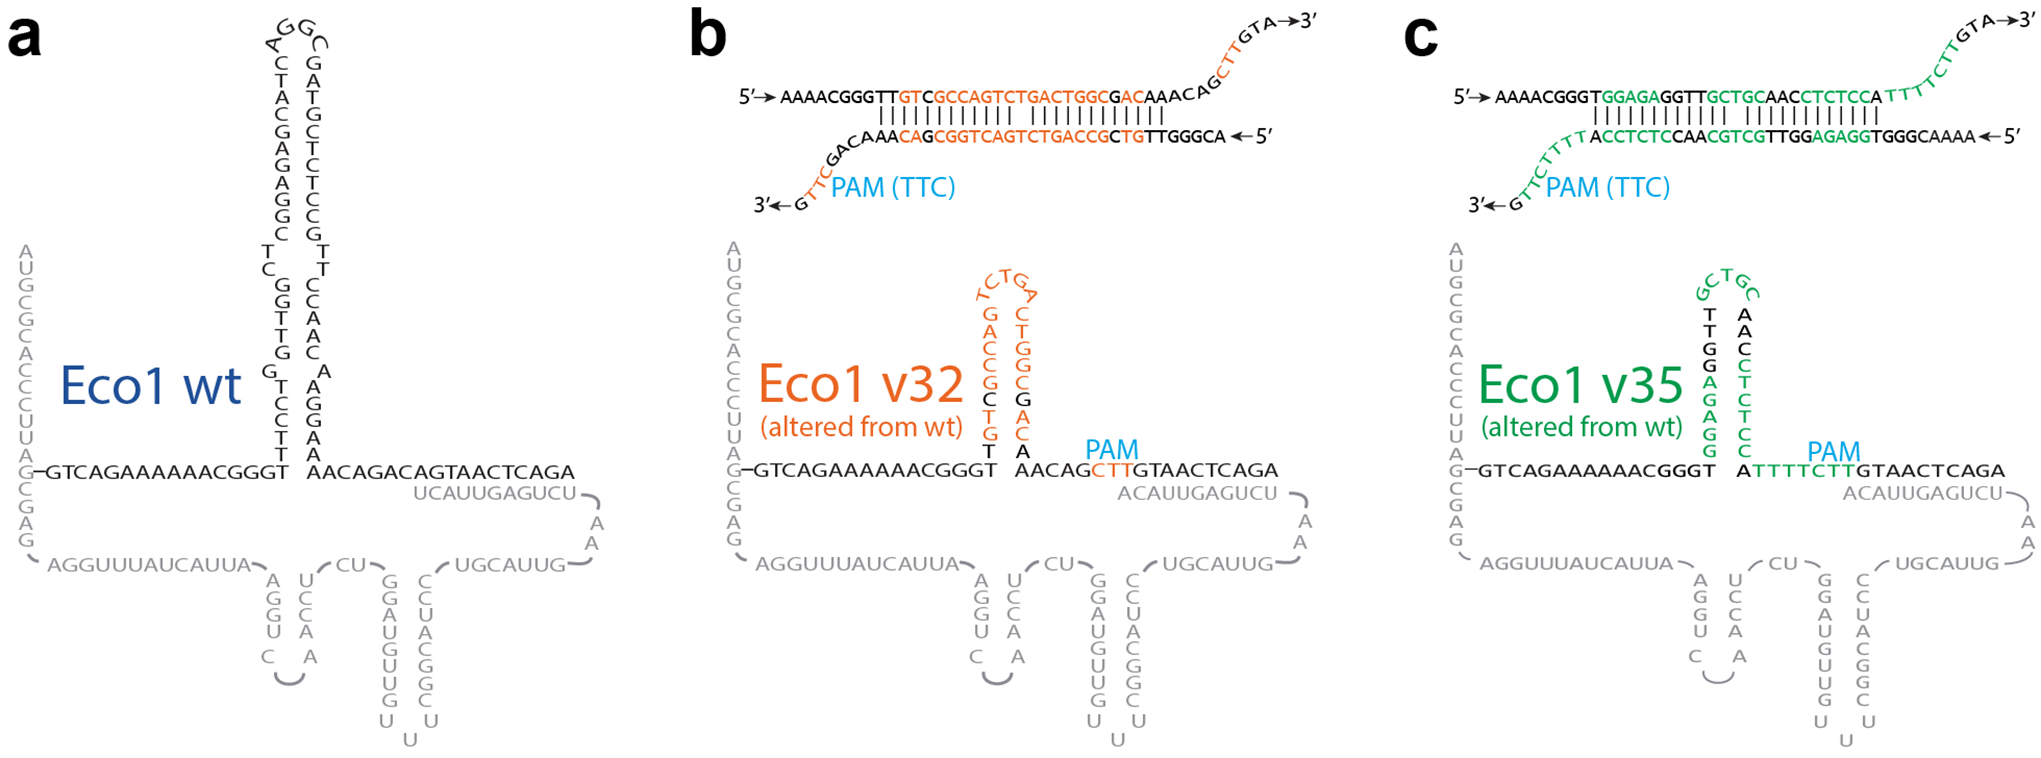
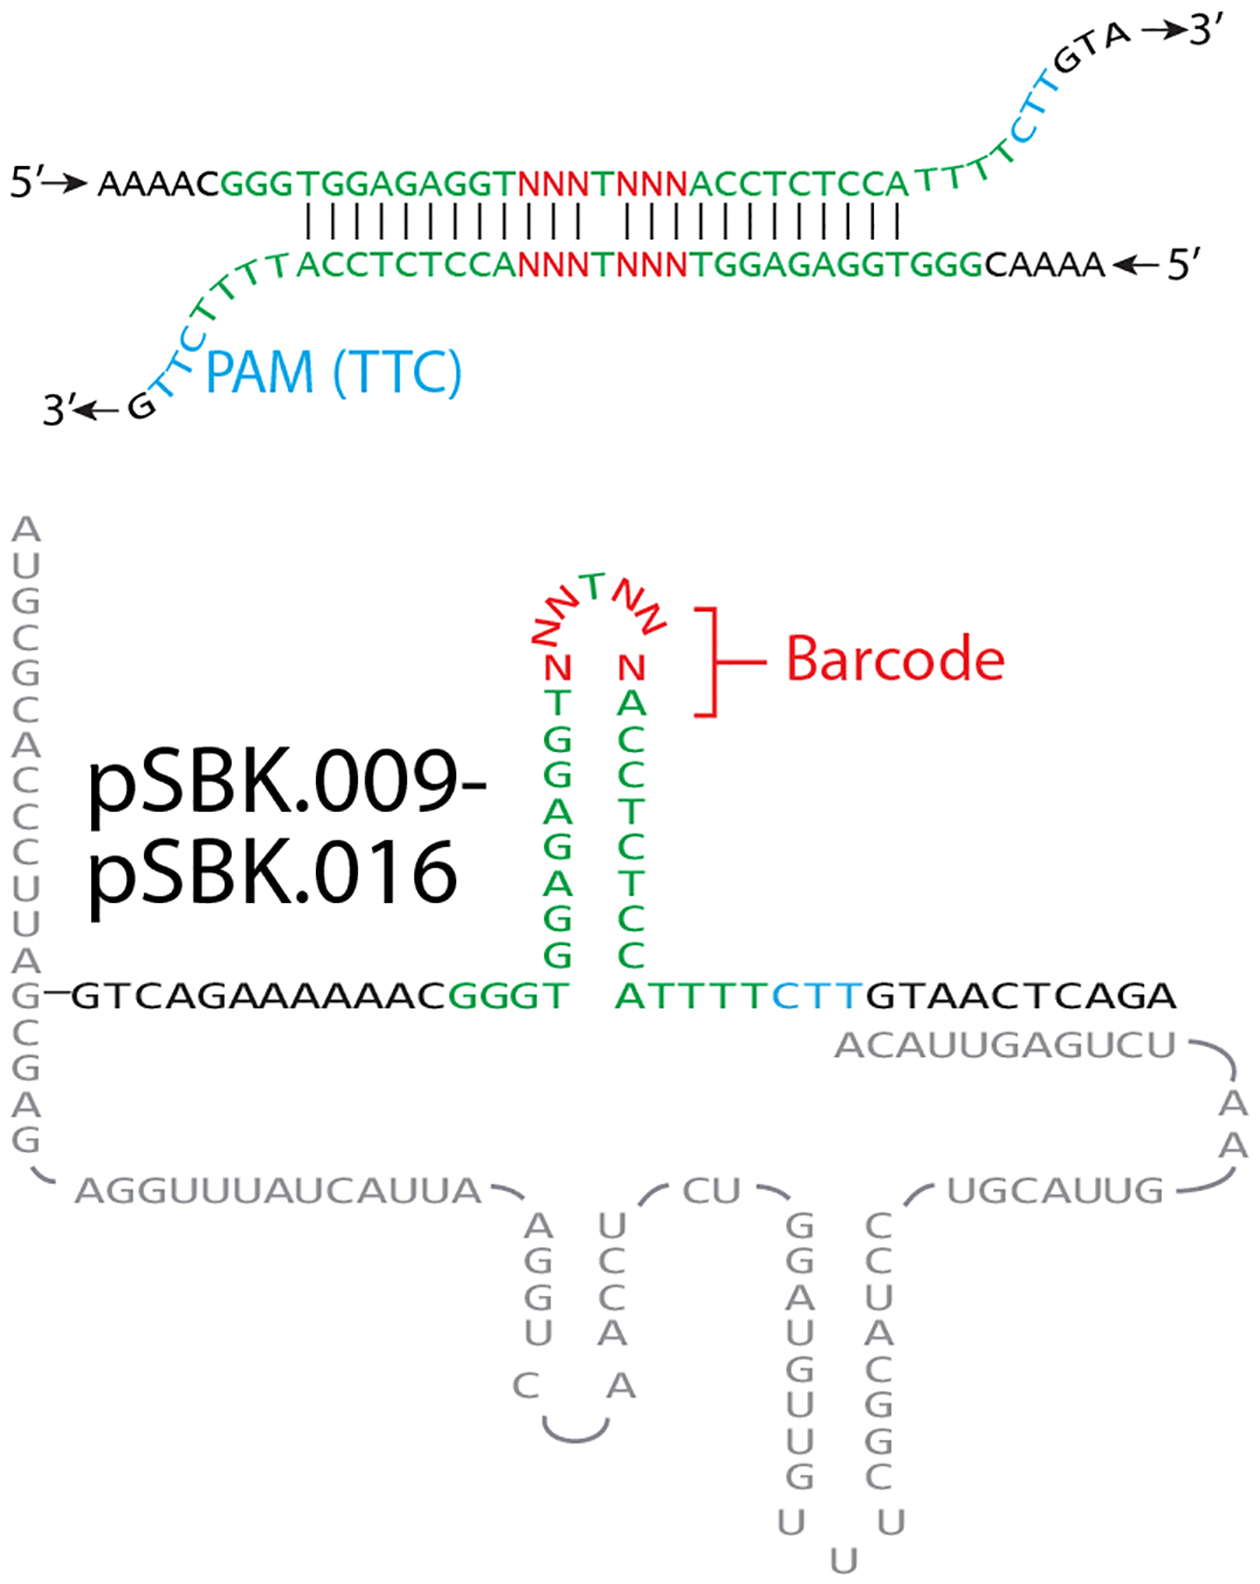
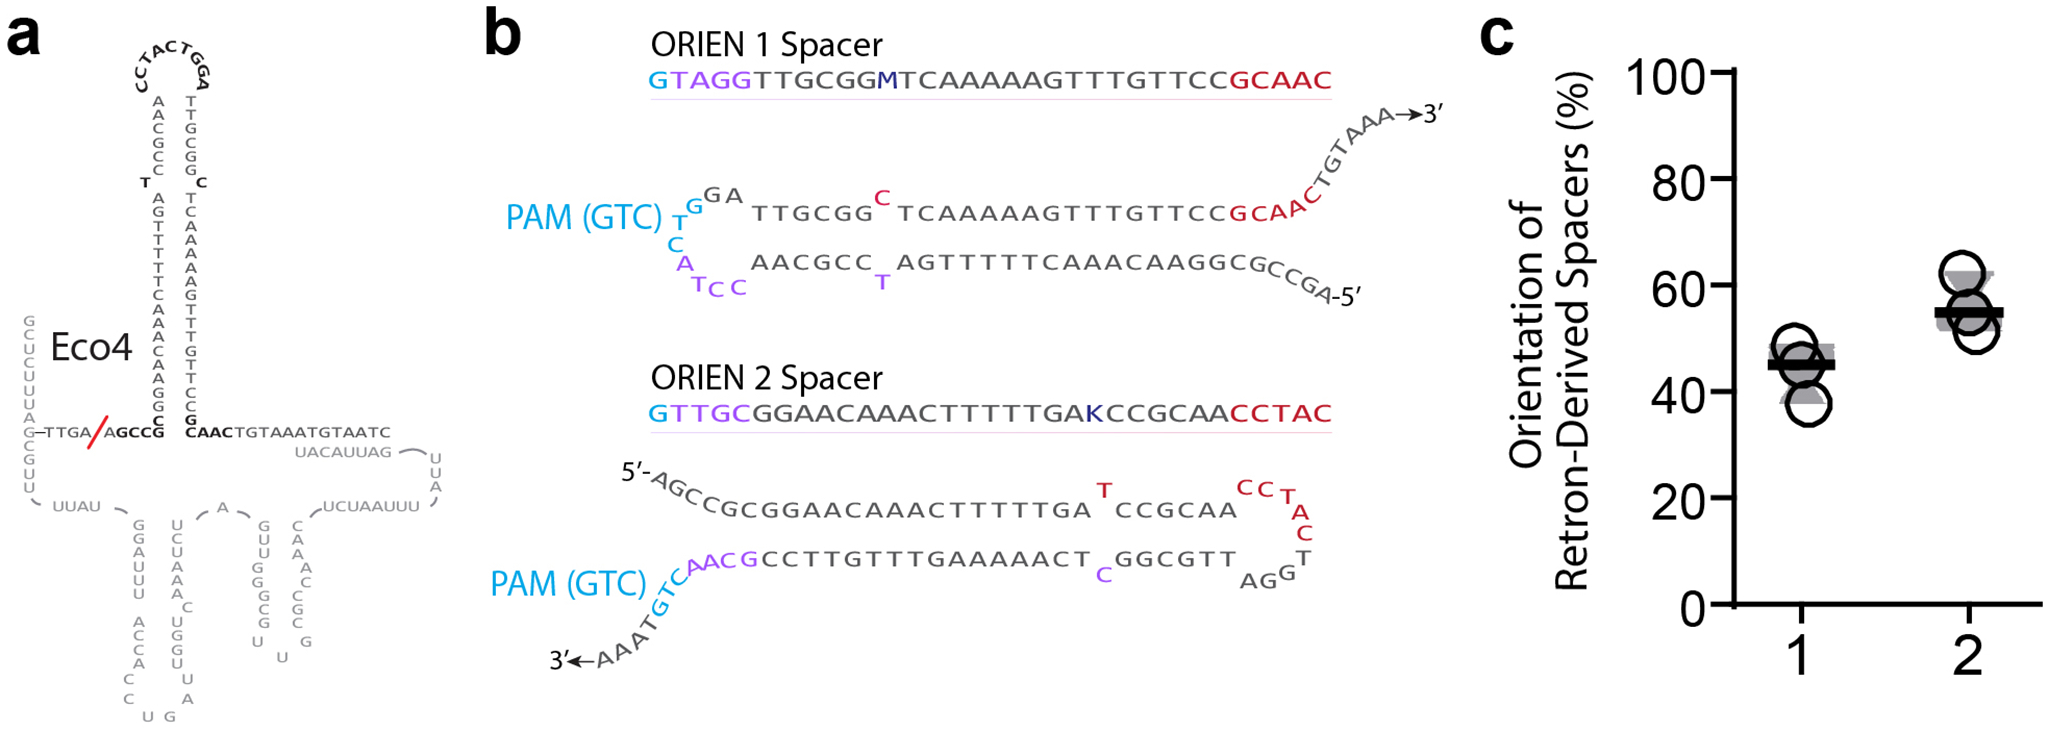
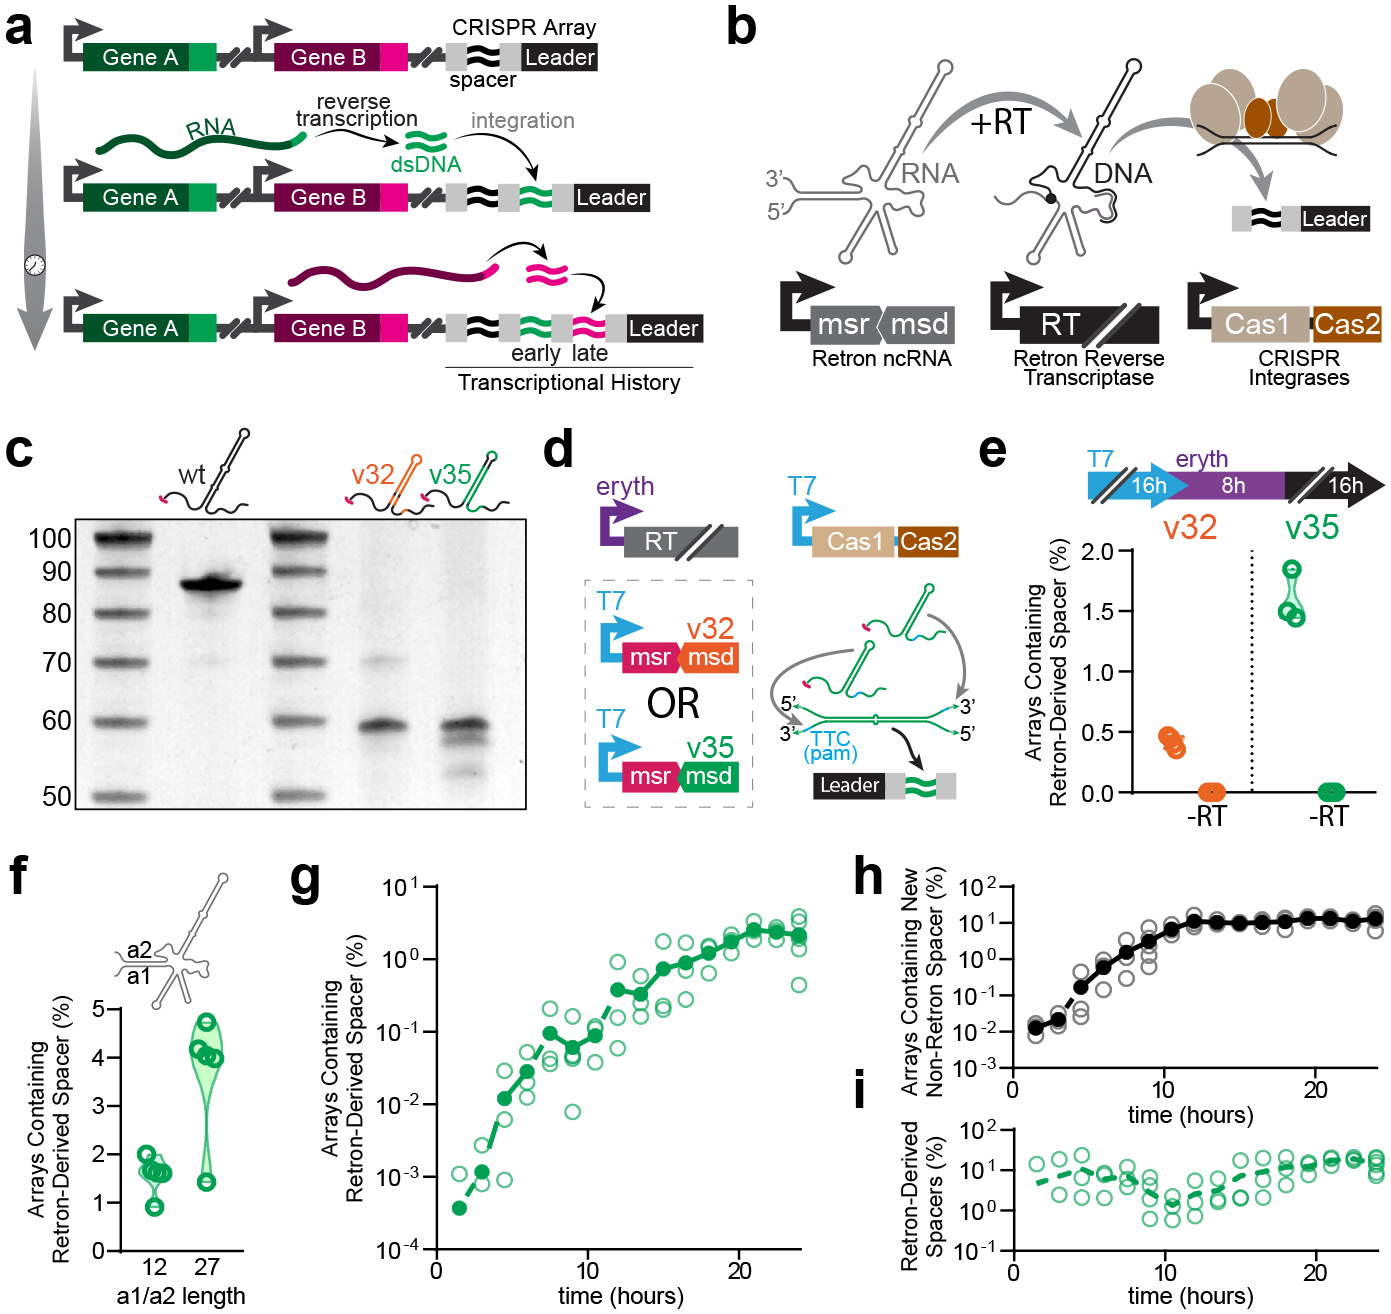
Biological processes depend on the differential expression of genes over time, but methods to make physical recordings of these processes are limited. Here we report a molecular system for making time-ordered recordings of transcriptional events into living genomes. We do this through engineered RNA barcodes, based on prokaryotic retrons1, that are reverse transcribed into DNA and integrated into the genome using the CRISPR-Cas system2. The unidirectional integration of barcodes by CRISPR integrases enables reconstruction of transcriptional event timing based on a physical record through simple, logical rules rather than relying on pretrained classifiers or post hoc inferential methods. For disambiguation in the field, we will refer to this system as a Retro-Cascorder.


Conflict of interest statement

COMPETING INTERESTS

S.L.S., G.M.C., M.G.S., and J.N. are named inventors on a patent application assigned to Harvard College, Method of Recording Multiplexed Biological Information into a CRISPR Array Using a Retron (US20200115706A1).

Figures

Extended Data Figure 1.
Extended Data Figure 1.. Accompaniment to Figure 1.
a. Hypothetical Eco1 wild-type ncRNA-linked RT-DNA structure. b. Hypothetical Eco1 v32 ncRNA-linked RT-DNA structure and hypothetical duplexed RT-DNA prespacer structure. Nucleotides that are altered from wild-type Eco1 are shown in orange. c. Hypothetical Eco1 v35 ncRNA-linked RT-DNA structure and hypothetical duplexed RT-DNA prespacer structure. Nucleotides that are altered from wild-type Eco1 are shown in green.
Extended Data Figure 2.
Extended Data Figure 2.. Accompaniment to Figure 2.
a. Hypothetical barcoded Eco1 v35 ncRNA-linked RT-DNA structure and hypothetical duplexed RT-DNA prespacer structure. Bases used to barcode retrons are shown in red.
Extended Data Figure 3.
Extended Data Figure 3.. Accompaniment to Figure 3.
a. Hypothetical wild-type Eco4 ncRNA-linked RT-DNA structure. ExoVII-dependent RT-DNA cleavage site is shown as a red slash. b. Eco4-derived spacer sequences and orientations. Bases are colored to match Figure 3f. c. Proportion of Eco4-derived spacers in each orientation. Open circles are individual biological replicates.
Extended Data Figure 4.
Extended Data Figure 4.. Change in YFP fluorescence when expressed using inducible promoters.
The Y-axis shows fluorescence (in arbitrary units) normalized to culture density (OD600).
Extended Data Figure 5.
Extended Data Figure 5.. Growth curves (upper plot) and max growth rates (lower plot) of E. coli with different combinations of retron recording components and inducers.
In growth curve plots the solid line is the mean OD600 of 3 biological replicates, with dotted lines showing the standard deviation. In maximum growth rate plots, each symbol is a single biological replicate. Bars show the mean and standard deviation. Statistically significant differences in maximum growth rate, as calculated by Tukey’s multiple comparison’s test, are highlighted. a. Growth kinetics of E. coli with different combinations of retron recording plasmids, all without inducers. b. Growth kinetics of E. coli with recording plasmid pSBK.079, with and without inducers. c. Growth kinetics of E. coli with signal plasmid pSBK.134, with and without inducers. Only one biological replicate is present in condition “pSBK.134 + aTc” (pink). d. Growth kinetics of E. coli with signal plasmid pSBK.136, with and without inducers. e. Growth kinetics of E. coli with signal plasmid pSBK.134 and recording plasmid pSBK.079, with and without inducers. f. Growth kinetics of E. coli with signal plasmid pSBK.136 and recording plasmid pSBK.079, with and without inducers.
Extended Data Figure 6.
Extended Data Figure 6.. Accompaniment to Figure 4.
a. Ordering rules for pSBK.134 “A”-before-“B” replicates. The scores for each rule, and the composite score, are shown for each individual replicate. X-containing boxes indicate that no informative arrays, for that particular rule, were present in that replicate. b. As in panel (a), ordering rules for pSBK.134 “B”-before-“A” replicates. c. As in panel (a), ordering rules for pSBK.136 “A”-before-“B” replicates. d. As in panel (a), ordering rules for pSBK.136 “B”-before-“A” replicates.
Extended Data Figure 7.
Extended Data Figure 7.. Long-term stability of retron-derived recordings in CRISPR arrays.
a. Ordering rules for 24+24-hour, “A”-before-“B” recordings during post-recording multiday culture. Individual and composite scores are shown for samples taken on days 0, 2, 5, and 9 of culture. Each open circle represents the score, for that rule, from a single biological replicate. A total of 3 biological replicates are shown here. b. Changes in ordering rule scores over time in biological replicate 1. c. Changes in ordering rule scores over time in biological replicate 2. d. Changes in ordering rule scores over time in biological replicate 3.
Figure 1.
Figure 1.. Cas1-Cas2 integrates retron RT-DNA.
a. Schematic representation of retroelement-based transcriptional recording into CRISPR arrays. b. Schematic representation of biological components of the retron-based recorder. c. Urea-PAGE visualization of RT-DNA from retron Eco1 ncRNA variants. From left to right (excluding ladders): wild-type Eco1, Eco1 v32, Eco1 v35. For gel source data, see Supplementary Figure 1. d. Schematic of experimental promoters used to test retron-recorder parts and cartoon of hypothetical duplex RT-DNA prespacer structure. e. Quantification of arrays expanded with retron-derived spacers using Eco1 variants v32 (orange) and v35 (green). Open circles represent 3 biological replicates. f. Quantification of arrays expanded with retron derived spacers with a wild-type (12 bp) and extended (27 bp) a1/a2 region. Open circles represent 5 biological replicates. g. Time series of array expansions from retron-derived spacers. Open circles represent biological replicates, closed circles are the mean. h. Time series of array expansions from non-retron-derived spacers. Open circles represent biological replicates, closed circles are the mean. i. Proportion of total new spacers that are retron-derived. Open circles represent biological replicates, dashed line is the mean. All statistics in Supplementary Table 1.
Figure 2.
Figure 2.. Diversification of retron-based barcodes.
a. Hypothetical structure of duplexed RT-DNA prespacer with 6-base barcode and retron-derived spacer. b. Quantification of array expansions from barcoded variants of retron Eco1 v35, showing both retron-derived (green/pink) and non-retron derived (black) spacers for each variant. Open circles represent 3 biological replicates. c. Left: Heatmap of in silico ability to distinguish between all barcoded Eco1 v35 variants. Right: Heatmap of in silico ability to distinguish between reduced set of barcoded Eco1 v35 variants. d. Heatmap of standard deviation between three separate trials of barcode discrimination test. Left: full set. Right: reduced set. All statistics in Supplementary Table 1.
Figure 3.
Figure 3.. Mechanism of RT-DNA spacer acquisition.
a. Hypothetical structure of duplexed Eco1 v35 RT-DNA prespacer and retron-derived spacer, with mismatched regions highlighted. b. Quantification of mismatch region sequences in spacers from cells expressing Eco1 v35 versus cells electroporated with oligo mimic. Bars represent the mean of 4 and 5 biological replicates for the retron and oligo-derived conditions, respectively (±SD). c. Urea-PAGE visualization of Eco1 RT-DNA. DBR1 treatment resolves 2’–5’ linkage. For gel source data, see Supplementary Figure 1. d. Quantification of mismatch region sequences in spacers from cells electroporated with purified, debranched Eco1 v35 RT-DNA. Bars represent the mean of 4 biological replicates (±SD). e. Quantification of array expansions from different prespacer substrates. Open circles represent 3, 2, and 5 biological replicates (left-right). f. Schematic of Eco4 RT-DNA, in both orientations, with mismatch sequences highlighted. g. Quantification of mismatch region sequences in cells expressing Eco4 versus cells electroporated with oligo mimic. Bars represent the mean of 3 biological replicates (±SD). h. Urea-PAGE visualization of Eco4 RT-DNA. DBR1 does not cause size shift of Eco4 RT-DNA. For gel source data, see Supplementary Figure 1. i. Quantification of array expansions from retron Eco4. Open circles represent 3 biological replicates (left-right). All statistics in Supplementary Table 1.
Figure 4.
Figure 4.. Temporal recordings of gene expression.
a. Schematic of signal plasmid pSBK.134 used to express ncRNAs “A” and “B”, and recording plasmid used to express Eco1-RT and Cas1 and 2. b. Accumulation of retron-derived spacers from pSBK.134 after 24 hours of induction from their respective promoters (4 biological replicates). c. Retron-derived spacers when ncRNAs were induced in the order “A” then “B” from pSBK.134. Filled circles represent the mean of four biological replicates (±SEM). d. Retron-derived spacers when ncRNAs were induced in the order “B” then “A” from pSBK.134. Filled circles represent the mean of four biological replicates (±SEM). e. Non-retron-derived spacers in cells harboring pSBK.134, in both induction conditions. Filled circles represent the mean of four biological replicates (±SEM). f. Schematic of signal plasmid pSBK.136 used to express ncRNAs “A” and “B”, and the recording plasmid. g. Accumulation of retron-derived spacers from pSBK.136 after 24 hours of induction from their respective promoters (4 biological replicates). Outlier sample determined by Grubbs’ test denoted as a grey “X”. h. Retron-derived spacers when ncRNAs were induced in the order “A” then “B” from pSBK.136. Filled circles represent the mean of three biological replicates (±SEM). i. Retron-derived spacers when ncRNAs were induced in the order “B” then “A” from pSBK.136. Filled circles represent the mean of four biological replicates (±SEM). j. Non-retron-derived spacers in cells harboring pSBK.136, in both induction conditions. Filled circles represent the mean of four biological replicates (±SEM). k. Graphical representation of the rules used to determine order of expression from arrays. l. Ordering analysis of recording experiments with signal plasmid pSBK.134. Open circles are 6 biological replicates. m. Ordering analysis of recording experiments with signal plasmid pSBK.136. Open circles are 5 biological replicates. All statistics in Supplementary Table 1.
Figure 5.
Figure 5.. Modeling the Limits of Retron Recording.
a. Simulation of 100 replicates each of A-then-B and B-then-A recordings using acquisition rate data from pSBK.134 recordings. Each point represents the calculated ordering score from a single replicate of 1 million arrays. b. Simulation of 100 replicates each of A-then-B and B-then-A recordings using acquisition rate data from pSBK.136 recordings. Each point represents the calculated ordering score from a single replicate of 1 million arrays. c. Simulation of varying the number of arrays analyzed per sample using acquisition rate data from pSBK.134 recordings. Each box with whiskers represents 100 simulated replicates, with whiskers extending from minimum to maximum. d. Simulation of varying the length of each epoch in a retron recording using acquisition rate data from pSBK.134 (blue). Overlaid with real retron recordings of the same length (purple). Each box with whiskers represents 100 simulated replicates of 1 million reads each, with whiskers spanning from minimum to maximum. Each overlaid point is a single biological replicate. Recording experiments with 6, 12, and 48-hour epochs were done in triplicate. Recording experiments with epoch length of 24 hours are the same as in Figure 4l. e. Simulation of varying the strength of signal B when signal A remains constant. 1x acquisition rates were obtained from pSBK.134 recordings. Each box with whiskers represents 50 simulated replicates of 1 million arrays each. Whiskers span from minimum to maximum. f. Simulation of varying the strength of signal B when signal A is decreased or increased by a factor of 8. 1x acquisition rates were obtained from pSBK.134 recordings. Each box with whiskers represents 50 simulated replicates of 1 million arrays each. Whiskers span from minimum to maximum.

Comment in

References

    1. Simon AJ, Ellington AD & Finkelstein IJ Retrons and their applications in genome engineering. Nucleic Acids Res 47, 11007–11019, doi: 10.1093/nar/gkz865 (2019). - DOI - PMC - PubMed
    1. Barrangou R et al. CRISPR provides acquired resistance against viruses in prokaryotes. Science 315, 1709–1712, doi: 10.1126/science.1138140 (2007). - DOI - PubMed
    1. Church GM, Gao Y & Kosuri S Next-Generation Digital Information Storage in DNA. Science 337, 1628–1628, doi: 10.1126/science.1226355 (2012). - DOI - PubMed
    1. Shipman SL, Nivala J, Macklis JD & Church GM CRISPR–Cas encoding of a digital movie into the genomes of a population of living bacteria. Nature 547, 345–349, doi: 10.1038/nature23017 (2017). - DOI - PMC - PubMed
    1. Yim SS et al. Robust direct digital-to-biological data storage in living cells. Nat Chem Biol 17, 246–253, doi: 10.1038/s41589-020-00711-4 (2021). - DOI - PMC - PubMed