. 2022 Aug;608(7922):336-345.
doi: 10.1038/s41586-022-05010-7. Epub 2022 Jul 27.

Dairying, diseases and the evolution of lactase persistence in Europe

Richard P Evershed  1 George Davey Smith  2   3   4 Mélanie Roffet-Salque  5 Adrian Timpson  6   7 Yoan Diekmann  6   8 Matthew S Lyon  9   10   11 Lucy J E Cramp  12 Emmanuelle Casanova  13 Jessica Smyth  13   14 Helen L Whelton  13 Julie Dunne  13 Veronika Brychova  15   16 Lucija Šoberl  13 Pascale Gerbault  6   17 Rosalind E Gillis  18   19 Volker Heyd  12   20 Emily Johnson  21   22 Iain Kendall  13 Katie Manning  23 Arkadiusz Marciniak  24 Alan K Outram  21 Jean-Denis Vigne  18 Stephen Shennan  25 Andrew Bevan  25 Sue Colledge  25 Lyndsay Allason-Jones  26 Luc Amkreutz  27 Alexandra Anders  28 Rose-Marie Arbogast  29 Adrian Bălăşescu  30 Eszter Bánffy  31   32 Alistair Barclay  33 Anja Behrens  34 Peter Bogucki  35 Ángel Carrancho Alonso  36 José Miguel Carretero  37   38 Nigel Cavanagh  39 Erich Claßen  40 Hipolito Collado Giraldo  41   42 Matthias Conrad  43 Piroska Csengeri  44 Lech Czerniak  45 Maciej Dębiec  46 Anthony Denaire  47 László Domboróczki  48 Christina Donald  49 Julia Ebert  50 Christopher Evans  51 Marta Francés-Negro  37 Detlef Gronenborn  52 Fabian Haack  53 Matthias Halle  43 Caroline Hamon  54 Roman Hülshoff  55 Michael Ilett  54 Eneko Iriarte  37 János Jakucs  31 Christian Jeunesse  29 Melanie Johnson  56 Andy M Jones  57 Necmi Karul  58 Dmytro Kiosak  59   60 Nadezhda Kotova  61 Rüdiger Krause  62 Saskia Kretschmer  43 Marta Krüger  63 Philippe Lefranc  64 Olivia Lelong  65   66 Eva Lenneis  67 Andrey Logvin  68 Friedrich Lüth  34 Tibor Marton  31 Jane Marley  69 Richard Mortimer  70 Luiz Oosterbeek  42   71   72 Krisztián Oross  31 Juraj Pavúk  73 Joachim Pechtl  74   75 Pierre Pétrequin  76 Joshua Pollard  77 Richard Pollard  78 Dominic Powlesland  79 Joanna Pyzel  45 Pál Raczky  28 Andrew Richardson  80 Peter Rowe  81   82 Stephen Rowland  83 Ian Rowlandson  84 Thomas Saile  85 Katalin Sebők  28 Wolfram Schier  50 Germo Schmalfuß  43 Svetlana Sharapova  86 Helen Sharp  78 Alison Sheridan  87 Irina Shevnina  68 Iwona Sobkowiak-Tabaka  88   89 Peter Stadler  67 Harald Stäuble  43 Astrid Stobbe  62 Darko Stojanovski  90   91 Nenad Tasić  92 Ivo van Wijk  93 Ivana Vostrovská  94   95 Jasna Vuković  92 Sabine Wolfram  96 Andrea Zeeb-Lanz  97 Mark G Thomas  98   99
Affiliations

Dairying, diseases and the evolution of lactase persistence in Europe

Richard P Evershed et al. Nature. 2022 Aug.

Erratum in

  • Author Correction: Dairying, diseases and the evolution of lactase persistence in Europe.
    Evershed RP, Davey Smith G, Roffet-Salque M, Timpson A, Diekmann Y, Lyon MS, Cramp LJE, Casanova E, Smyth J, Whelton HL, Dunne J, Brychova V, Šoberl L, Gerbault P, Gillis RE, Heyd V, Johnson E, Kendall I, Manning K, Marciniak A, Outram AK, Vigne JD, Shennan S, Bevan A, Colledge S, Allason-Jones L, Amkreutz L, Anders A, Arbogast RM, Bălăşescu A, Bánffy E, Barclay A, Behrens A, Bogucki P, Carrancho Alonso Á, Carretero JM, Cavanagh N, Claßen E, Collado Giraldo H, Conrad M, Csengeri P, Czerniak L, Dębiec M, Denaire A, Domboróczki L, Donald C, Ebert J, Evans C, Francés-Negro M, Gronenborn D, Haack F, Halle M, Hamon C, Hülshoff R, Ilett M, Iriarte E, Jakucs J, Jeunesse C, Johnson M, Jones AM, Karul N, Kiosak D, Kotova N, Krause R, Kretschmer S, Krüger M, Lefranc P, Lelong O, Lenneis E, Logvin A, Lüth F, Marton T, Marley J, Mortimer R, Oosterbeek L, Oross K, Pavúk J, Pechtl J, Pétrequin P, Pollard J, Pollard R, Powlesland D, Pyzel J, Raczky P, Richardson A, Rowe P, Rowland S, Rowlandson I, Saile T, Sebők K, Schier W, Schmalfuß G, Sharapova S, Sharp H, Sheridan A, Shevnina I, Sobkowiak-Tabaka I, Stadler P, Stäuble H, Stobbe A, Stojanovski D, Tasić N, van Wijk I, Vostrovská I, Vuković J, W… See abstract for full author list ➔ Evershed RP, et al. Nature. 2022 Sep;609(7927):E9. doi: 10.1038/s41586-022-05227-6. Nature. 2022. PMID: 36042335 No abstract available.

Abstract

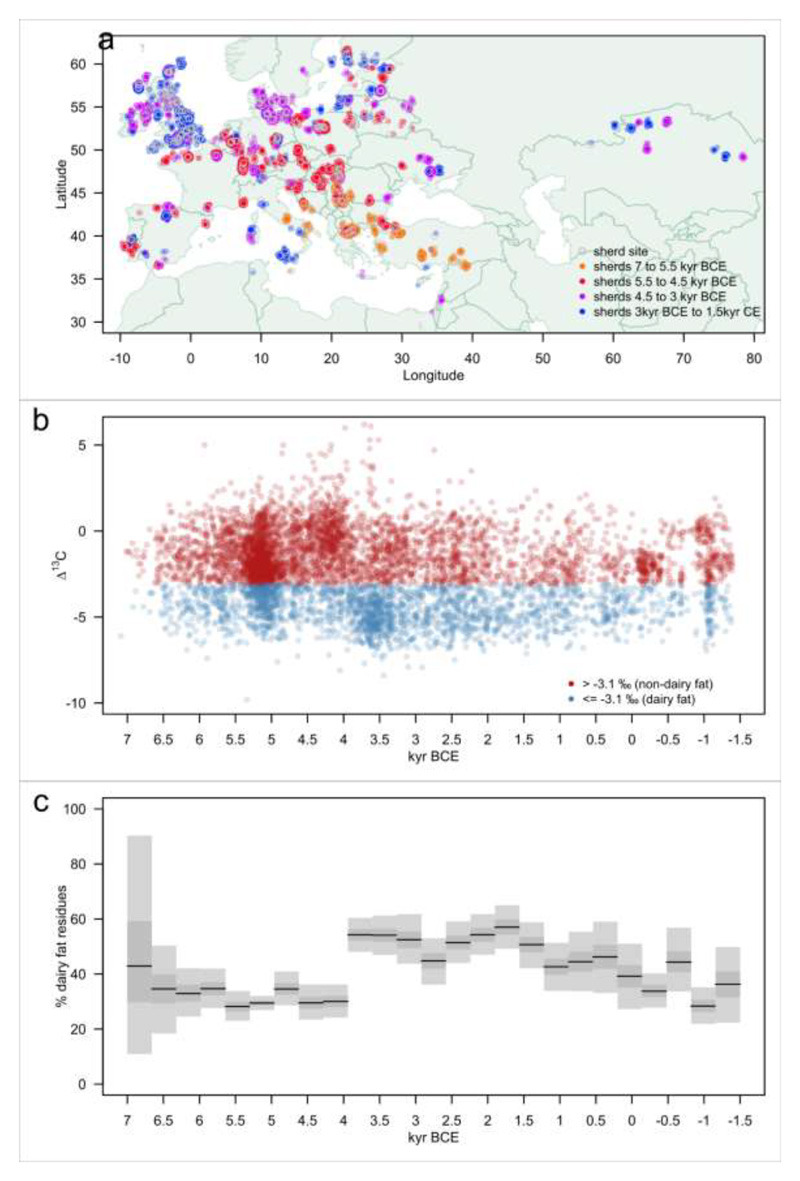
In European and many African, Middle Eastern and southern Asian populations, lactase persistence (LP) is the most strongly selected monogenic trait to have evolved over the past 10,000 years1. Although the selection of LP and the consumption of prehistoric milk must be linked, considerable uncertainty remains concerning their spatiotemporal configuration and specific interactions2,3. Here we provide detailed distributions of milk exploitation across Europe over the past 9,000 years using around 7,000 pottery fat residues from more than 550 archaeological sites. European milk use was widespread from the Neolithic period onwards but varied spatially and temporally in intensity. Notably, LP selection varying with levels of prehistoric milk exploitation is no better at explaining LP allele frequency trajectories than uniform selection since the Neolithic period. In the UK Biobank4,5 cohort of 500,000 contemporary Europeans, LP genotype was only weakly associated with milk consumption and did not show consistent associations with improved fitness or health indicators. This suggests that other reasons for the beneficial effects of LP should be considered for its rapid frequency increase. We propose that lactase non-persistent individuals consumed milk when it became available but, under conditions of famine and/or increased pathogen exposure, this was disadvantageous, driving LP selection in prehistoric Europe. Comparison of model likelihoods indicates that population fluctuations, settlement density and wild animal exploitation-proxies for these drivers-provide better explanations of LP selection than the extent of milk exploitation. These findings offer new perspectives on prehistoric milk exploitation and LP evolution.


Conflict of interest statement

Competing interest declaration

The authors have no competing interests.

Figures

Figure ED1
Figure ED1. Regional fluctuations in milk use throughout European prehistory
Percentage of milk fats through time, calculated using all animal fat residues. Grey bars and black lines illustrate 95%, 50% CI and MAP in each time slice, using a uniform prior.
Figure ED2
Figure ED2. Summary of model selection results for the tested ecological time series.
Inverse solar insolation, fluctuations in population level, and residential density yield models significantly better than a null model of constant selection. See Table ED1 for corresponding parameter estimates, and multiple testing correction (no change in the set of significant models). Abbreviations: assimilation (assi.), inverse (inv.), fluctuation (fluc.)
Figure ED3
Figure ED3. A-D—Most likely models fitted to four ecological proxy variables yielding likelihoods significantly better than a constant selection model.
Although LP is generally thought of as a dominant trait, we only show the additive model results as the parameter estimates barely differ. Abbreviations: inverse (inv.), population (pop.), fluctuation (fluc.)
Figure ED4
Figure ED4. Parameter estimation accuracy without drift.
True and inferred parameters □ and □ for three replicates of each of nine parameter combinations, simulated based on the milk exploitation ecological proxy and with initial allele frequency. □0 = 0.005. Abbreviations: frequency (freq.)
Figure ED5
Figure ED5. Parameter estimation accuracy in relation to the number of derived alleles simulated without drift.
The simulations shown in Figure ED4 were repeated with altered initial allele frequencies □0 ∈ {0.0005,0.01}, and the entire set including □0 = 0.005. plotted as a function of the number of simulated derived alleles. The vertical line indicates the 30 derived alleles present in our aDNA dataset. Abbreviations: number (nb.), derived (der.)
Figure ED6
Figure ED6. Likelihood differences between constant and fluctuating selection model driven by milk exploitation in relation to the number of derived alleles simulated without drift.
Same simulations as in Figure ED5. Note that parameter optimisation on simulated data was not initialised with the parameters found for the constant model, which can lead to likelihoods of the milk model to fall below the one of the former. Abbreviations: number (nb.), estimate (est.), derived (der.)
Figure ED7
Figure ED7. Effect of noise in milk exploitation ecological proxy on parameter estimates and likelihood differences.
For each simulation presented in Figure ED4, optimisation was repeated with a noisy version of the milk exploitation variable (see Method section on aDNA analysis, subsection ‘Power analysis’ for details on how noise was simulated), and the effect on parameter estimates and likelihood differences quantified. Abbreviations: average (avg.), absolute (abs.), maximum (max.), frequency (freq.), significance (sig.)
Figure ED8
Figure ED8. A-B—Parameter estimation accuracy with drift.
Same experiment as presented in Figure ED4, but with drift at two levels (□ ∈ {1,000, 10,000}) affecting the simulated allele frequency trajectories. Abbreviations: average (avg.), absolute (abs.), frequency (freq.), significance (sig.)
Figure ED9
Figure ED9. A-B—Parameter estimation accuracy in relation to the number of derived alleles simulated with drift.
Replotting of data from Figure ED8 as a function of the number of simulated derived alleles. Abbreviations: average (avg.), absolute (abs.), frequency (freq.), significance (sig.)
Figure ED10
Figure ED10. A-B—Likelihood differences between constant and fluctuating selection model driven by milk exploitation in relation to the number of derived alleles simulated with drift.
Same simulations as in Figure ED8 and ED9. Note that parameter optimisation on simulated data was not initialised with the parameters found for the constant model, which can lead to likelihoods of the milk model to fall below the one of the former. Abbreviations: average (avg.), absolute (abs.), frequency (freq.), significance (sig.)
Figure 1
Figure 1. Geographic and temporal distribution of archaeological milk fat residues in potsherds.
(a) Coloured circles illustrate 6,899 potsherds with animal fats from 826 phases from 554 sites (grey circles). Coloured circles are jittered to prevent perfect overlay, enabling the number of sherds to be visualised. (b) Plot of Δ13C values for all 6,899 animal fat residues extracted from prehistoric potsherds through time. Each point corresponds to an individual measurement on a potsherd, with its position on the Y-axis randomly sampled from the uniform date range of the associated archaeological phase. Animal fats with Δ13C values ≤ -3.1% are defined as ruminant milk fats. Mare’s milk is not characterised using this proxy and would thus be defined as —non-milk”. (c) Percentage of dairy fat residues through time, calculated using all animal fat residues. Grey bars and black lines illustrate 95%, 50% Credible Intervals and Maximum a Posteriori in each time slice, using a uniform prior.
Figure 2
Figure 2. Regional variation in milk use in prehistoric Europe.
Interpolated time slices of the frequency of dairy fat residues in potsherds (colour hue) and confidence in the estimate (colour saturation) using 2D kernel density estimation. Bandwidth and saturation parameters were optimised using cross-validation. Circles indicate the observed frequencies at site-phase locations. The broad SE to NW cline of colour saturation at the beginning of the Neolithic illustrates a sampling bias towards earliest evidence of milk. Substantial heterogeneity in milk exploitation is evident across mainland Europe. In contrast, British Isles and Western France maintain a gradual decline across 7ka after first evidence of milk c. 5.5 ka BCE. Note that interpolation can colour some areas (particularly islands) where no data is present.
Figure 3
Figure 3. Regional variation in prehistoric LP allele frequencies in Europe.
Observed ancient DNA data illustrated with blue and red dots showing the date and location of 3,057 LP and LNP alleles (rs4988235-A and rs4988235-G, respectively) from 1,770 ancient individuals. Grey bars and black lines show the 95%, 50% Credible Intervals and Maximum a Posteriori in time slices, using a Jeffreys prior. Slices with no observations remain blank. Blue overlay illustrates the null model of a constant selection rate through time (different in each region), using the sigmoid curve (theoretical expectation). Blue lines illustrate maximum likelihood sigmoid curves fitted directly to the observed alleles. Blue shading represents the 95%, CI, 50% CI estimated from sigmoid joint parameters using MCMC. Likelihood function for sigmoid curves are constrained by three conservative prior beliefs to avoid absurd parameter combinations for regions with sparse data: 1) constant selection is below 10% per 28 yr generation; 2) LP frequencies are <1% at 10 kyr BCE; 3) LP frequencies are >1% at 2 kyr CE. Small purple dots represent observed LP frequencies in modern populations in the same regions, as reported in Itan et al. supplementary data, large purple dots represent a weighted average of these modern populations.
Figure 4
Figure 4. Lactase persistence variant association with health outcomes.
Variant associations with continuous (SD unit) or binary (OR/HR) outcomes adjusted for age, sex, and top 40 genetic principal components. Unrelated estimates were produced using an unrelated white British subset of UK Biobank (n = 336,988). Within-family estimates were produced using 40,273 siblings from 19,521 families. Within-family estimates of all cause-mortality, flavoured milk intake yesterday, and milk intake yesterday could not be determined. IGF-1, insulin-like -growth factor 1. OR, odds ratio. HR, hazard ratio. Lactose-free diet (derived from field 20086 from the UK Biobank); Cows’ milk consumer (derived from field 1418); Mortality (derived from field 40007); Body Mass Index (field 21001); Father’s age at death (field 1807); Flavoured milk intake yesterday (field 100530); Heel bone mineral density (field 78); IGF-1 (field 30770); Milk intake yesterday (field 100520); Mother’s age at death (field 3526); Number of children fathered (field 2405); Number of live births (field 2734); Standing height (field 50); Vitamin D (field 30890).
Methods Fig 1
Methods Fig 1. Replication of Fig 1 tile C, using different thresholds for defining sherds as containing dairy fats. Correlation coefficients between all 6 comparisons vary from 0.712 to 0.982.
Methods Fig. 2
Methods Fig. 2. Bandwidth and saturation exponent parameters for interpolation plots were selected using a cross validation grid search, partitioning the observed data into an 80% training set and 20% test set. 1,000 random partitions were performed for each parameter pair, to generate a reliable summary statistic (distance between accuracy and saturation). Best estimates selected were bandwidth = 6.18 and the saturation exponent = 0.0538.

Comment in

References

    1. Sabeti PC, et al. Positive natural selection in the human lineage. Science. 2006;312:1614. - PubMed
    1. Evershed RP, et al. Earliest date for milk use in the Near East and southeastern Europe linked to cattle herding. Nature. 2008;455:528–531. - PubMed
    1. Debono Spiteri C, et al. Regional asynchronicity in dairy production and processing in early farming communities of the northern Mediterranean. Proc Natl Acad Sci USA. 2016;113:13594–13599. - PMC - PubMed
    1. Collins R. What makes UK Biobank special? Lancet. 2012;379:1173–1174. - PubMed
    1. Allen NE, Sudlow C, Peakman T, Collins R. UK Biobank Data: Come and Get It. Sci Transl Med. 2014;6:224ed224 - PubMed

Publication types