. 2022 Jul 27;22(1):647.
doi: 10.1186/s12879-022-07628-4.

SARS-CoV-2 lineage dynamics in England from September to November 2021: high diversity of Delta sub-lineages and increased transmissibility of AY.4.2

Collaborators, Affiliations

SARS-CoV-2 lineage dynamics in England from September to November 2021: high diversity of Delta sub-lineages and increased transmissibility of AY.4.2

Oliver Eales et al. BMC Infect Dis. .

Abstract

Background: Since the emergence of SARS-CoV-2, evolutionary pressure has driven large increases in the transmissibility of the virus. However, with increasing levels of immunity through vaccination and natural infection the evolutionary pressure will switch towards immune escape. Genomic surveillance in regions of high immunity is crucial in detecting emerging variants that can more successfully navigate the immune landscape.

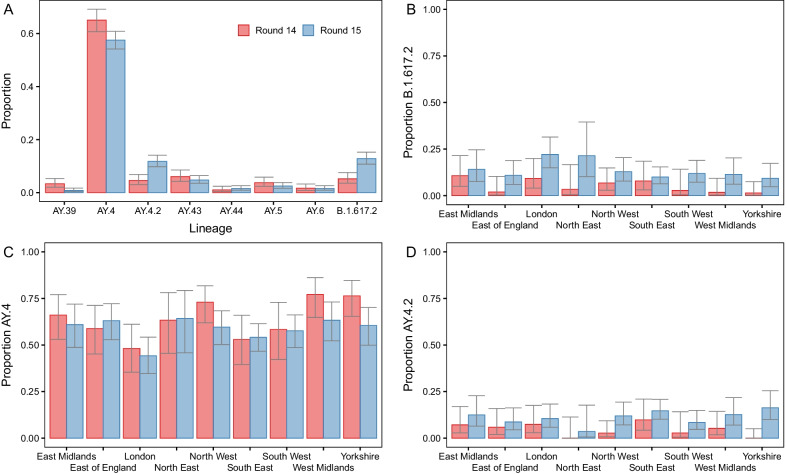
Methods: We present phylogenetic relationships and lineage dynamics within England (a country with high levels of immunity), as inferred from a random community sample of individuals who provided a self-administered throat and nose swab for rt-PCR testing as part of the REal-time Assessment of Community Transmission-1 (REACT-1) study. During round 14 (9 September-27 September 2021) and 15 (19 October-5 November 2021) lineages were determined for 1322 positive individuals, with 27.1% of those which reported their symptom status reporting no symptoms in the previous month.

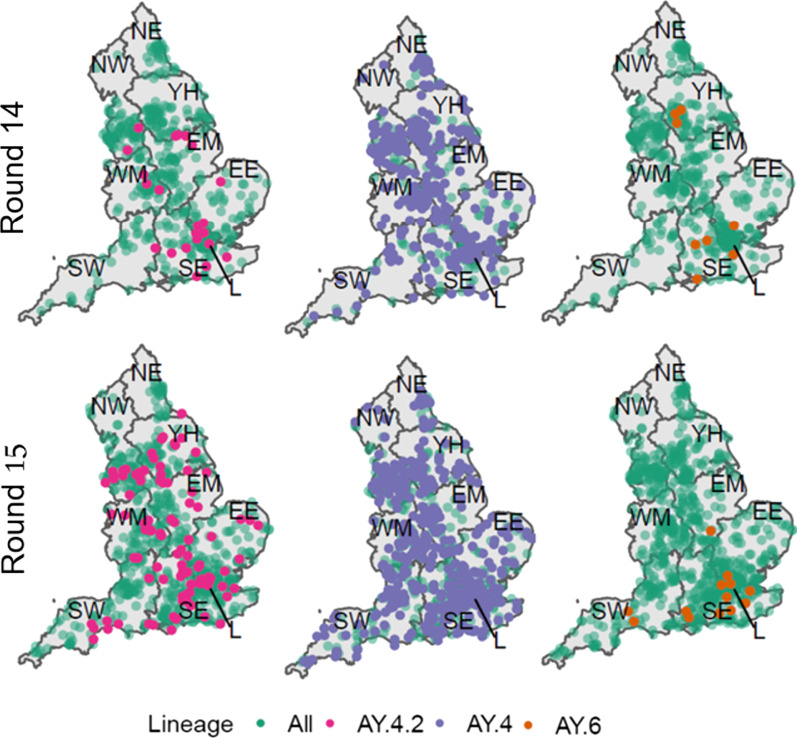
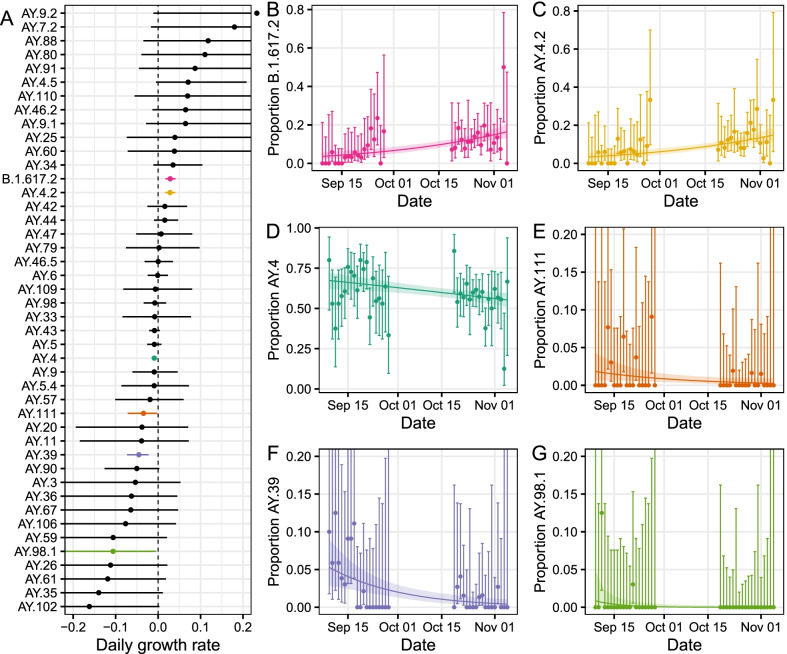
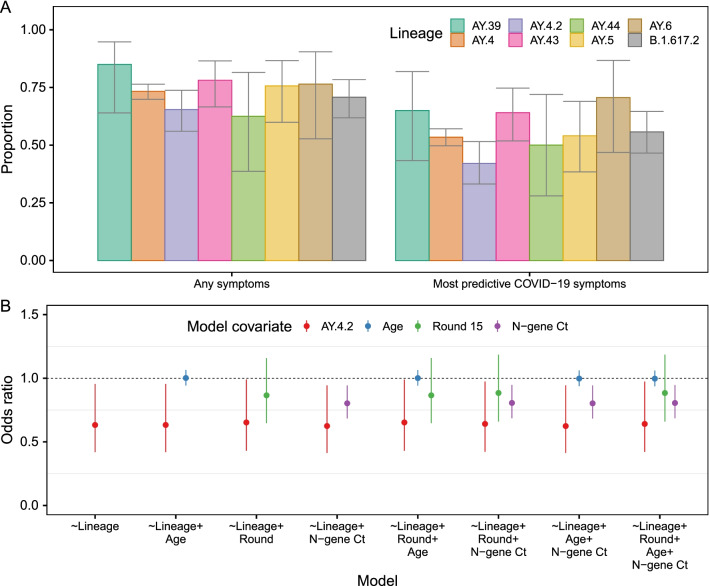
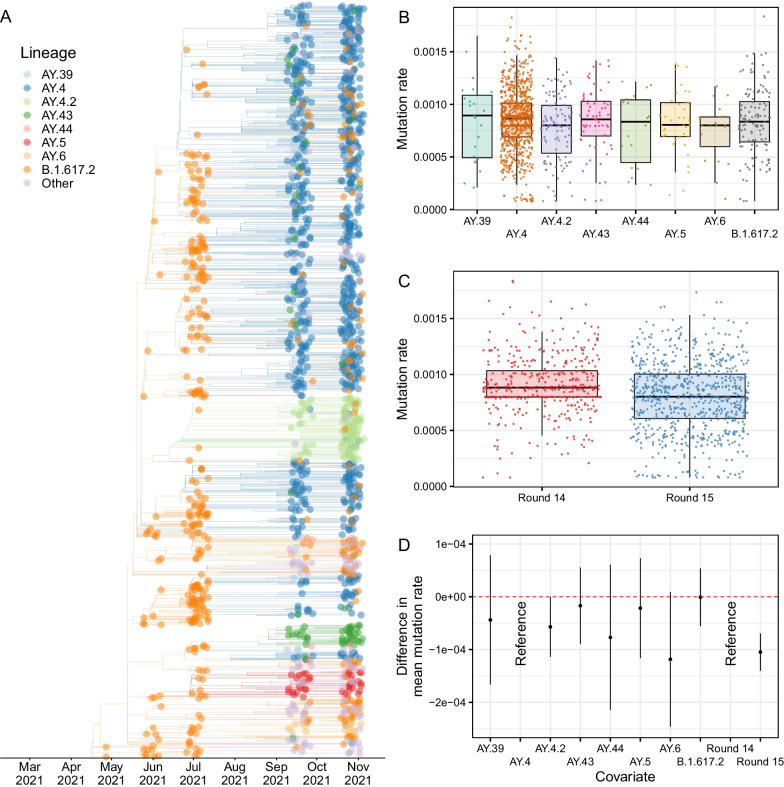
Results: We identified 44 unique lineages, all of which were Delta or Delta sub-lineages, and found a reduction in their mutation rate over the study period. The proportion of the Delta sub-lineage AY.4.2 was increasing, with a reproduction number 15% (95% CI 8-23%) greater than the most prevalent lineage, AY.4. Further, AY.4.2 was less associated with the most predictive COVID-19 symptoms (p = 0.029) and had a reduced mutation rate (p = 0.050). Both AY.4.2 and AY.4 were found to be geographically clustered in September but this was no longer the case by late October/early November, with only the lineage AY.6 exhibiting clustering towards the South of England.

Conclusions: As SARS-CoV-2 moves towards endemicity and new variants emerge, genomic data obtained from random community samples can augment routine surveillance data without the potential biases introduced due to higher sampling rates of symptomatic individuals.

Keywords: COVID-19; Delta variant; Genetic diversity; Mutation; SARS-CoV-2; Transmission advantage.


Conflict of interest statement

We declare no competing interests.

Figures

Fig. 1
Fig. 1
Proportion of positives by Delta sub-lineage. A The proportion of positives samples by round designated to the 8 lineages most prevalent over both rounds 14 and 15 (AY.39, AY.4, AY.4.2, AY.43, AY.44, AY.5, AY.6, B.1.617.2). BD Proportion of positive samples by round and region with lineage designated as B B.1.617.2, C AY.4 and D AY.4.2. For all figures, point estimates of proportion are shown (bars) with 95% confidence intervals (error-bars)
Fig. 2
Fig. 2
Geographic distribution of all positive samples with a lineage designation (Green) with overlaid distribution of AY.4.2 (Pink, left), AY.4 (Purple, centre) and AY.6 (Orange, right) for both round 14 (top) and round 15 (bottom). The lineages shown had either a significant level of clustering in round 14 (AY.4 and AY.4.2) or round 15 (AY.6)
Fig. 3
Fig. 3
A Estimated daily growth rate of the log odds of each lineage detected relative to all other lineages. Shown are both lineages with a growth rate in proportion not significantly different to zero (black) and those with a growth rate in proportion significantly different to zero (coloured). BG Raw estimates of the daily proportions (points) with 95% confidence intervals (error bars) for lineages with a growth rate in proportion significantly different to zero: B.1.617.2 (B, pink), AY.4.2 (C, yellow), AY.4 (D, dark green), AY.111 (E, orange), AY.39 (F, purple), AY.98.1 (G, light green). Also shown is the best-fit Bayesian logistic regression model with central estimate (solid line) and 95% credible interval (shaded region)
Fig. 4
Fig. 4
Estimated mean N-gene (A) and E-gene (B) Ct values for the 8 lineages most prevalent over rounds 14 and 15 (AY.39, AY.4, AY.4.2, AY.43, AY.44, AY.5, AY.6 and B.1.617.2) as calculated using Gaussian regression. Point estimates (points) and 95% confidence intervals (lines) are shown for estimates obtained using data from both rounds (blue), data from just round 14 (green) and data from just round 15 (purple)
Fig. 5
Fig. 5
A Proportion of positive individuals reporting any symptoms or reporting one of the four most predictive COVID-19 symptoms (loss or change of sense of taste, loss or change of sense of smell, new persistent cough, fever) in the last month by lineage of infection, for the 8 lineages most prevalent during rounds 14 and 15 (AY.39, AY.4, AY.4.2, AY.43, AY.44, AY.5, AY.6 and B.1.617.2). Point estimates of proportion are shown (bars) with 95% confidence intervals (error-bars). B Odds ratios of reporting the most predictive COVID-19 symptoms in the last months for multivariable logistic regression models including lineage (AY.4.2 with reference AY.4, red), age (relative to change of 10 years in age, blue), round of study (round 15 with reference round 14, green) and N-gene Ct value (relative to change in Ct value of 5, purple). The central estimates of odds ratios are shown (points) with 95% confidence intervals (error-bars)
Fig. 6
Fig. 6
A Time-resolved phylogenetic tree of all positive samples obtained for which the lineage designated was Delta or a Delta sub-lineage. B Distribution of mutation rates inferred at each phylogenetic tree tip for the 8 lineages most prevalent in round 14 and round 15 for samples obtained in round 14 and 15. C Distribution of mutation rates inferred at each phylogenetic tree tip for samples collected in round 14 and round 15. In B and C the estimates for mutation rate at each tip are given (points), the median (horizontal line) and interquartile range (boxes) of each distribution, and the range of the maximum and minimum values that are within 1.5 times the interquartile range of the box (vertical line). D Difference in the mean mutation rates between lineages and rounds as inferred from a Gaussian regression model. Central estimates of the differences are shown (points) with 95% confidence intervals (error-bars)

References

    1. Lineage B.1.617.2 Pangolin report. https://cov-lineages.org/global_report_B.1.617.2.html. Accessed 26 Nov 2021.
    1. World Health Organisation. COVID-19 Weekly Epidemiological Update - Edition 66. 2021. https://www.who.int/publications/m/item/weekly-epidemiological-update-on.... Accessed 23 Nov 2021.
    1. PHE Genomics Cell, PHE Outbreak Surveillance Team, PHE Epidemiology Cell, PHE Contact Tracing Data Team, PHE Health, Protection Data Science Team, PHE Joint Modelling Team, NHS Test and Trace Joint Biosecurity Centre, Public Health Scotland and EAVE group, Contributions from the Variant Technical Group Members. SARS-CoV-2 variants of concern and variants under investigation in England - Technical briefing 15, 11 June 2021. https://assets.publishing.service.gov.uk/government/uploads/system/uploa...
    1. Elliott P, Haw D, Wang H, Eales O, Walters CE, Ainslie KEC, et al. Exponential growth, high prevalence of SARS-CoV-2, and vaccine effectiveness associated with the Delta variant. Science. 2021;374:eabl9551. doi: 10.1126/science.abl9551. - DOI - PMC - PubMed
    1. Obermeyer F, Schaffner SF, Jankowiak M, Barkas N, Pyle JD, Park DJ, et al. Analysis of 2.1 million SARS-CoV-2 genomes identifies mutations associated with transmissibility. 10.1101/2021.09.07.21263228 - PMC - PubMed