. 2022 Jul 27;14(1):104.
doi: 10.1186/s13195-022-01044-1.

Deletion of Abi3/Gngt2 influences age-progressive amyloid β and tau pathologies in distinctive ways

Affiliations

Deletion of Abi3/Gngt2 influences age-progressive amyloid β and tau pathologies in distinctive ways

Kristen R Ibanez et al. Alzheimers Res Ther. .

Abstract

Background: The S209F variant of Abelson Interactor Protein 3 (ABI3) increases risk for Alzheimer's disease (AD), but little is known about its function in relation to AD pathogenesis.

Methods: Here, we use a mouse model that is deficient in Abi3 locus to study how the loss of function of Abi3 impacts two cardinal neuropathological hallmarks of AD-amyloid β plaques and tau pathology. Our study employs extensive neuropathological and transcriptomic characterization using transgenic mouse models and adeno-associated virus-mediated gene targeting strategies.

Results: Analysis of bulk RNAseq data confirmed age-progressive increase in Abi3 levels in rodent models of AD-type amyloidosis and upregulation in AD patients relative to healthy controls. Using RNAscope in situ hybridization, we localized the cellular distribution of Abi3 in mouse and human brains, finding that Abi3 is expressed in both microglial and non-microglial cells. Next, we evaluated Abi3-/- mice and document that both Abi3 and its overlapping gene, Gngt2, are disrupted in these mice. Using multiple transcriptomic datasets, we show that expression of Abi3 and Gngt2 are tightly correlated in rodent models of AD and human brains, suggesting a tight co-expression relationship. RNAseq of the Abi3-Gngt2-/- mice revealed upregulation of Trem2, Plcg2, and Tyrobp, concomitant with induction of an AD-associated neurodegenerative signature, even in the absence of AD-typical neuropathology. In APP mice, loss of Abi3-Gngt2 resulted in a gene dose- and age-dependent reduction in Aβ deposition. Additionally, in Abi3-Gngt2-/- mice, expression of a pro-aggregant form of human tau exacerbated tauopathy and astrocytosis. Further, using in vitro culture assays, we show that the AD-associated S209F mutation alters the extent of ABI3 phosphorylation.

Conclusions: These data provide an important experimental framework for understanding the role of Abi3-Gngt2 function and early inflammatory gliosis in AD. Our studies also demonstrate that inflammatory gliosis could have opposing effects on amyloid and tau pathology, highlighting the unpredictability of targeting immune pathways in AD.

Keywords: Alzheimer’s disease; Disease signature; Gene dose; Neurofibrillary tangle; Plaque burden; Risk factor.


Conflict of interest statement

The authors declare that they have no competing interests.

Figures

Fig. 1
Fig. 1
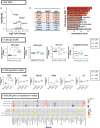
ABI3 RNA is expressed in microglia and neurons in mice and humans. a, b Abi3 RNA levels (FKPM) plotted across different ages in APP CRND8 mice (a) and MAPT rTg4510 mice (b). Source data obtained from Mayo RNAseq study (AD Knowledge Portal: https://adknowledgeportal.org). n = 9–14 (a) and n = 6 per genotype/age. b. One-way ANOVA, ****p < 0.0001; **p < 0.01; *p < 0.05. cf In situ hybridization was done to detect ABI3 (Fast Red; red color) RNA on human and mouse paraffin-embedded brain sections immunostained with anti Iba-1 antibody (brown color). Arrowheads indicate Iba-1 (microglia) associated in situ signal and arrows indicate in situ signal in non-Iba-1 cells. n = 3 (human AD cases, 6-month-old TG-Abi3-Gngt2/ mice and 6-month-old TG-Abi3-Gngt2+/+ mice) and n = 1 (18-month-old TgCRND8 mice). Representative of two independent experimental replicates. Two separate images are shown from each cohort, indicated as c1-c2, d1-d2, e1-e2, f1-f2. Additional representative images are available in Additional File 4 Fig. S1. NonTG, nontransgenic; TG, transgenic
Fig. 2
Fig. 2
ABI3 and GNGT2 genes are in a co-regulatory expression network. ac Graphs showing co-regulation of ABI3 and GNGT2 RNA from AD patients. Data from Mayo AD cohorts (temporal cortex, TCX and cerebellum, CER) and ROSMAP AD cohorts obtained from AD Knowledge Portal (https://adknowledgeportal.org). d, e Graphs showing co-regulation of Abi3 and Gngt2 RNA from APP TgCRND8 and MAPT rTg4510 mice obtained from AD Knowledge Portal (https://adknowledgeportal.org). f Table depicting the correlation coefficient (ρ) and p-values adjusted for multiple testing for cohorts depicted in ae. Tg, transgenic for APP (d) or MAPT/tTA (e); nonTg, nontransgenic background strain matched mice (d, e). Each datapoint indicates individual sample (ae). x and y axes denote FPKM values of ABI3 and GNGT2 respectively
Fig. 3
Fig. 3
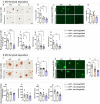
Immune activation in Abi3-Gngt2/ mice. Representative images of Iba-1 reactive microglia (af) and GFAP-reactive astrocyte (gl) in 3-month-old or 6-month-old mice with WT (+ / +), heterozygous (+ /−), or KO (−/−) of Abi3-Gngt2 genes. Quantitation of the Iba-1 or GFAP staining from cortex or hippocampus is provided in corresponding panels on the right side. N = 6 mice (af), 7 mice (gl). Scale bar, 50 µm. Clear symbols denote female mice and filled symbols denote male mice. Data represents mean ± sem. One-way ANOVA; ***p < 0.001; **p < 0.01; *p < 0.05. KO, knockout; Het, heterozygous; WT, wild type
Fig. 4
Fig. 4
Unbiased transcriptomic analysis of Abi3-Gngt2/ mice reveal upregulation of immune pathways and disease-related gene expression patterns. ac Volcano plot (a), list of top 5 upregulated and top 5 downregulated genes (based on fold change; orange, upregulated genes, blue, downregulated genes) (b) and GO pathways based on enriched genes (c) in 3-month-old Abi3-Gngt2−/− mice relative to Abi3-Gngt2+/+ mice. Orange dots, upregulated genes; blue dots, downregulated genes (a). FC, fold change; DEG, differentially expressed genes; padj, p-values adjusted for multiple comparison. d Cell type population analyses indicating changes in microglia, astrocytes, neurons, and oligodendrocyte populations in 3-month-old mice with WT (+ / +), heterozygous (+ /−), or KO (−/−) of Abi3-Gngt2 locus. One-way ANOVA, ***p < 0.001, **p < 0.01, *p < 0.05. e Gene expression signatures for microglia or astrocyte functional subtypes in 3-month-old mice with WT (+ / +), heterozygous (+ /−), or KO (−/−) of Abi3-Gngt2 locus. These cell-type-specific signatures were identified in previous studies [–28]. One-way ANOVA, **p < 0.01. f WGCNA gene co-expression modules correlating with specific experimental traits (Iba-1 burden, GFAP burden, and Abi3-Gngt2−/− genotype) shown. Correlation of modules to different experimental traits is colored in a heatmap (red, positive correlation; blue, negative correlation). Modules with p-values < 0.05 and correlation value < -0.5 or > 0.5 are indicated in colored tiles (see scale on right). Cell-type-specific gene lists were used to identify genes with significant overlap (odds ratio, see scale on right) within the modules. The heatmap is colored by the value of the odds ratio; higher the odds ratio of association, warmer the color. Grey squares indicate non-significant (p > 0.05, odds ratio < 2) overlaps in the gene lists. All p-values adjusted for multiple comparisons (padj). n = 4 mice (2 males, 2 females) per Abi3-Gngt2 genotype except 1 outlier removed in d, e
Fig. 5
Fig. 5
Loss of Abi3-Gngt2 expression ameliorates Aβ in a gene-dosage manner. a, b Representative immunohistochemical images of total Aβ plaque burden and quantification in 3-month-old APP TG mice with WT (+ / +), heterozygous (+ /−), or KO (−/−) of Abi3-Gngt2 locus. c, d Representative images of thioflavin S-stained cored Aβ plaques and quantitation in 3-month-old APP TG mice with WT (+ / +), heterozygous (+ /−), or KO (−/−) of Abi3-Gngt2 locus. eh Biochemical levels of formic acid (FA) solubilized and detergent (SDS) soluble Aβ42 and Aβ40 in 3-month-old APP TG mice with WT (+ / +), heterozygous (+ /−), or KO (−/−) of Abi3-Gngt2 locus. i, j Representative immunohistochemical images of total Aβ plaque burden and quantification in 6-month-old APP transgenic mice with WT (+ / +), heterozygous (+ /−), or KO (−/−) of Abi3-Gngt2 locus. k, l Representative images of thioflavin S-stained cored plaques and quantitation in 6-month-old APP TG mice with WT (+ / +), heterozygous (+ /−), or KO (−/−) of Abi3-Gngt2 locus. mp Biochemical levels of FA solubilized and SDS soluble Aβ42 and Aβ40 in 6-month-old APP TG mice with WT (+ / +), heterozygous (+ /−), or KO (−/.−) of Abi3-Gngt2 locus. N = 6 mice (ah), 7 mice (i, j, m-p), 6 mice (k, l). Scale bar, 50 µm (a, i); 100 µm (ck). Clear symbols denote female mice and filled symbols denote male mice (except panel d, k). n = 3 females, 3 males (3 months) and n = 3 females, 4 males (6 months). Data represents mean ± sem. One-way ANOVA; ***p < 0.001; **p < 0.01; *p < 0.05
Fig. 6
Fig. 6
Abi3-Gngt2 regulates gliosis in APP mice. Representative images of Iba-1 reactive microglia (af) and GFAP-reactive astrocyte (g-l) in 3-month-old or 6-month-old APP transgenic mice with WT (+ / +), heterozygous (+ /−), or KO (−/.−) of Abi3-Gngt2 locus. Quantitation of the Iba-1 or GFAP staining from cortex or hippocampus is provided in corresponding panels on the right side. Scale bar, 50 µm. Clear symbols denote female mice and filled symbols denote male mice. n = 3 females, 3 males (3 months) and n = 3 females, 4 males (6 months). Data represents mean ± sem. One-way ANOVA; ***p < 0.001; **p < 0.01; *p < 0.05
Fig. 7
Fig. 7
Unbiased transcriptomic analysis of TG-Abi3-Gngt2/ mice reveal distinctive disease-associated gene expression signatures and co-expression modules. ac Volcano plot (a), list of top 5 upregulated and top 5 downregulated genes (based on fold change; orange, upregulated genes, blue, downregulated genes) (b) and GO pathways based on enriched genes for upregulated genes (c) in 3-month-old APP TG mice with WT (+ / +), or KO (−/−) of Abi3-Gngt2 locus. Orange dots, upregulated genes; blue dots, downregulated genes. FC, fold change; DEG, differentially expressed genes; padj, p-values adjusted for multiple comparison. d Cell type population analyses indicating changes in microglia, astrocytes, neurons, and oligodendrocyte populations in 3-month-old APP TG mice with WT (+ / +), heterozygous (+ /−), or KO (−/−) of Abi3-Gngt2 locus. One-way ANOVA; **p < 0.01, *p < 0.05. e Gene expression signatures for specific microglia or astrocyte subtypes in 3-month-old APP TG mice with WT (+ / +), heterozygous (+ /−), or KO (−/.−) of Abi3-Gngt2 locus. One-way ANOVA; *p < 0.05. f WGCNA gene co-expression modules correlating with experimental traits (biochemical Aβ values, plaque burden, Iba-1 burden, GFAP burden, Abi3-Gngt2 genotype). Correlation of modules to different experimental traits is colored in a heatmap (red, positive correlation; blue, negative correlation). Modules with p-values < 0.05 and correlation value < -0.5 0r >0.5 are indicated in colored tile (see scale on right). Cell-type-specific gene lists were used to identify genes with significant overlap (odds ratio) within the modules. The heatmap is colored by the value of the odds ratio; higher the odds ratio of association, warmer the color. Grey squares indicate non-significant (p  > 0.05, odds ratio < 2) overlaps in the gene lists. N = 4 mice (2 males, 2 females) per Abi3-Gngt2 genotype except 1 outlier removed in d, e. All p-values adjusted for multiple comparisons (padj)
Fig. 8
Fig. 8
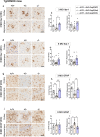
Abi3-Gngt2 deficiency accelerates tauopathy in a mutant human tau model. Abi3-Gngt2+/+ (WT) and Abi3-Gngt2−/− (KO) mice were injected with control vector (Control) or AAV expressing a double mutant (P301L/S320F) human 0N/4R tau in the cerebral ventricles on neonatal day P0 and analyzed at 3 months (af) or 6 months (gl) of age. Representative brain images indicating total human tau (detected with CP27 antibody, a, g), ptau (detected with CP13 antibody, c, i), and misfolded pretangle tau (detected with MC1 antibody, e, k) from cortex and hippocampus are shown. Quantitative analysis from both cortex and hippocampus of antibody-stained slides (b, d, f, h, j, l) shown on right side of corresponding stained brain images (a, c, e, g, i, k). Scale bar, 75 µm. n = 6 mice/group. Data represents mean ± sem. One-way ANOVA; ****p < 0.0001; ***p < 0.001; **p < 0.01; *p < 0.05
Fig. 9
Fig. 9
Increased astrocytosis in tau expressing Abi3-Gngt2/ mice. Abi3-Gngt2+/+ (WT) and Abi3-Gngt2−/− (KO) mice were injected with control vector (Control) or AAV expressing a double mutant (P301L/S320F) human 0N/4R tau in the cerebral ventricles on neonatal day P0 and analyzed at 3 months or 6 months of age. Representative images of Iba-1 reactive microglia (ad) and GFAP-reactive astrocyte (eh) in 3-month-old or 6-month-old mice are shown. Quantitation of the Iba-1 or GFAP staining from forebrain (cortex and hippocampus) is provided in corresponding panels on the right side. N = 6 mice/group. Scale bar, 75 µm. Data represents mean ± sem. One-way ANOVA; ****p < 0.0001; ***p < 0.001; **p < 0.01; *p < 0.05
Fig. 10
Fig. 10
S209F mutation leads to altered phosphorylation in ABI3 protein. a HEK293T cells were transiently transfected with WT ABI3 or S209F ABI3 and separated on an immunoblot showing two distinct bands around 50 kDa. Higher bands that are as yet uncharacterized (marked by asterisk) are also denoted. The proteins were detected with two antibodies simultaneously using LiCor infrared dyes: anti-FLAG antibody (green) and anti S209-ABI3 antibody (red). b Lambda protein phosphatase assay performed at 30 °C on WT ABI3 and S209F ABI3 expressing HEK293T cell lysates detected with anti-FLAG antibody. c, d HEK293T cells were transiently transfected with WT ABI3 or ABI3 mutated at position 209 and separated on an immunoblot. The proteins were detected with two antibodies simultaneously using LiCor infrared dyes: anti-FLAG antibody (green) and anti S209-ABI3 antibody (red) (c) or anti-FLAG antibody (green) and anti N terminal ABI3 (Sigma) (red) (d). “Mock” denotes sham transfection procedure with no DNA. Data representative of at least two independent experimental replicates
Fig. 11
Fig. 11
Hypothetical scenarios linking Abi3-Gngt2 function to AD. a Tabulated view of neuropathological findings in Abi3-Gngt2−/− mice relative to Abi3-Gngt2+/+ mice. n.d., not done. b Schematic summary of possible Abi3/Gngt2 function in the context of AD. Our experiments with Abi3-Gngt2 deficient model show that immune phenotype in these mice reduce Aβ plaques in a gene dose- and age-dependent manner in TgCRND8 mice but increase tau phosphorylation in AAV-tau model (i). Loss of Abi3-Gngt2 function leads to early-life induction of AD/amyloid-associated factors and microglial genetic risk factors, independent of Aβ. In fact, these same microglial factors (as tabulated in i) are altered as humans progress from healthy status to AD (ii). Based on our data, we hypothesize that a normally functioning Abi3 would lead to suppression of immunity (by suppressing induction of AD disease microglial risk factor genes), thus increasing Aβ plaques but preventing tau phosphorylation and tangle formation (iii). Whether this would modulate synaptic resilience and dementia progression resulting in protective effects requires further investigation. The neuropathology in the Abi3-Gngt2 deficient model is reminiscent of the dichotomy observed in multiple AD mouse models. The differential response of Aβ and tau to immune activation necessitates a cautious foray into immune-targeted therapies. Future work in rodent models of Aβ deposition and tau pathology in the presence of the S209F mutated Abi3 would provide critical functional information. Our in vitro data shows that the AD associated S209F mutation dramatically reduces self-phosphorylation, which guided by previous data from ABI family of proteins, would imply a loss of function phenotype (iv). Brain picture (ii) adapted from online source under CC license

Similar articles

Cited by

References

    1. Jack CR Jr, et al. NIA-AA research framework: toward a biological definition of Alzheimer’s disease. Alzheimers Dement. 2018;14(4):535–62. - PMC - PubMed
    1. Golde TE. Harnessing immunoproteostasis to treat neurodegenerative disorders. Neuron. 2019;101(6):1003–1015. doi: 10.1016/j.neuron.2019.02.027. - DOI - PMC - PubMed
    1. Kinney JW, et al. Inflammation as a central mechanism in Alzheimer’s disease. Alzheimers Dement (N Y). 2018;4:575–90. - PMC - PubMed
    1. Hansen DV, Hanson JE, Sheng M. Microglia in Alzheimer’s disease. J Cell Biol. 2018;217(2):459–72. - PMC - PubMed
    1. Efthymiou AG, Goate AM. Late onset Alzheimer’s disease genetics implicates microglial pathways in disease risk. Mol Neurodegener. 2017;12(1):43. - PMC - PubMed

Publication types