Clinical Trial
. 2022 Jul 27;26(1):228.
doi: 10.1186/s13054-022-04079-w.

Clustering identifies endotypes of traumatic brain injury in an intensive care cohort: a CENTER-TBI study

Collaborators, Affiliations
Clinical Trial

Clustering identifies endotypes of traumatic brain injury in an intensive care cohort: a CENTER-TBI study

Cecilia A I Åkerlund et al. Crit Care. .

Abstract

Background: While the Glasgow coma scale (GCS) is one of the strongest outcome predictors, the current classification of traumatic brain injury (TBI) as 'mild', 'moderate' or 'severe' based on this fails to capture enormous heterogeneity in pathophysiology and treatment response. We hypothesized that data-driven characterization of TBI could identify distinct endotypes and give mechanistic insights.

Methods: We developed an unsupervised statistical clustering model based on a mixture of probabilistic graphs for presentation (< 24 h) demographic, clinical, physiological, laboratory and imaging data to identify subgroups of TBI patients admitted to the intensive care unit in the CENTER-TBI dataset (N = 1,728). A cluster similarity index was used for robust determination of optimal cluster number. Mutual information was used to quantify feature importance and for cluster interpretation.

Results: Six stable endotypes were identified with distinct GCS and composite systemic metabolic stress profiles, distinguished by GCS, blood lactate, oxygen saturation, serum creatinine, glucose, base excess, pH, arterial partial pressure of carbon dioxide, and body temperature. Notably, a cluster with 'moderate' TBI (by traditional classification) and deranged metabolic profile, had a worse outcome than a cluster with 'severe' GCS and a normal metabolic profile. Addition of cluster labels significantly improved the prognostic precision of the IMPACT (International Mission for Prognosis and Analysis of Clinical trials in TBI) extended model, for prediction of both unfavourable outcome and mortality (both p < 0.001).

Conclusions: Six stable and clinically distinct TBI endotypes were identified by probabilistic unsupervised clustering. In addition to presenting neurology, a profile of biochemical derangement was found to be an important distinguishing feature that was both biologically plausible and associated with outcome. Our work motivates refining current TBI classifications with factors describing metabolic stress. Such data-driven clusters suggest TBI endotypes that merit investigation to identify bespoke treatment strategies to improve care. Trial registration The core study was registered with ClinicalTrials.gov, number NCT02210221 , registered on August 06, 2014, with Resource Identification Portal (RRID: SCR_015582).

Keywords: Critical care; Endotypes; Intensive care unit; Machine learning; Traumatic brain injury; Unsupervised clustering.


Conflict of interest statement

DM reports grants, personal fees and non-financial support from GlaxoSmithKline, grants and personal fees from NeuroTrauma Sciences, personal fees from Pfizer Ltd, personal fees from PressuraNeuro, grants and personal fees from Lantmannen AB, grants and personal fees from Integra, outside the submitted work. All other authors declare no competing interests.

Figures

Fig. 1
Fig. 1
Linear correlation between all pairs of features. To visualize the strength of linear correlation between each pair of features, the value of the Pearson correlation coefficient is represented by the size and colour of the dots in the matrix. Strongly correlated features (pH and base excess, pH and arterial partial pressure of carbon dioxide (PaCO2), GCS motor and total score, Rotterdam CT score and midline shift, Rotterdam CT score and Fisher classification, GCS motor score and pupil response, age and ASA PS-class (American Society of Anesthesiologists physical status classification), and age and anticoagulants at baseline) were modelled as bivariate joint Gaussian distributions. GCS, Glasgow coma scale; ISS, injury severity score; SpO2, oxygen saturation; PaO2, arterial partial pressure of oxygen; PaCO2, arterial partial pressure of carbon dioxide; BMI, body mass index; TAI, traumatic axonal injury; EDH, epidural hematoma; aSDH, acute subdural hematoma; tSAH, traumatic subarachnoid haemorrhage; MAP, mean arterial pressure; ICP, intracranial pressure; TIL, therapy intensity level
Fig. 2
Fig. 2
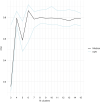
Ten models of each number of clusters between three to fifteen were created. The model with the highest log likelihood was chosen as the best model. This was repeated twenty times. Median, minimum, and maximum cluster similarity index (CSI, defined as the fraction of patients assigned to the same cluster in two models), of the twenty models were calculated. The median CSI is presented in Fig. 3
Fig. 3
Fig. 3
Median, minimum, and maximum cluster similarity index (CSI) of 20 models for each number of clusters. A penalty for the number of clusters was added by subtracting 1/n clusters from the CSI values. Median CSI = 1 indicates perfect match, 0 indicates no matches between different models
Fig. 4
Fig. 4
Visualization of model stability. The cluster each patient belongs to in twenty randomly created different models is visualized for each of the twenty models. The models are aligned with respect to highest log likelihood, from left to right
Fig. 5
Fig. 5
Features with highest mutual information (MI) for all clusters. The axes range from minimum to maximum of cluster averages for each feature. GCS, Glasgow coma scale; PaCO2, arterial partial pressure of carbon dioxide; SpO2, oxygen saturation
Fig. 6
Fig. 6
Description of the 6 clusters. The six identified clusters can, in general, be seen as distinguished by GCS and degree of metabolic derangement. The percentage of patients in each cluster with unfavourable outcome and cluster mortality is indicated as well. RTIs, road traffic incidents; DC, decompressive craniectomy; TAI, traumatic axonal injury

References

    1. Rubiano AM, Carney N, Chesnut R, Puyana JC. Global neurotrauma research challenges and opportunities. Nature. 2015;527(7578):S193–S197. doi: 10.1038/nature16035. - DOI - PubMed
    1. Roozenbeek B, Maas AIR, Menon DK. Changing patterns in the epidemiology of traumatic brain injury. Nat Rev Neurol. 2013;9(4):231–236. doi: 10.1038/nrneurol.2013.22. - DOI - PubMed
    1. Bragge P, Synnot A, Maas AI, Menon DK, Cooper DJ, Rosenfeld JV, et al. A state-of-the-science overview of randomized controlled trials evaluating acute management of moderate-to-severe traumatic brain injury. J Neurotrauma. 2016;33(16):1461–1478. doi: 10.1089/neu.2015.4233. - DOI - PMC - PubMed
    1. Steyerberg EW, Wiegers E, Sewalt C, Buki A, Citerio G, De Keyser V, et al. Case-mix, care pathways, and outcomes in patients with traumatic brain injury in CENTER-TBI: a European prospective, multicentre, longitudinal, cohort study. Lancet Neurol. 2019;18(10):923–934. doi: 10.1016/S1474-4422(19)30232-7. - DOI - PubMed
    1. Chesnut RM, Temkin N, Carney N, Dikmen S, Rondina C, Videtta W, et al. A trial of intracranial-pressure monitoring in traumatic brain injury. N Engl J Med. 2012;36726367(27):2471–2481. doi: 10.1056/NEJMoa1207363. - DOI - PMC - PubMed

Publication types

Associated data