Spatiotemporal Regularity and Socioeconomic Drivers of the AQI in the Yangtze River Delta of China
- PMID: 35897387
- PMCID: PMC9331707
- DOI: 10.3390/ijerph19159017
Spatiotemporal Regularity and Socioeconomic Drivers of the AQI in the Yangtze River Delta of China
Abstract
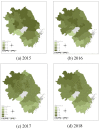
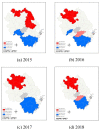
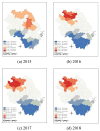
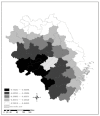
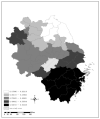
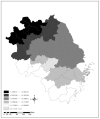
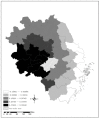
Air pollution has caused adverse effects on the climate, the ecological environment and human health, and it has become a major challenge facing the world today. The Yangtze River Delta (YRD) is the region with the most developed economy and the most concentrated population in China. Identifying and quantifying the spatiotemporal characteristics and impact mechanism of air quality in this region would help in formulating effective mitigation policies. Using annual data on the air quality index (AQI) of 39 cities in the YRD from 2015 to 2018, the spatiotemporal regularity of the AQI is meticulously uncovered. Furthermore, a geographically weighted regression (GWR) model is used to qualify the geographical heterogeneity of the effect of different socioeconomic variables on the AQI level. The empirical results show that (1) the urban agglomeration in the YRD presents an air pollution pattern of being low in the northwest and high in the southeast. The spatial correlation of the distribution of the AQI level is verified. The spatiotemporal regularity of the "high clustering club" and the "low clustering club" is obvious. (2) Different socioeconomic factors show obvious geographically heterogeneous effects on the AQI level. Among them, the impact intensity of transportation infrastructure is the largest, and the impact intensity of the openness level is the smallest. (3) The upgrading of the industrial structure improves the air quality status in the northwest more than it does in the southeast. The impact of transportation infrastructure on the air pollution of cities in Zhejiang Province is significantly higher than the impact on the air pollution of other cities. The air quality improvement brought by technological innovation decreases from north to south. With the expansion of urban size, there is a law according to which air quality first deteriorates and then improves. Finally, the government should promote the upgrading of key industries, reasonably control the scale of new construction land, and increase the cultivation of local green innovative enterprises.
Keywords: AQI; Yangtze River Delta; geographically weighted regression; heterogeneity; spatiotemporal regularity.
Conflict of interest statement
The authors declare no conflict of interest. They also declare no financial or personal relationships with other people or organizations that could inappropriately bias the results presented in this manuscript.
Figures



References
-
- Mu Q., Zhang S. An evaluation of the economic loss due to the heavy haze during January 2013 in China. China Environ. Sci. 2013;33:2087–2094. (In Chinese)
-
- World Health Organization . World Health Statistics 2021: Monitoring Health for the SDGs, Sustainable Development Goals. World Health Organization; Geneva, Switzerland: 2021.
Publication types
MeSH terms
Substances
LinkOut - more resources
Full Text Sources
Medical

