. 2022 Jul 26;23(15):8238.
doi: 10.3390/ijms23158238.

Hematopoietic-Mesenchymal Signals Regulate the Properties of Mesenchymal Stem Cells

Affiliations

Hematopoietic-Mesenchymal Signals Regulate the Properties of Mesenchymal Stem Cells

Sanshiro Kanazawa et al. Int J Mol Sci. .

Abstract

It is well known that the properties of hematopoietic stem/progenitor cells (HSCs), such as their self-renewal ability and multipotency, are maintained through interactions with mesenchymal stem/stromal cells (MSCs). MSCs are rare cells that are present in the bone marrow and are useful for clinical applications due to their functional ability. To obtain the necessary number of cells, MSCs must be cultured to expand, but this causes a remarkable decrease in stem cell properties, such as multipotency and proliferation ability. In this study, we show that the c-Mpl signal, which is related to the maintenance of hematopoietic stem cells, has an important effect on the proliferation and differentiation ability of MSCs. Utilizing a co-culture system comprising MSCs and HSCs, it is suggested that signaling from hematopoietic cells to MSCs supports cell proliferation. Interestingly, the enhanced proliferation ability of the HSCs was decreased in c-Mpl knock-out HSCs (c-Mpl-KO). In addition, the MSCs co-cultured with c-Mpl-KO HSCs had reduced MSC marker expression (PDGFRa and Sca-1) compared to the MSCs co-cultured with c-Mpl-wild-type HSCs. These results suggest that a hematopoietic-mesenchymal signal exists, and that the state of the HSCs is important for the stability of MSC properties.

Keywords: hematopoietic stem cells; hematopoietic–mesenchymal cell interaction; hematopoietic–mesenchymal signaling; mesenchymal stem cells.


Conflict of interest statement

Atsuhiko Hikita is affiliated with and is the endowed chair of FUJISOFT INCORPORATED (until 20 October 2020) and the CPC Corporation, KYOWA Co., Ltd., Kanto Chemical Co Inc., and the Nichirei Corporation (from 1 July 2021). All other authors have no conflict of interest.

Figures

Figure 1
Figure 1
Mesenchymal–hematopoietic cell interaction promotes BM cell proliferation. (A) Cell proliferation rate of BM cells (left) and KG-1 cells (right). Direct co-culture of BM cells and KG-1 cells (cells were added directly). The number of cultured cells was determined (n = 5). * p < 0.05. (B) Cell proliferation curve by indirect culture of BM cells (left) and KG-1 cells (right). Indirect co-culture of BM cells and KG-1 cells using culture inserts. (C) Microscopic views of BM cells cultured alone (left) or co-cultured with KG-1 cells directly (right). Scale bar = 100 µm. (D) Flow cytometry analysis of cell surface markers in BM cells cultured alone or co-cultured directly with KG-1 cells. The graph shows the averages of the percentages of Sca-1 and PDGFR-α double-positive cells (n = 5). * p < 0.05. (E) RT-PCR analysis of chondrogenic differentiation marker (Sox9 and Col2) gene expression in BM cells following a 2-week treatment with chondrogenic differentiation media (indicated as D.M) or control media after co-culture with KG-1 cells (indicated as KG-1) or monoculture.
Figure 2
Figure 2
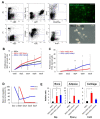
Clonal assay of MSCs after co-culture with HSCs. (A) Representative flow cytometric profiles of MSCs (upper, CD31, CD45, Ter119, Sca-1+, and PDGFR-α+ cells) and HSCs (bottom, c-Kit+, Lin, and Sca-1+ cells). Microscopic views of MSCs (upper) and HSCs (bottom). (B,C) Cell proliferation of MSCs (B) and HSCs (C) 2, 4, 6, and 8 days after co-culture (n = 6). * p < 0.05 and ** p < 0.01 between direct and indirect co-culture. (D) MSC and HSC population in whole mesenchymal and hematopoietic cells. MSCs were sorted on day −1, and we waited until they attached to the bottom of the dish on day 0. After co-culture of MSCs and HSCs for 3, 5, and 7 days, cells were collected, sorted based on EGFP expression, and both cell types were detected using stem cell markers by flow cytometry. (E) Real-time PCR analysis of mesenchymal lineage marker expression in MSCs following a 3-week treatment with mesenchymal differentiation media after co-culture with HSCs (n = 5). * p < 0.05 vs. MSCs (-HSCs).
Figure 3
Figure 3
Gene expression analysis comparing MSCs cultured alone with those co-cultured with HSCs. (A) Principal component analysis (PCA) analysis of 12 samples. Orange circles: control MSC, blue triangles: MSC co-cultured with HSC. (B) Heatmap of differentially expressed genes between the MSC and HSC co-culture group (treated) and MSC−only group (control). (C) List of pathways/genes that were highly expressed in the MSC and HSC co-culture group. (DI) Gene Set Enrichment Analysis (GSEA) of microarray.
Figure 4
Figure 4
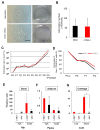
c-Mpl-deficient MSCs have normal proliferation and differentiation potential. (A) Phase-contrast images of cultures of c-Mpl-WT and c-Mpl-KO MSCs (left panels) and cells after 14 days of culture in CFU-F assay (right panels, 100 mm dishes). (B) Total numbers of CFU-Fs counted on day 14 (n = 15). Scale bar = 1 mm. (C) Growth curves for wild-type and c-Mpl−/− mouse-derived MSCs (n = 3 per group). (D) Percentages of PDGFR-α- and Sca-1-positive cells in the cultured cells. (EG) Real-time PCR analysis of tri-lineage marker expression (mAlp, (E); mPparg, (F); mCol2, (G)) in MSCs following 1- and 3-week treatments with mesenchymal differentiation media. * p < 0.05 c-Mpl−/− MSCs vs. wild-type MSCs (n = 5).
Figure 5
Figure 5
c-Mpl deficiency correlated with the differentiation ability of MSCs. (A,B) Hematoxylin and eosin staining shows ectopic bone formation at 2 weeks (A) and 4 weeks (B) after transplantation (left panel: low magnification; right panel: high magnification) (n = 3). Representative data are presented. (C) µCT findings of ectopic bone at 2 and 4 weeks after transplantation. At two weeks after transplantation, a high-intensity signal was detected in the group with c-Mpl-deficient MSCs (n = 3). Representative data are presented.
Figure 6
Figure 6
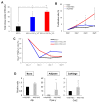
The c-Mpl in HSCs regulates the properties of MSCs. (A) Total numbers of CFU-Fs counted on day 14 after co-culture with HSCs (c-Mpl-WT and c-Mpl-KO). (B) Proliferation rate of MSCs after co-culture with HSCs (c-Mpl-WT and c-Mpl-KO) for 2, 4, and 6 days. * p < 0.05 (n = 5). (C) Percentages of PDGFR-α- and Sca-1-positive cells in the MSCs co-cultured with HSCs (c-Mpl-WT and c-Mpl-KO). (D) Real-time PCR analysis for tri-lineage marker expression in MSCs following a 2-week treatment with mesenchymal differentiation media after co-culture with c-Mpl-WT or c-Mpl-KO HSCs. * p < 0.05, ** p < 0.01 (n = 5).

References

    1. Uejima S., Okada K., Kagami H., Taguchi A., Ueda M. Bone marrow stromal cell therapy improves femoral bone mineral density and mechanical strength in ovariectomized rats. Cytotherapy. 2008;10:479–489. - PubMed
    1. Petrenko Y., Vackova I., Kekulova K., Chudickova M., Koci Z., Turnovcova K., Kupcova Skalnikova H., Vodicka P., Kubinova S. A Comparative Analysis of Multipotent Mesenchymal Stromal Cells derived from Different Sources, with a Focus on Neuroregenerative Potential. Sci. Rep. 2020;10:4290. - PMC - PubMed
    1. Mabuchi Y., Morikawa S., Harada S., Akazawa C., Okano H., Matsuzaki Y. LNGFR(+)THY-1(+)VCAM-1(hi+) cells reveal functionally distinct subpopulations in mesenchymal stem cells. Stem Cell Rep. 2013;1:152–165. - PMC - PubMed
    1. Suto E.G., Mabuchi Y., Suzuki N., Suzuki K., Ogata Y., Taguchi M., Muneta T., Sekiya I., Akazawa C. Prospectively isolated mesenchymal stem/stromal cells are enriched in the CD73+ population and exhibit efficacy after transplantation. Sci. Rep. 2017;7:4838. - PMC - PubMed
    1. Consentius C., Mirenska A., Jurisch A., Reinke S., Scharm M., Zenclussen A.C., Hennig C., Volk H.D. In situ detection of CD73+ CD90+ CD105+ lineage: Mesenchymal stromal cells in human placenta and bone marrow specimens by chipcytometry. Cytom. A. 2018;93:889–893. - PubMed