

Honeysuckle Berry (Lonicera caerulea L.) Inhibits Lipase Activity and Modulates the Gut Microbiota in High-Fat Diet-Fed Mice
- PMID: 35897908
- PMCID: PMC9330072
- DOI: 10.3390/molecules27154731
Honeysuckle Berry (Lonicera caerulea L.) Inhibits Lipase Activity and Modulates the Gut Microbiota in High-Fat Diet-Fed Mice
Abstract
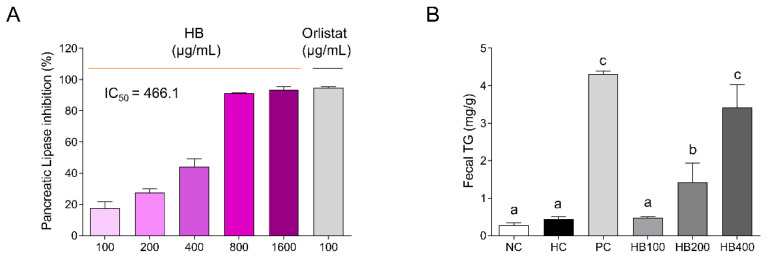
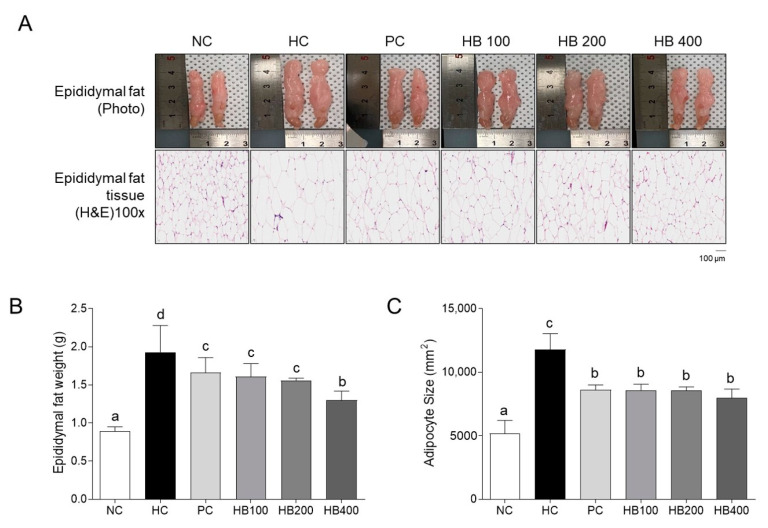
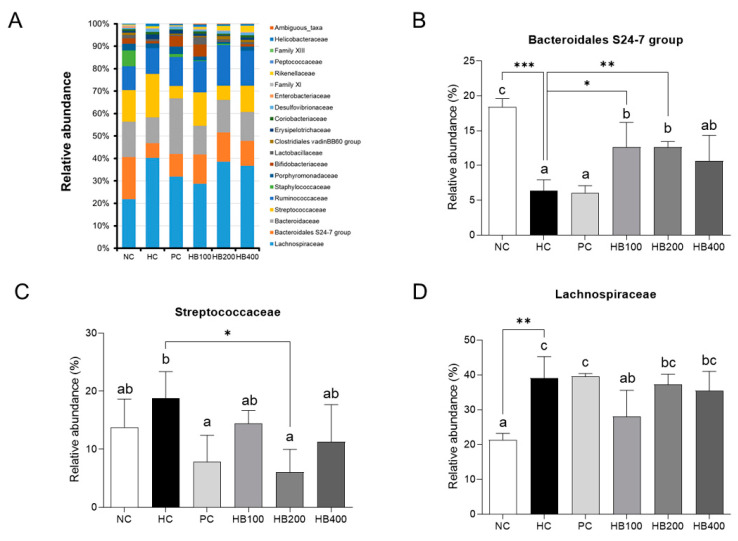
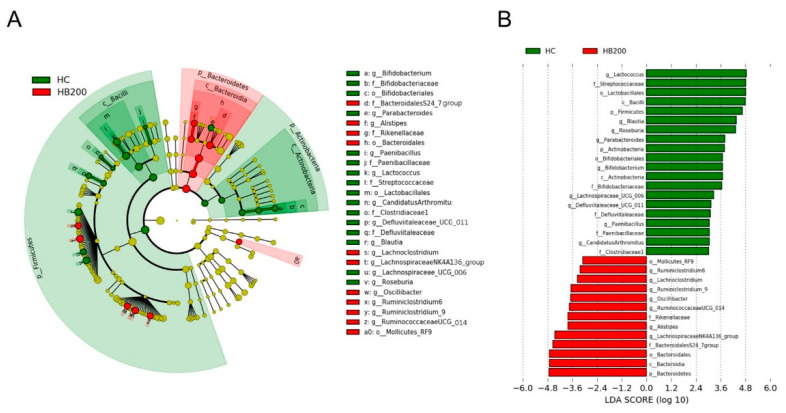
Honeysuckle berry (HB, Lonicera caerulea L.) is an oriental herbal medicine reported to have beneficial effects on metabolic disorders, such as obesity and non-alcoholic fatty liver disease. The fruit part of HB is rich in anthocyanin, a type of polyphenol. Most studies credit the antioxidant and anti-inflammatory properties of HB as the mechanisms of its effectiveness. This study investigated the inhibitory effects of HB on lipase using an in vitro assay and the modulatory effect of HB on gut microbiota in high-fat diet (HFD)-fed mice. HB inhibited pancreatic lipase activity with IC50 values of approximately 0.47 mg/mL. The fecal triglyceride (TG) levels were higher from the HFD of the HB-fed mice than they were for the control mice. Moreover, the fecal microbiota from the HFD of the HB-fed mice had relatively lower Firmicutes and higher Bacteroidetes than that from the HFD-only mice. These results suggest that HB modulates gut microbiota composition, which may contribute to body fat reduction. Hence, HB could present a useful agent for treating metabolic diseases through lower TG uptake and the regulation of gut microflora.
Keywords: Lonicera caerulea L.; gut microbiota; obesity; pancreatic lipase inhibition.
Conflict of interest statement
The authors declare no conflict of interest.
Figures


Similar articles
-
A Systematic Review of Cardio-Metabolic Properties of Lonicera caerulea L.Antioxidants (Basel). 2024 Jun 5;13(6):694. doi: 10.3390/antiox13060694. Antioxidants (Basel). 2024. PMID: 38929133 Free PMC article. Review.
-
Modulation of Gut Microbiota by Lonicera caerulea L. Berry Polyphenols in a Mouse Model of Fatty Liver Induced by High Fat Diet.Molecules. 2018 Dec 5;23(12):3213. doi: 10.3390/molecules23123213. Molecules. 2018. PMID: 30563142 Free PMC article.
-
Anti-Sarcopenic Obesity Effects of Lonicera caerulea Extract in High-Fat Diet-Fed Mice.Antioxidants (Basel). 2021 Oct 17;10(10):1633. doi: 10.3390/antiox10101633. Antioxidants (Basel). 2021. PMID: 34679767 Free PMC article.
-
Preventive Effects of Anthocyanins from Lyciumruthenicum Murray in High-Fat Diet-Induced Obese Mice Are Related to the Regulation of Intestinal Microbiota and Inhibition of Pancreatic Lipase Activity.Molecules. 2022 Mar 26;27(7):2141. doi: 10.3390/molecules27072141. Molecules. 2022. PMID: 35408540 Free PMC article.
-
Lonicera caerulea (Haskap berries): a review of development traceability, functional value, product development status, future opportunities, and challenges.Crit Rev Food Sci Nutr. 2023;63(27):8992-9016. doi: 10.1080/10408398.2022.2061910. Epub 2022 Apr 18. Crit Rev Food Sci Nutr. 2023. PMID: 35435788 Review.
Cited by
-
A Systematic Review of Cardio-Metabolic Properties of Lonicera caerulea L.Antioxidants (Basel). 2024 Jun 5;13(6):694. doi: 10.3390/antiox13060694. Antioxidants (Basel). 2024. PMID: 38929133 Free PMC article. Review.
-
Dietary Supplementation of Haskap Berry (Lonicera caerulea L.) Anthocyanins and Probiotics Attenuate Dextran Sulfate Sodium-Induced Colitis: Evidence from an Experimental Animal Model.Foods. 2024 Jun 24;13(13):1987. doi: 10.3390/foods13131987. Foods. 2024. PMID: 38998493 Free PMC article.
-
Graphene oxide as inhibitor on the hydrolysis of fats under simulated in vitro duodenal conditions.Heliyon. 2024 Mar 22;10(7):e28624. doi: 10.1016/j.heliyon.2024.e28624. eCollection 2024 Apr 15. Heliyon. 2024. PMID: 38560126 Free PMC article.
-
Domestication of medicinal plants (Lonicera japonica Thunb.) in China: comparison of morphological, resistance and biochemical traits between wild and cultivated populations.Front Plant Sci. 2025 Jan 24;15:1501396. doi: 10.3389/fpls.2024.1501396. eCollection 2024. Front Plant Sci. 2025. PMID: 39925369 Free PMC article.
-
Lonicera caerulea Pomace Alleviates DSS-Induced Colitis via Intestinal Barrier Improvement and Gut Microbiota Modulation.Foods. 2023 Sep 5;12(18):3329. doi: 10.3390/foods12183329. Foods. 2023. PMID: 37761037 Free PMC article.
References
MeSH terms
Substances
Grants and funding
LinkOut - more resources
Full Text Sources
Miscellaneous
