. 2022 Jan-Dec;14(1):2096994.
doi: 10.1080/19490976.2022.2096994.

Phospholipid metabolites of the gut microbiota promote hypoxia-induced intestinal injury via CD1d-dependent γδ T cells

Affiliations

Phospholipid metabolites of the gut microbiota promote hypoxia-induced intestinal injury via CD1d-dependent γδ T cells

Yuyu Li et al. Gut Microbes. 2022 Jan-Dec.

Abstract

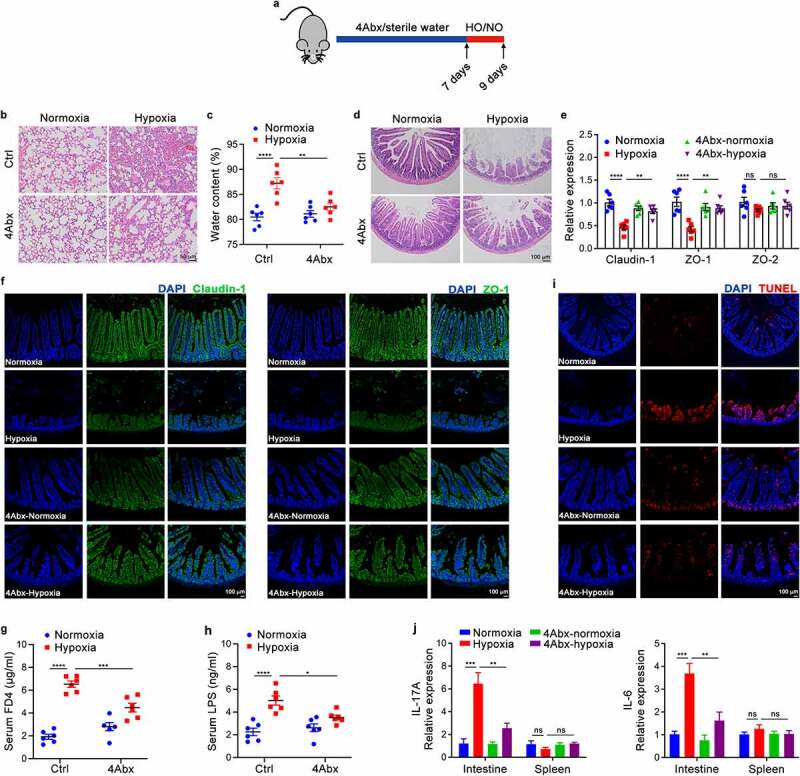
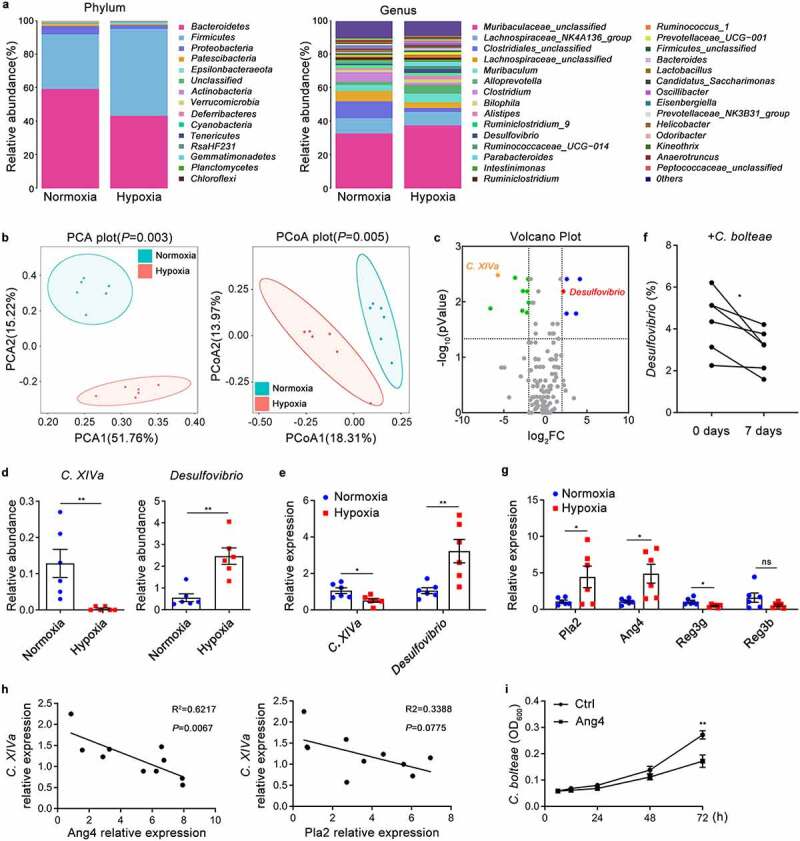
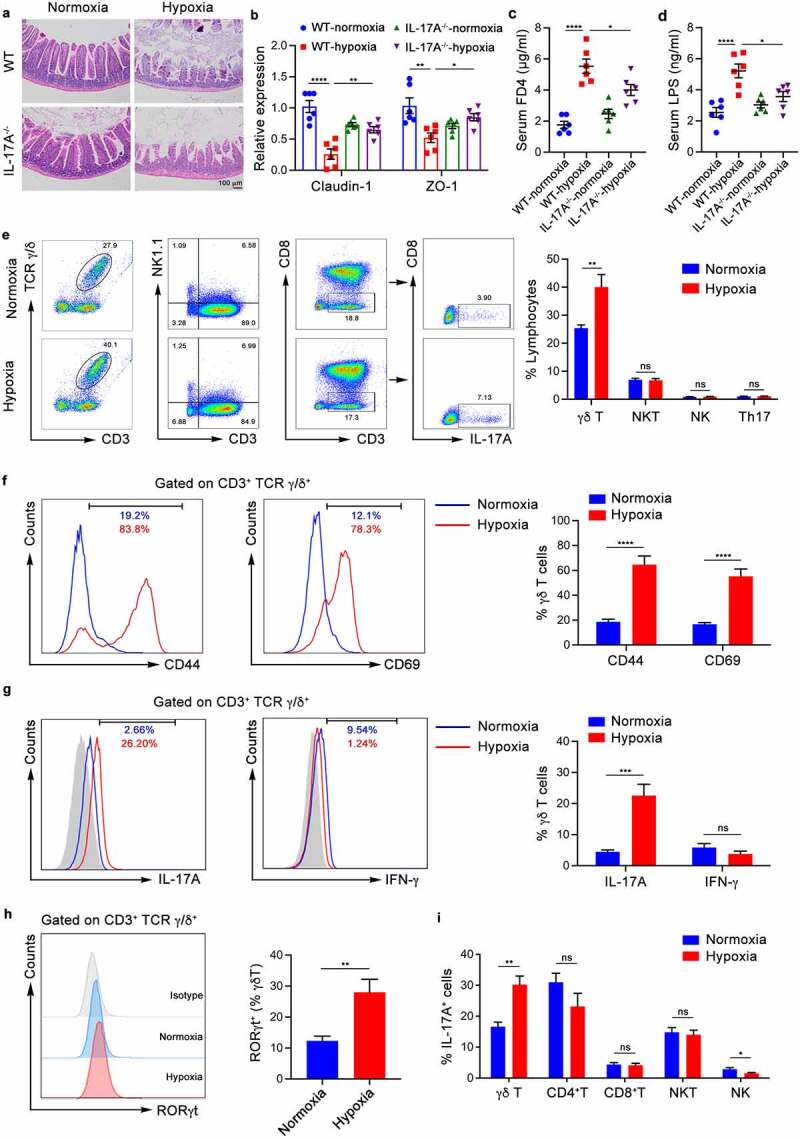
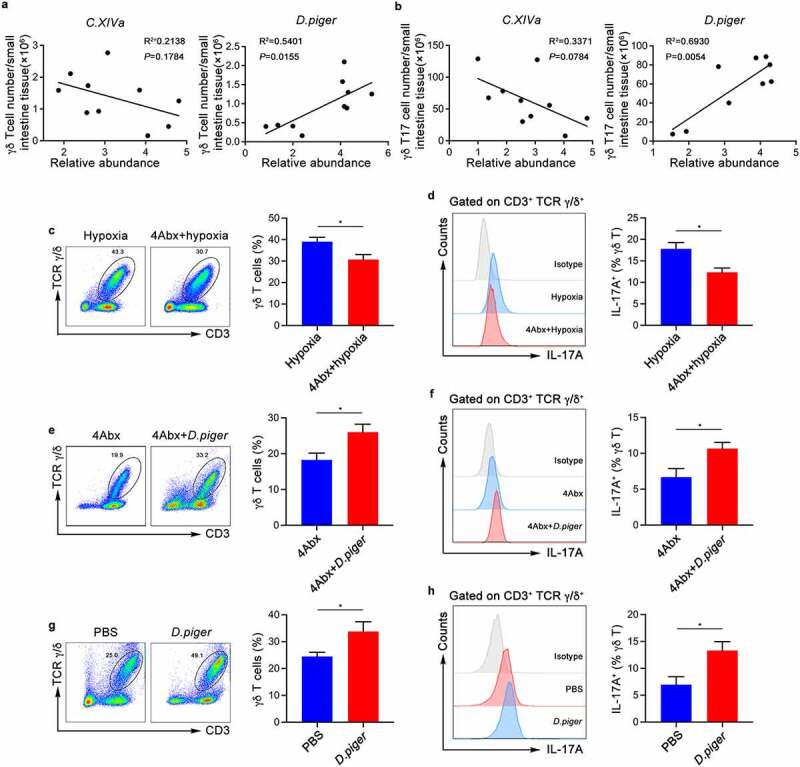
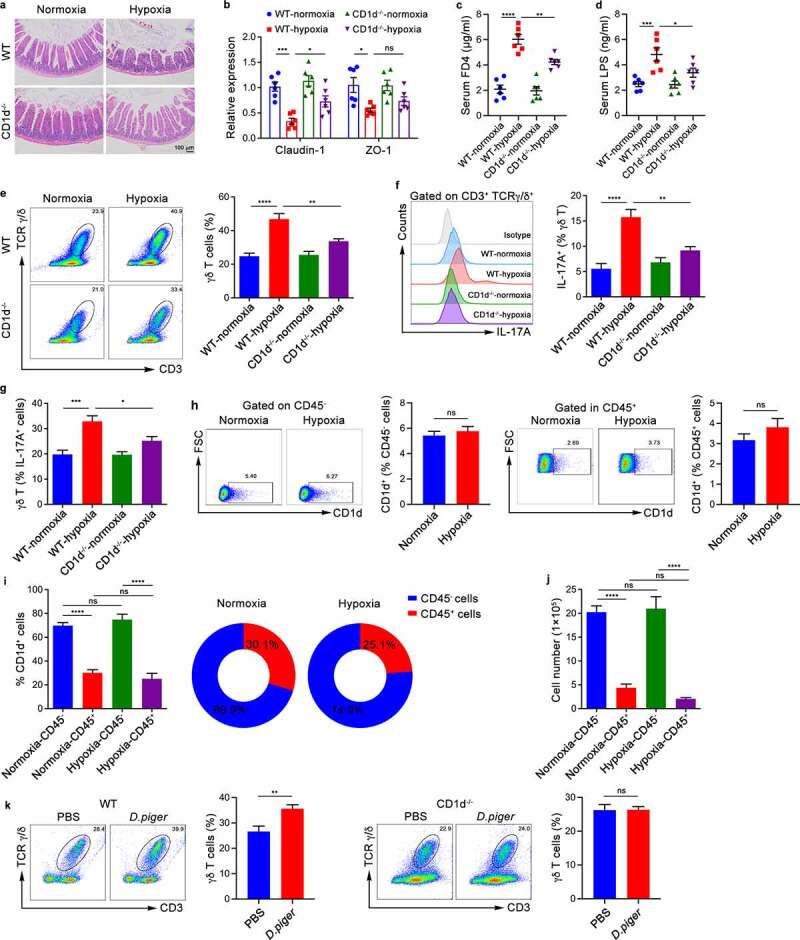
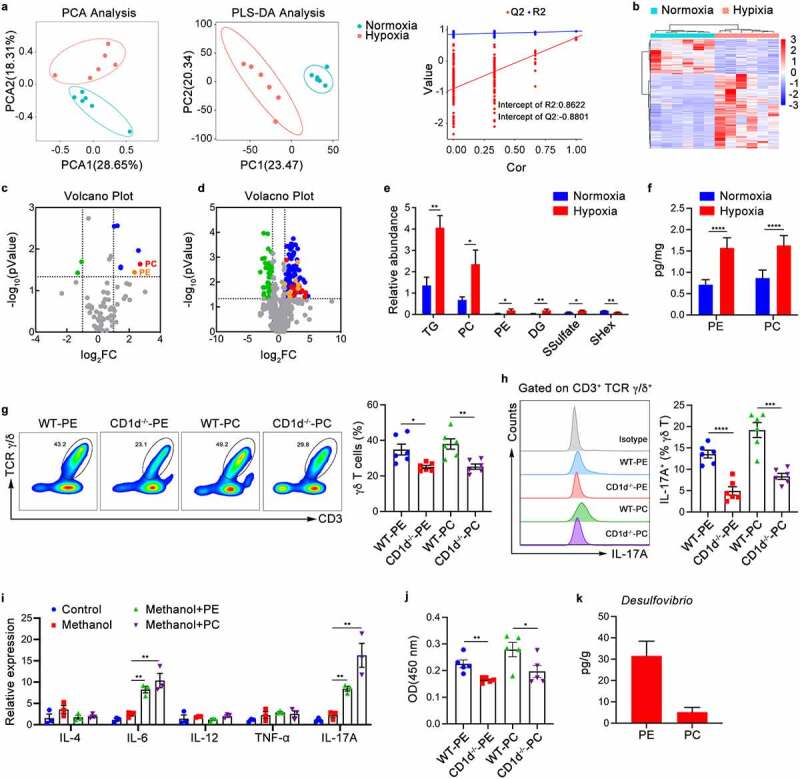
Gastrointestinal dysfunction is a common symptom of acute mountain sickness (AMS). The gut microbiota and γδ T cells play critical roles in intestinal disease. However, the mechanistic link between the microbiota and γδ T cells in hypoxia-induced intestinal injury remains unclear. Here, we show that hypoxia-induced intestinal damage was significantly alleviated after microbiota depletion with antibiotics. Hypoxia modulated gut microbiota composition by promoting antimicrobial peptides angiogenin-4 secretions. The abundance of Clostridium in the gut of mice after hypoxia significantly decreased, while the abundance of Desulfovibrio significantly increased. Furthermore, Desulfovibrio-derived phosphatidylethanolamine and phosphatidylcholine promoted γδ T cell activation. In CD1d-deficient mice, the levels of intraepithelial IL-17A and γδ T cells and intestinal damage were significantly decreased compared with those in wild-type mice under hypoxia. Mechanistically, phospholipid metabolites from Desulfovibrio are presented by intestinal epithelial CD1d to induce the proliferation of IL-17A-producing γδ T cells, which aggravates intestinal injury. Gut microbiota-derived metabolites promote hypoxia-induced intestinal injury via CD1d-dependent γδ T cells, suggesting that phospholipid metabolites and γδ T cells can be targets for AMS therapy.

Keywords: Gut microbiota; hypoxia; intestinal injury; metabolites; γδ T cells.


Conflict of interest statement

The authors report no conflict of interest.

Figures

Figure 1.
Figure 1.
Depletion of the Gut Microbiome Attenuates Intestinal Damage and Pulmonary Edema Caused by Hypoxia. (a) A schematic diagram of SPF mice was administered combined antibiotics (4Abx) or sterile water (Ctrl) by oral gavage for 7 days followed by hypoxia (5.0% oxygen concentration) or normoxia (20.9% oxygen concentration) for 48 hours (n = 3–6). (b) Histopathological analysis of lung tissues from the different groups; representative pictures of H&E staining are shown. Scale bars, 50 µm. (c) The whole lung water content is measured using the (wet-dry)/wet weight ratio. (d) Histopathological analysis of small intestine tissues from the different groups; representative pictures of H&E staining are shown. Scale bars, 100 µm. (e) Real-time qPCR analysis of claudin-1, ZO-1 and ZO-2 gene expression in the intestinal epithelium tissues. (f) Immunofluorescence staining of claudin-1 and ZO-1 was performed to examine intestinal barrier function; representative images are shown. Green: claudin-1 or ZO-1; blue: DAPI. Scale bars, 100 µm. (g) Serum FITC-dextran concentrations in mice after gavage administration. (h) ELISA analysis of LPS concentration in the serum of mice. (i) Immunofluorescence staining of TUNEL was performed to examine apoptotic cells; representative images are shown. Red: TUNEL‐positive nuclei; blue: DAPI. Scale bars, 100 µm. (j) Real-time qPCR analysis of IL-6 and IL-17A gene expression in the intestinal epithelium tissues. The data are representative of three independent experiments and shown by the mean ± SEM. *p <0.05, **p <0.01, ***p <0.001, ****p <0.0001 by one-way ANOVA test with Tukey’s posttest (c, e, g, h, j). HO, hypoxia; NO, normoxia; Ctrl, control; FD4, FITC-dextran 4; LPS, lipopolysaccharide; ns, no significance.
Figure 2.
Figure 2.
Hypoxia Contributes to the Alteration of Gut Microbiota and Associated with Antimicrobial Peptides. (a-d) 16S rRNA analysis was performed on the cecal contents from SPF mice under hypoxia (5.0% oxygen concentration) or normoxia (20.9% oxygen concentration) for 48 hours (n = 6). (a) The relative abundance of intestinal microbiota at the phylum level and genus level. (b) Principal component analysis (PCA) and Principal co-ordinates analysis (PCoA) analysis based on the relative abundance of operational taxonomic units (97% similarity). (c) Volcano plot of differentially expressed genera. (d) The relative abundance of C. XIVa and Desulfovibrio in the cecal contents of normoxic and hypoxic mice was analyzed by 16S rRNA gene sequencing. (e) The relative abundance of C. XIVa and Desulfovibrio in the cecal contents of normoxic and hypoxic mice was quantified by Real-time qPCR analysis (n = 6). (f) Real-time qPCR analysis of Desulfovibrio in SPF mice after C. bolteae administered orally for 7 days (n = 6). (g) Real-time qPCR analysis of antimicrobial peptide Pla2, Ang4, Reg3g and Reg3b gene expression in the intestinal epithelium tissues (n = 6). (h) Correlation analysis between the relative content of C. XIVa and the relative expression of Ang4 or Pla2 in the intestine of SPF mice (n = 8). (i) Spectrophotometry of C. bolteae growth at different time points following recombinant Ang4 (5 µg/ml each) stimulation (n = 3). The data are representative of three independent experiments and shown by the mean ± SEM. *p <0.05, **p <0.01 by unpaired Student’s t-test (d, e, g, i), paired Student’s t-test (f) or linear regression analysis (h). ns, no significance.
Figure 3.
Figure 3.
Proliferation and Activation of γδ Τ Cells in the Small Intestine Epithelium and Production of IL-17A Promote Hypoxia-induced Intestinal Injury. (a-d) WT mice and IL-17A-deficient (IL-17A−/−) mice were housed in hypoxia (5.0% oxygen concentration) or normoxia (20.9% oxygen concentration) for 48 hours (n = 6). (a) Histopathological analysis of small intestine tissues from the different groups; representative pictures of H&E staining are shown. Scale bars, 100 µm. (b) Real-time qPCR analysis of claudin-1, ZO-1 and gene expression in the intestinal epithelium tissues. (c) Serum FITC-dextran concentrations in mice after gavage administration. (d) ELISA analysis of LPS concentration in the serum of mice. (e-i) WT mice were exposed to hypoxia (5.0% oxygen concentration) or normoxia (20.9% oxygen concentration) for 48 hours (n = 6). (e) The frequency of γδ T, NK, NKT and Th17 cells from the epithelial layer of the small intestine were identified by flow cytometry. Representative scatter plot and quantitative data are shown. (f) CD44 and CD69 expression in γδ T cells from the epithelial layer of the small intestine of normoxic mice (blue) and hypoxic mice (red) was analyzed. Representative images and quantitative histograms are shown. (g) IL-17A and IFN-γ expression in γδ T cells from the epithelial layer of the small intestine of normoxia mice (blue) and hypoxia mice (red) was analyzed. Representative images and quantitative histograms are shown. (h) RORγt expression in γδ T cells from the epithelial layer of the small intestine of normoxia mice (blue) and hypoxia mice (red) was analyzed. Representative images and quantitative histograms are shown. (i) The proportion of γδ T, CD4+T, CD8+T, NKT and NK cells in the IL-17A-positive cells of the small intestine epithelial layer was analyzed by flow cytometry. The data are representative of three independent experiments and shown by the mean ± SEM. *p <0.05, **p <0.01, ***p <0.001, ****p <0.0001 by one-way ANOVA test with Tukey’s posttest (b-d) or unpaired Student’s t-test (e-i). FD4, FITC-dextran 4; LPS, lipopolysaccharide; ns, no significance.
Figure 4.
Figure 4.
Commensal Microbiota Induces γδ Τ Cells Proliferation and IL-17A Production. (a) Correlation between the relative abundance of C. XIVa or Desulfovibrio and the numbers of intestinal intraepithelial γδ T cells in SPF wild-type mice (n = 10). (b) Correlation between the relative abundance of C. XIVa or Desulfovibrio and the numbers of intestinal intraepithelial γδ T17 cells in SPF wild-type mice (n = 10). (c-d) The frequency of γδ T cells (c) from the small intestinal epithelial layer of mice treated with sterile water or 4Abx and IL-17A production (d) were determined by flow cytometry. Representative pictures and quantitative data are show (n = 6). (e-f) 4Abx-treated mice were given hypoxia (5.0% oxygen concentration) for 48 hours after intragastric administration of D. piger or PBS. Representative pictures and quantitative data are show (n = 6). (g-h) Total cells of the small intestine epithelial layer were co-cultured with D. piger for 3 days. the frequency of γδ T cells and IL-17A production were determined by flow cytometry. Representative pictures and quantitative data are show (n = 6). The data are representative of three independent experiments and shown by the mean ± SEM. *p <0.05 by linear regression analysis (a and b) or unpaired Student’s t-test (c-h).
Figure 5.
Figure 5.
Commensal Microbiota Activate Intestinal Intraepithelial γδ T Cells in a CD1d-dependent Manner. (a-g) WT mice and CD1d-deficient (CD1d−/−) mice were exposed to hypoxia (5.0% oxygen concentration) or normoxia (20.9% oxygen concentration) for 48 hours (n = 6). (a) Histopathological analysis of small intestine tissues from the different groups; representative pictures of H&E staining are shown. Scale bars, 100 µm. (b) Real-time qPCR analysis of claudin-1, ZO-1 and mRNA expression in the intestinal epithelium tissues. (c) Serum FITC-dextran concentrations in mice after gavage administration. (d) ELISA analysis of LPS concentration in the serum of mice.     (e) The frequency of γδ T cells from the epithelial layer of the small intestine were identified by flow cytometry. Representative scatter plot and quantitative data are shown. (f) IL-17A expression in γδ T cells from the epithelial layer of the small intestine were analyzed. Representative histograms and quantitative data are shown. (g) The proportion of γδ T cells in the IL-17A-positive cells of the small intestine epithelial layer was measured by flow cytometry. (h-j) WT mice were exposed to hypoxia (5.0% oxygen concentration) or normoxia (20.9% oxygen concentration) for 48 hours (n = 6). (h) CD1d expression in the CD45-negative or CD45-positive cells of the small intestine epithelial layer was measured by flow cytometry. Representative scatter plot and quantitative data are show (n = 6 per group). (i) The proportion of CD45-positive or CD45-negative cells in the CD1d-positive cells of the small intestine epithelial layer was measured by flow cytometry. (j) The number of CD45-positive or CD45-negative cells expressing CD1d in the epithelial layer of the small intestine was measured by flow cytometry. (k) Total cells derived from the small intestine epithelial layer of WT or CD1d-/- mice were stimulated with D. piger for 3 days, the frequency of γδ T cells and IL-17A production were determined by flow cytometry. Representative scatter plot and quantitative data are show (n = 6). The data are representative of three independent experiments and shown by the mean ± SEM. *p <0.05, **p <0.01, ***p <0.001, ****p <0.0001 by one-way ANOVA test with Tukey’s posttest (b-g, i and j) or unpaired Student’s t-test (h, k). FD4, FITC-dextran 4; LPS, lipopolysaccharide; ns, no significance.
Figure 6.
Figure 6.
Lipid Antigens PE or PC Derived from Desulfovibrio Are Responsible for the Expansion and Activation of γδ T Cells. (a-e) Lipid metabolomics was performed on the cecal contents from SPF mice under hypoxia (5.0% oxygen concentration) or normoxia (20.9% oxygen concentration) for 48 hours (n = 5–6). (a) PCA and partial least squares (PLS) analysis illustrates the differences in lipid metabolites. (b) The relative abundance of significant lipid metabolites depicted by the heatmap. (c) Volcano plot of the total amount of differentially lipid metabolites. (d) Volcano plot of differentially lipid metabolites. (e) The relative abundance of significant lipid metabolites (top 6) in the cecal contents of normoxic and hypoxic mice was analyzed. (f) Phosphatidylethanolamine (PE) and phosphatidylcholine (PC) in the cecal contents of hypoxic and normoxic mice as examined by ELISA (n = 6). (g-i) 4Abx-treated WT or CD1d−/− mice were given hypoxia (5.0% oxygen concentration) or normoxia (20.9% oxygen concentration) for 48 hours after intraperitoneal injection of lipid antigen PE or PC. Representative pictures and quantitative data are show (n = 3–6). (g-h) The frequency of γδ T cells (g) and IL-17A production (h) were determined by flow cytometry. Representative pictures and quantitative data are show. (i) Real-time qPCR analysis of multiple cytokines gene expression in the intestinal epithelium tissues. (j) Purified γδ T cells were co-cultured with PE or PC-loaded intestinal epithelial cells (IECs) for 3 days. the proliferation of γδ T cells were determined by CCK8 assay (n = 6). (k) The PE or PC content of D. piger were examined by ELISA (n = 3). The data are representative of three independent experiments and shown by the mean ± SEM. *p <0.05, **p <0.01, ***p <0.001, ****p <0.0001 by unpaired Student’s t-test (e-h, j, k) or one-way ANOVA test with Tukey’s posttest (i). PE, Phosphatidylethanolamine; PC, phosphatidylcholine.

Similar articles

Cited by

References

    1. Wilson R. Acute high-altitude illness in mountaineers and problems of rescue. Ann Intern Med. 1973;78(3):421–20. doi:10.7326/0003-4819-78-3-421. - DOI - PubMed
    1. Basnyat B, Murdoch DR. High-altitude illness. Lancet. 2003;361(9373):1967–1974. doi:10.1016/S0140-6736(03)13591-X. - DOI - PubMed
    1. Williamson J, Oakeshott P, Dallimore J. Altitude sickness and Acetazolamide. BMJ. 2018;361:k2153. doi:10.1136/bmj.k2153. - DOI - PubMed
    1. Davis C, Hackett P. Advances in the prevention and treatment of high altitude illness. Emerg Med Clin North Am. 2017;35:241–260. doi:10.1016/j.emc.2017.01.002. - DOI - PubMed
    1. Simancas-Racines D, Arevalo-Rodriguez I, Osorio D, Franco JV, Xu Y, Hidalgo R. Interventions for treating acute high altitude illness. Cochrane Database Syst Rev. 2018;6:CD009567. doi:10.1002/14651858.CD009567.pub2. - DOI - PMC - PubMed

Publication types

LinkOut - more resources