[Preprint]. 2022 Jul 18:2022.07.17.22277721.
doi: 10.1101/2022.07.17.22277721.

A simple SEIR-V model to estimate COVID-19 prevalence and predict SARS-CoV-2 transmission using wastewater-based surveillance data

Affiliations

A simple SEIR-V model to estimate COVID-19 prevalence and predict SARS-CoV-2 transmission using wastewater-based surveillance data

Tin Phan et al. medRxiv. .

Update in

Abstract

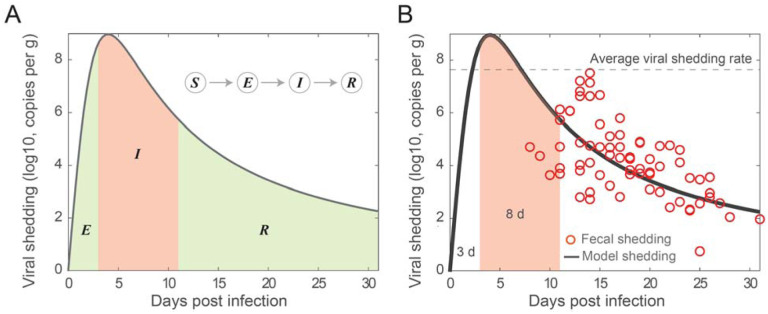
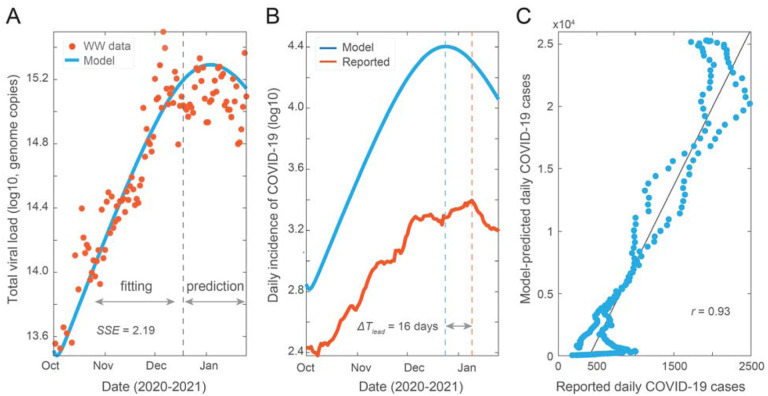
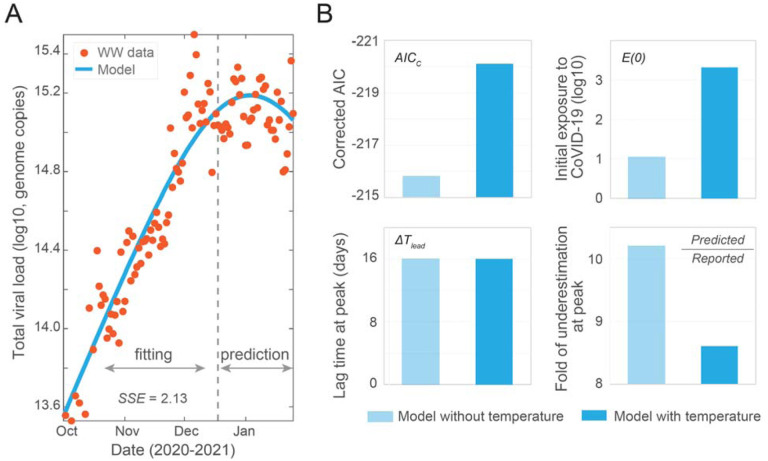
Wastewater-based surveillance (WBS) has been widely used as a public health tool to monitor SARS-CoV-2 transmission. However, epidemiological inference from WBS data remains understudied and limits its application. In this study, we have established a quantitative framework to estimate COVID-19 prevalence and predict SARS-CoV-2 transmission through integrating WBS data into an SEIR-V model. We conceptually divide the individual-level viral shedding course into exposed, infectious, and recovery phases as an analogy to the compartments in population-level SEIR model. We demonstrated that the temperature effect on viral losses in the sewer can be straightforwardly incorporated in our framework. Using WBS data from the second wave of the pandemic (Oct 02, 2020 â€" Jan 25, 2021) in the Great Boston area, we showed that the SEIR-V model successfully recapitulates the temporal dynamics of viral load in wastewater and predicts the true number of cases peaked earlier and higher than the number of reported cases by 16 days and 8.6 folds ( R = 0.93), respectively. This work showcases a simple, yet effective method to bridge WBS and quantitative epidemiological modeling to estimate the prevalence and transmission of SARS-CoV-2 in the sewershed, which could facilitate the application of wastewater surveillance of infectious diseases for epidemiological inference and inform public health actions.


Conflict of interest statement

Declaration of Competing Interest

The authors declare no competing interest.

Figures

Figure 1.
Figure 1.. Illustration and fitting fecal viral shedding dynamics.
(A) Illustration of the fecal viral shedding dynamics based on the infection progression. The viral shedding profile is divided into three periods shaded: Exposed (E), Infectious (I), and Recovered (R). The red-shaded region is the period of infectiousness I which is corresponding to the compartment I in the SEIR model. (B) Fitting of the proposed viral shedding function to viral shedding in hospitalized patients’ stool data from (Wolfel et al. 2020). The average viral shedding rate in stool during the infectious period (from day 3 to day 11) is 4.48 × 10⁷ viral RNA per g. The horizontal dash line is the average fecal viral shedding rate for infectious individuals inferred from the model. The viral shedding peak is at the 4th day post infection.
Figure 2.
Figure 2.. Model fit and prediction to wastewater data covering the second wave of pandemic.
(A) Best fit to virus concentration data in wastewater from October 2 to December 16, 2020 (dashed grey line), and model prediction to January 25, 2021. Red dots are the measured viral load in wastewater and blue curve is the modeling result. (B) Model estimation of the true number of COVID-19 cases (blue curve) and clinically reported cases (red curve). The blue and red dashed lines are dates when the two curves peak, and ΔTlead is the time difference between the two peaks. (C) Correlation between simulation cases and reported cases. Best fit parameters: λ = 9.66 × 10⁻⁸ day−1 person−1, α = 249 g, γ = 0.08).
Figure 3.
Figure 3.. Incorporating temperature effect in the SEIR-V model.
(A) Best fit to viral concentration data in wastewater from October 2 to December 16, 2020 (dashed grey line), and model prediction to January 25, 2021. Red dots are the measured viral load in wastewater and blue curve is the modeling result. (B) Comparison of the SEIR-V models with and without incorporating temperature effect. Top left: corrected Akaike information criterion (AICc) values, the statistically significant AICc difference is 4.3; Top right: initial populations exposed to SARS-CoV-2; Bottom left: wastewater lead time difference at peak, both of the ΔTlead are 16 days; Bottom right: fold of difference between the number of predicted cases and clinically reported cases. Light blue represents the model without including temperate effect, while blue represents the model with temperature effect. Best fit parameters when incorporating temperature: λ = 9.13 × 10⁻⁸ day−1 person−1, α = 324g, and E(0) = 2092 people.

References

    1. Angulo Frederick J, Finelli Lyn, and Swerdlow David L (2021). “Estimation of US SARS-CoV-2 infections, symptomatic infections, hospitalizations, and deaths using seroprevalence surveys”. JAMA Network Open 4(1), pp. 2033706–2033706. - PMC - PubMed
    1. Běhrádek J (1930). “Temperature coefficients in biology”. Biological Reviews 5(1), pp. 30–58.
    1. Bivins Aaron et al. (2020). “Persistence of SARS-CoV-2 in water and wastewater”. Environmental Science & Technology Letters 7(12), pp. 937–942. - PMC - PubMed
    1. Brouwer Andrew F et al. (2022). “The role of time-varying viral shedding in modelling environmental surveillance for public health: revisiting the 2013 poliovirus outbreak in Israel”. Journal of the Royal Society Interface 19(190), pp. 20220006–20220006. - PMC - PubMed
    1. Buckner Jack H, Chowell Gerardo, and Springborn Michael R (2021). “Dynamic prioritization of COVID-19 vaccines when social distancing is limited for essential workers”. Proceedings of the National Academy of Sciences 118(16), pp. 2025786118–2025786118. - PMC - PubMed

Publication types