. 2022 Jul 11:13:954848.
doi: 10.3389/fimmu.2022.954848. eCollection 2022.

Analysis and Experimental Validation of Rheumatoid Arthritis Innate Immunity Gene CYFIP2 and Pan-Cancer

Affiliations

Analysis and Experimental Validation of Rheumatoid Arthritis Innate Immunity Gene CYFIP2 and Pan-Cancer

ZhenYu Zhao et al. Front Immunol. .

Abstract

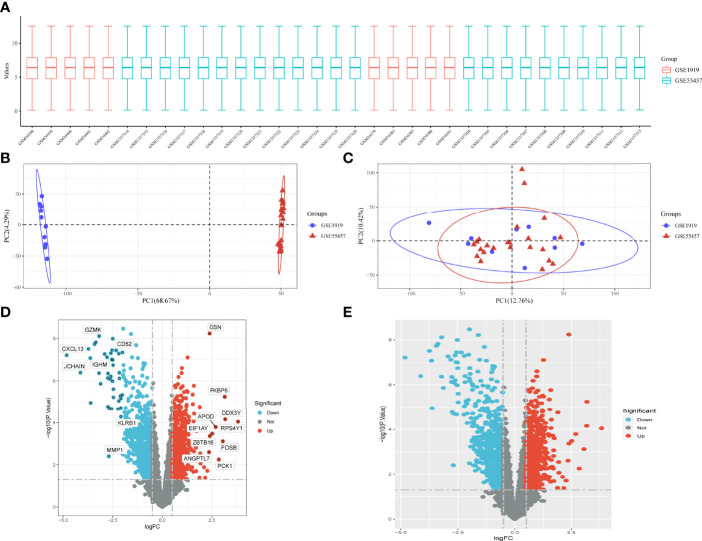
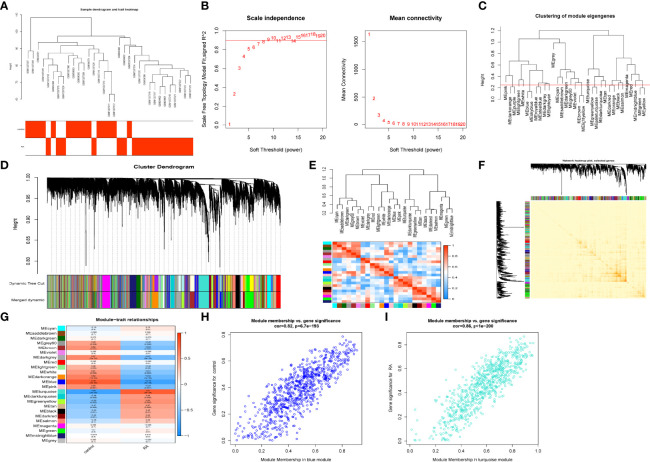
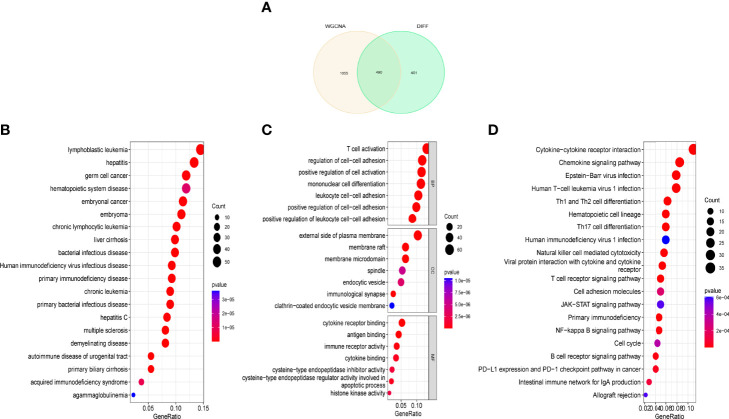
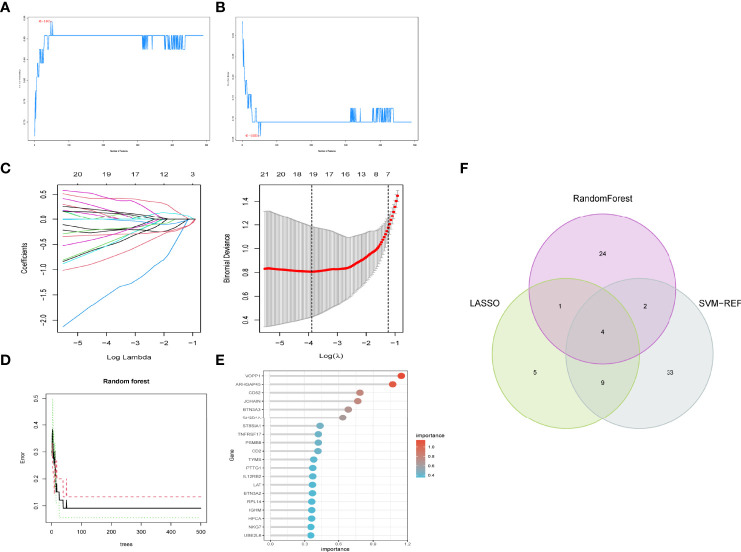
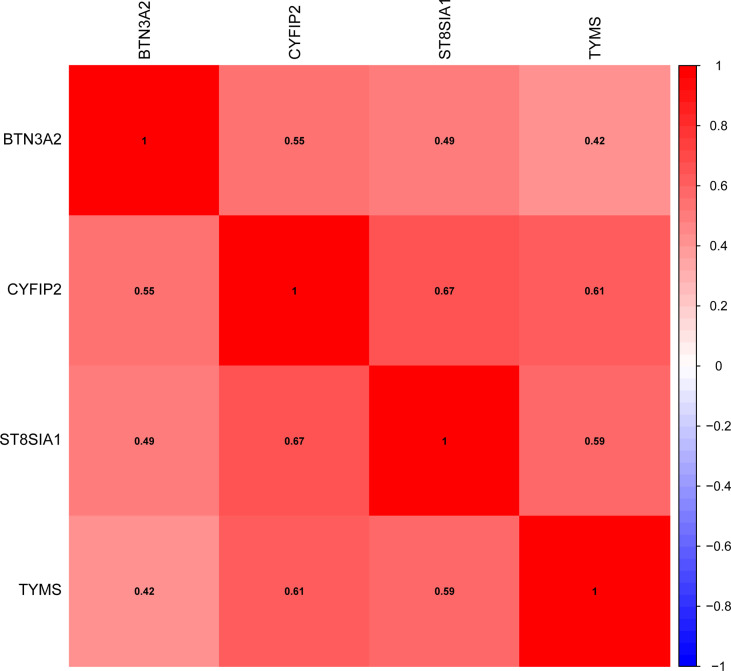
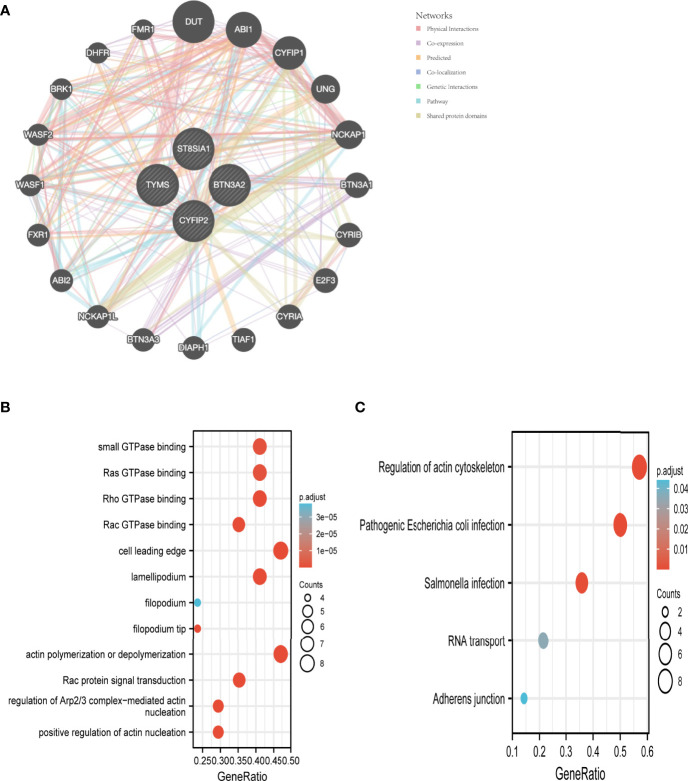
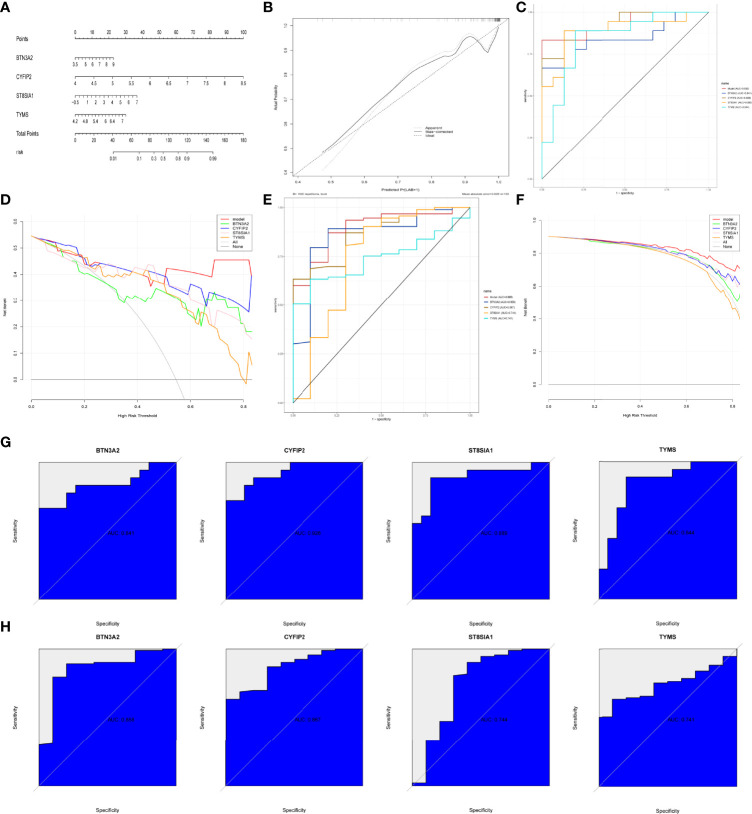
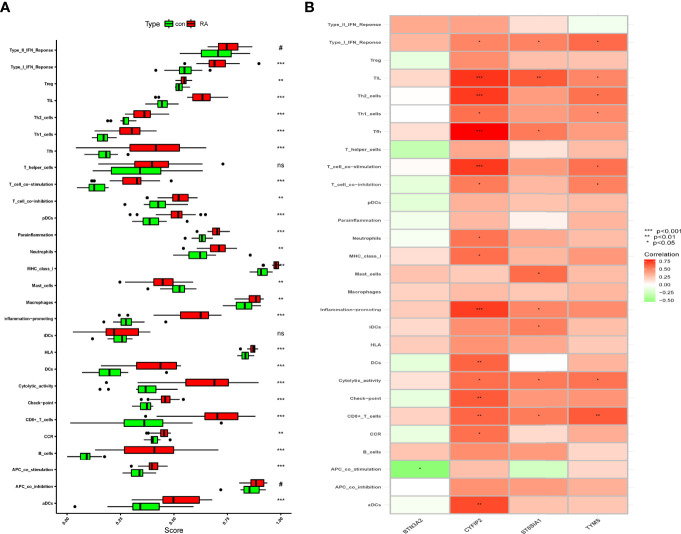
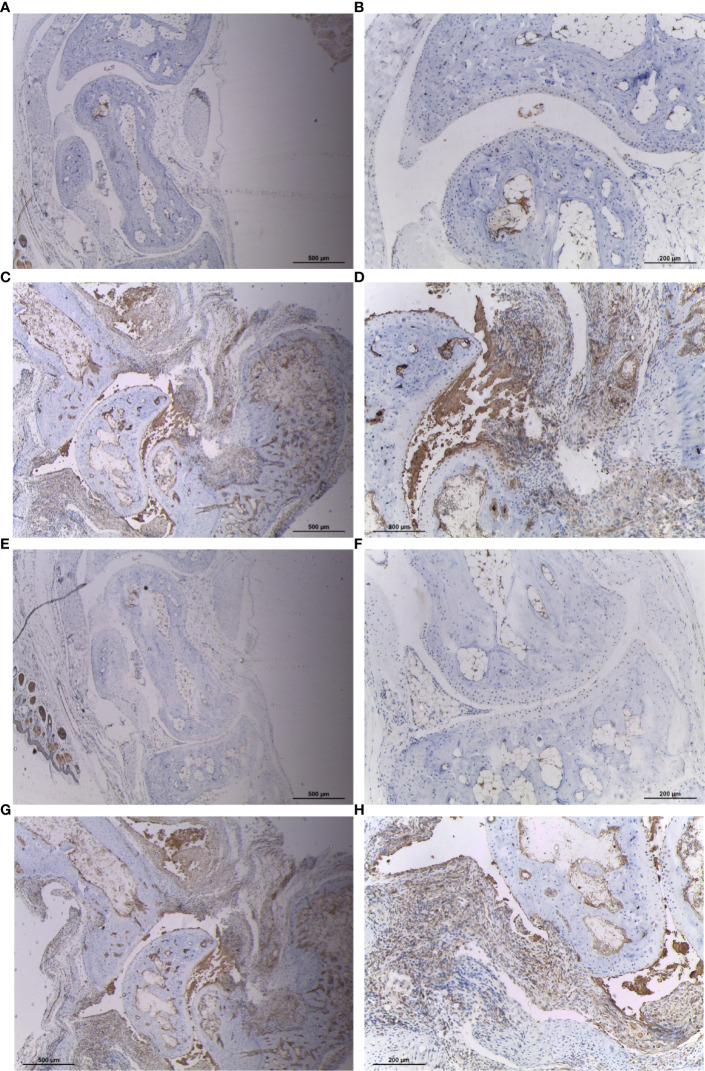
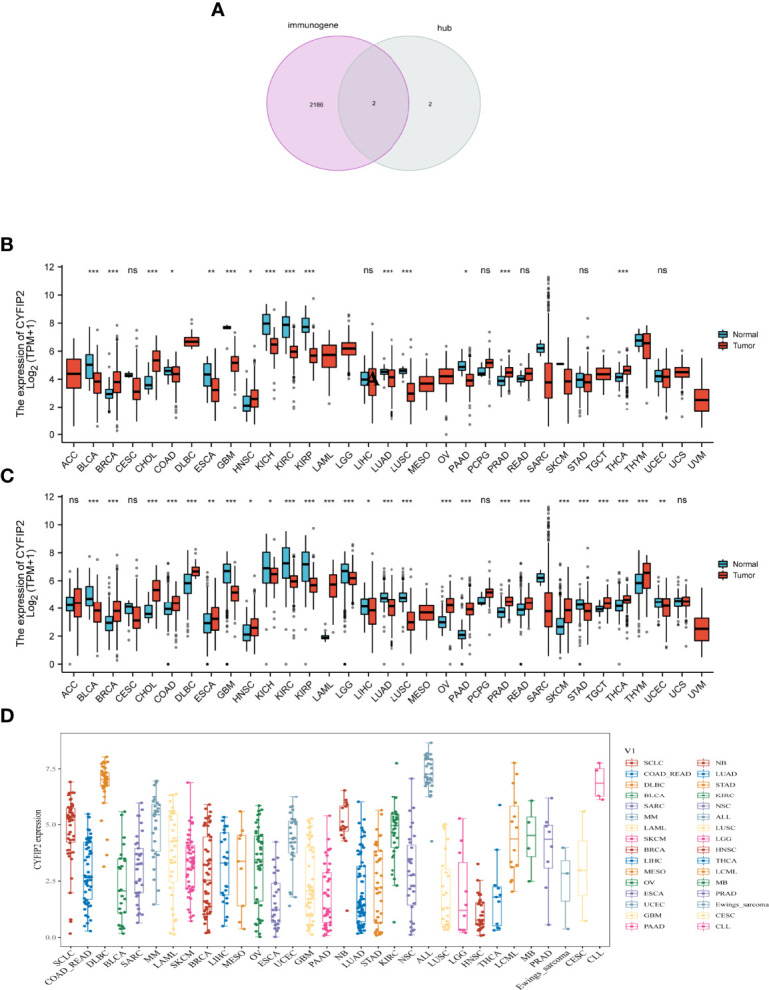
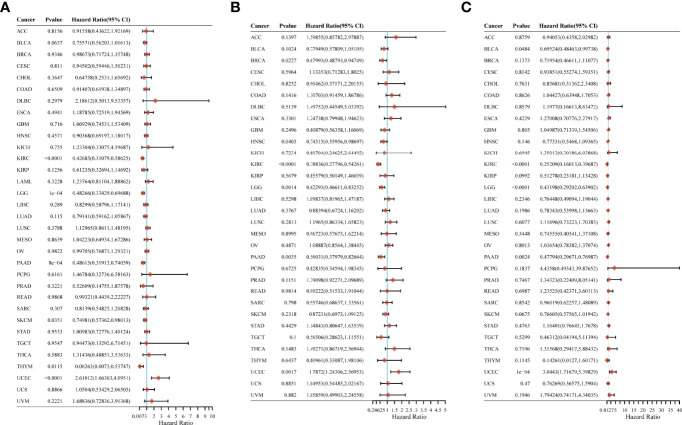
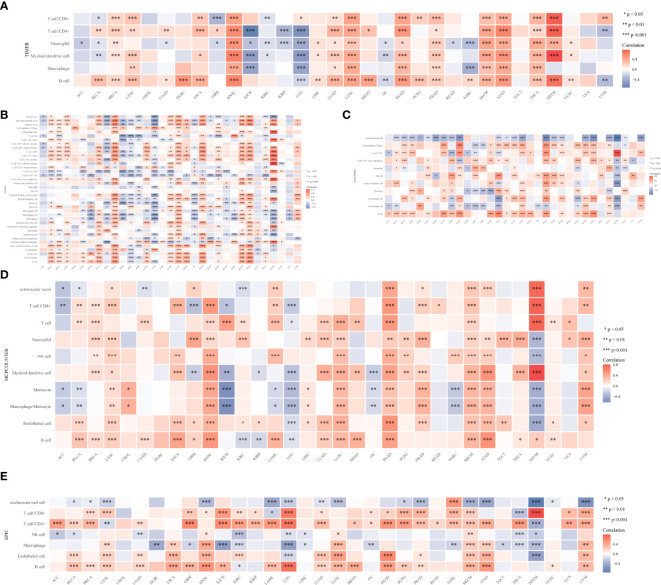
Rheumatoid arthritis (RA) is a chronic, heterogeneous autoimmune disease. Its high disability rate has a serious impact on society and individuals, but there is still a lack of effective and reliable diagnostic markers and therapeutic targets for RA. In this study, we integrated RA patient information from three GEO databases for differential gene expression analysis. Additionally, we also obtained pan-cancer-related genes from the TCGA and GTEx databases. For RA-related differential genes, we performed functional enrichment analysis and constructed a weighted gene co-expression network (WGCNA). Then, we obtained 490 key genes by intersecting the significant module genes selected by WGCNA and the differential genes. After using the RanddomForest, SVM-REF, and LASSO three algorithms to analyze these key genes and take the intersection, based on the four core genes (BTN3A2, CYFIP2, ST8SIA1, and TYMS) that we found, we constructed an RA diagnosis. The nomogram model showed good reliability and validity after evaluation, and the ROC curves of the four genes showed that these four genes played an important role in the pathogenesis of RA. After further gene correlation analysis, immune infiltration analysis, and mouse gene expression validation, we finally selected CYFIP2 as the cut-in gene for pan-cancer analysis. The results of the pan-cancer analysis showed that CYFIP2 was closely related to the prognosis of patients with various tumors, the degree of immune cell infiltration, as well as TMB, MSI, and other indicators, suggesting that this gene may be a potential intervention target for human diseases including RA and tumors.

Keywords: CIA mouse; CYFIP2; GEO; ST8SIA1; WGCNA; pan-cancer; rheumatoid arthritis.


Conflict of interest statement

The authors declare that the research was conducted in the absence of any commercial or financial relationships that could be construed as a potential conflict of interest. The reviewer Z–WG declared a shared parent affiliation with the author MEA to the handling editor at the time of the review.

Figures

Figure 1
Figure 1
Data preprocessing for DEG. (A) Box plots of raw data normalized between samples. (B, C) PCA of RA and control samples. (D) Volcano plot of DEG. (E) Heat map of DEG.
Figure 2
Figure 2
Construction of WGCNA co–expression network. (A) Sample clustering dendrogram with tree leaves corresponding to individual samples. (B) Soft threshold β = 7 and scale–free topological fit index (R2). (C) Clustered dendrograms were cut at a height of 0.25 to detect and combine similar modules. (D) Shows the original and combined modules under the clustering tree. (E) Collinear heat map of module feature genes. Red color indicates a high correlation, blue color indicates opposite results. (F) Clustering dendrogram of module feature genes. (G) Heat map of module–trait correlations. Red represents positive correlations and blue represent negative correlations. (H) MM vs. GS scatter plot of control. (I) MM vs. GS scatter plot of RA.
Figure 3
Figure 3
Functional analysis of key module genes merged with DEGs. (A) Venn diagram of key module genes versus DEGs. (B) DO analysis. (C) GO analysis. (D) KEGG analysis.
Figure 4
Figure 4
Feature gene selection. (A,B) Biomarker signature gene expression validation by support vector machine recursive feature elimination (SVM–RFE) algorithm selection. (C) Adjustment of feature selection in the minimum absolute shrinkage and selection operator model (lasso). (D) randomForest error rate versus the number of classification trees. (E) The top 20 relatively important genes. (F) Three algorithmic Venn diagram screening genes.
Figure 5
Figure 5
Correlation between trait genes.
Figure 6
Figure 6
Interaction analysis of feature genes. (A) Characterized gene co–expression network. (B) GO analysis of co–expressed genes. (C) Co–expressed gene KEGG analysis.
Figure 7
Figure 7
Construction and validation of the RA diagnostic column line graph model. (A) Column line graphs are used to predict the occurrence of RA. (B) ROC curves to assess the clinical value of the column line graph model. (C) Calibration curves to assess the predictive power of the column line graph model. (D) DCA curves to assess the clinical value of the column line graph model. (E, F) Validation set to verify ROC and DCA curves. (G) ROC curves of the feature genes in the training set. (H) ROC curves of the feature genes in the validation set.
Figure 8
Figure 8
Correlation between RA and immunity. (A) Comparison of ssGSEA scores of immune cells and immune pathways between RA group and healthy controls. (B) Correlation between characteristic genes and immunity. *p < 0.05, **p < 0.01, ***p < 0.001. NS, no significance.
Figure 9
Figure 9
Expression of CYFIP2 and ST8SIA1 in the synovial membrane of CIA mice. (A, B) Immunohistochemical analysis of CYFIP2 expression in normal mouse synovium, ((A) original magnification ×40, (B) original magnification ×100). (C, D) Immunohistochemical analysis of CYFIP2 expression in the synovial membrane of CIA mice, ((C) original magnification ×40, (D) original magnification ×100). (E, F) Immunohistochemical analysis of ST8SIA1 expression in normal mouse synovium, ((E) original magnification ×40, (F) original magnification ×100). (G, H) Immunohistochemical analysis of ST8SIA1 expression in the synovial membrane of CIA mice, (G) original magnification ×40, (H) original magnification ×100).
Figure 10
Figure 10
CYFIP2 expression. (A) Venn diagram between immunogene and hub genes. (B) Pan–cancer expression levels of CYFIP2 in the TCGA dataset. (C) Pan–cancer expression levels of CYFIP2 in the TCGA and GTEx datasets. (D) Expression of CYFIP2 in various cell lines. *p <0.05, **p <0.01, ***p <0.001. NS, no significance.
Figure 11
Figure 11
Correlation of CYFIP2 with prognosis in pan–cancer. (A) Cox regression model analysis of the correlation between CYFIP2 expression and OS in various tumors. (B) Cox regression model analysis of the correlation between CYFIP2 expression and PFS in various tumors. (C) Correlation analysis of CYFIP2 expression with DSS in various tumors by Cox regression model.
Figure 12
Figure 12
CYFIP2’s role in tumor immune response. (A) EPIC_Immu_score. (B) XCELL_Immu_score. (C) QUANTISEQ_Immu_score. (D) MCPCOUNTER_Immu_score. (E) TIMER_Immu_score. *p < 0.05, **p < 0.01, ***p < 0.001.

Similar articles

Cited by

References

    1. Aletaha D, Smolen JS. Diagnosis and Management of Rheumatoid Arthritis: A Review. Jama (2018) 320(13):1360–72. doi: 10.1001/jama.2018.13103 - DOI - PubMed
    1. Sparks JA. Rheumatoid Arthritis. Ann Internal Med (2019) 170(1):Itc1–itc16. doi: 10.7326/aitc201901010 - DOI - PubMed
    1. Dedmon LE. The Genetics of Rheumatoid Arthritis. Rheumatol (Oxford England) (2020) 59(10):2661–70. doi: 10.1093/rheumatology/keaa232 - DOI - PubMed
    1. Elshabrawy HA, Chen Z, Volin MV, Ravella S, Virupannavar S, Shahrara S. The Pathogenic Role of Angiogenesis in Rheumatoid Arthritis. Angiogenesis (2015) 18(4):433–48. doi: 10.1007/s10456-015-9477-2 - DOI - PMC - PubMed
    1. Mousavi MJ, Karami J, Aslani S, Tahmasebi MN, Vaziri AS, Jamshidi A, et al. . Transformation of Fibroblast–Like Synoviocytes in Rheumatoid Arthritis, From a Friend to Foe. Auto– Immun highlights (2021) 12(1):3. doi: 10.1186/s13317-020-00145-x - DOI - PMC - PubMed

Publication types

Substances