. 2022 Jul 8:12:909218.
doi: 10.3389/fcimb.2022.909218. eCollection 2022.

Acute Surge of Atypical Memory and Plasma B-Cell Subsets Driven by an Extrafollicular Response in Severe COVID-19

Affiliations

Acute Surge of Atypical Memory and Plasma B-Cell Subsets Driven by an Extrafollicular Response in Severe COVID-19

Taeseob Lee et al. Front Cell Infect Microbiol. .

Erratum in

Abstract

Background: Despite the use of vaccines and therapeutics against the coronavirus disease 2019 (COVID-19) pandemic, this severe disease has been a critical burden on public health, whereas the pathogenic mechanism remains elusive. Recently, accumulating evidence underscores the potential role of the aberrant B-cell response and humoral immunity in disease progression, especially in high-risk groups.

Methods: Using single-cell RNA (scRNA) sequencing analysis, we investigated transcriptional features of B-cell population in peripheral blood from COVID-19 patients and compared them, according to clinical severity and disease course, against a public B-cell dataset.

Results: We confirmed that acute B cells differentiate into plasma cells, particularly in severe patients, potentially through enhanced extrafollicular (EF) differentiation. In severe groups, the elevated plasma B-cell response displayed increased B-cell receptor (BCR) diversity, as well as higher levels of anti-severe acute respiratory syndrome coronavirus 2 (anti-SARS-CoV-2) spike antibodies in plasma, than those in moderate cases, suggesting more robust and heterogeneous plasma cell response in severe COVID-19 patients. Trajectory analysis identified a differentiation pathway for the EF B-cell response from active naïve to atypical memory B cells (AM2), in addition to the emergence of an aberrant plasma cell subset (PC2), which was associated with COVID-19 progression and severity. The AM2 and PC2 subsets surged in the acute phase of the severe disease and presented multiple inflammatory features, including higher cytokine expression and humoral effector function, respectively. These features differ from other B-cell subsets, suggesting a pathogenic potential for disease progression.

Conclusion: The acute surge of AM2 and PC2 subsets with lower somatic hypermutation and higher inflammatory features may be driven by the EF B-cell response during the acute phase of severe COVID-19 and may represent one of the critical drivers in disease severity.

Keywords: B cells; COVID-19; antibody response; extrafollicular response; plasma cell.


Conflict of interest statement

Authors: TL and SL, are employed by Geninus Inc. The remaining authors declare that the research was conducted in the absence of any commercial or financial relationships that could be construed as a potential conflict of interest.

Figures

Figure 1
Figure 1
B-cell compositions and profiles from COVID-19 patients and healthy individuals. (A) UMAP analysis with four clusters annotated by distinct markers of B-cell subtypes. Differentially expressed genes (DEGs) of each cluster are stated in a dot plot with diameter from the percentage of cells expressing each given gene, and with color for expression levels. (B) Proportion bar plot of four B-cell subtypes for each patient categorized by disease course and severity (WHO index). Log-scaled anti–receptor-binding domain (RBD) immunoglobulin G (IgG) titer is presented as colored code on the right-hand side.
Figure 2
Figure 2
Characteristics of B-cell response transcripts in coronavirus disease 2019 (COVID-19) patients according to cellular subtypes and disease severity. (A) Boxplots of the indicated IgH isotype proportion. Each dot represents the proportion of each indicated isotype from each patient and the circle size displays the number of cells identified. (B) Violin plots presenting BCR homogeneous scores (left panels) and anti–severe acute respiratory syndrome coronavirus 2 (anti–SARS-CoV-2) spike RBD-specific IgG titers (right panel). Statistical significance was calculated by Wilcoxon rank sum test: ***p < 0.0001; **p < 0.001; *p < 0.01. NS, not significant. (C) Correlation of anti-RBD-specific IgG titers with average homogeneity score of COVID-19 patients. Statistical significance was calculated by Pearson’s correlation.
Figure 3
Figure 3
Characterization of B-cell subsets in detail using transcriptional signatures and somatic hypermutation rate. (A) Uniform Manifold Approximation, and Projection (UMAP) for clustered B-cell subsets. (B) Dot plot for the most significant DEGs of each subset. Diameter presents the percentage of cells expressing the DEG and with color for expression level. (C) Boxplots for a percentage of somatic hypermutation rate of IGH of the indicated subset. The number of BCR sequences used for one boxplot is stated within the blanket. (D) Trajectory UMAP for subsets of naïve and memory B cells with lines of potential differentiation lineages. (E) Cell density on trajectory UMAP of naïve and memory B-cell subsets. The number of cells and expression purity is displayed for the indicated patient group. (F) Trajectory UMAP for plasmablasts and plasma cell subsets. (G) Cellular densities on the UMAP of plasmablasts and plasma cell subsets.
Figure 4
Figure 4
Cellular proportions of extrafollicular (EF) B cells (AN, DN, and AM2) in total B-cell population (A) and plasma cell 2 (PC2) among plasma cells (B). p-values were calculated by the Kruskall–Wallis test. The number of patients in each group is presented within the blanket.
Figure 5
Figure 5
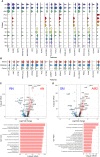
Characterization of EF B-cell subsets. (A) Gene expression violin plots of the 20 most significant DEGs in three EF B-cell subsets (AN, DN, and AM2) in comparison with other B-cell subsets. (B) Violin plots of top 20 DEGs in the severe group across three EF B-cell subsets. Volcano plot and bar plot presenting significant DEGs and top 10 significant GO terms when compared between AN and RN B-cell subsets (C), or between AM2 and SM B-cell subsets (D).
Figure 6
Figure 6
Characterization of AM2 B-cell subsets by gene set enrichment analysis for inflammatory functions in comparison with other B-cell subsets. Statistical significance was calculated by Wilcoxon rank sum test: ***p < 0.0001; **p < 0.001; *p < 0.01. NS, not significant.

References

    1. 10X Genomics . (2022). Single Cell Immune Profiling Dataset. Available at: https://www.10xgenomics.com/resources/datasets.
    1. Allman D., Wilmore J. R., Gaudette B. T. (2019). The Continuing Story of T-Cell Independent Antibodies. Immunol. Rev. 288 (1), 128–135. doi: 10.1111/imr.12754 - DOI - PMC - PubMed
    1. Bastard P., Rosen L. B., Zhang Q., Michailidis E., Hoffmann H. H., Zhang Y., et al. . (2020). Autoantibodies Against Type I IFNs in Patients With Life-Threatening COVID-19. Science 370 (6515), eabd4585. doi: 10.1126/science.abd4585 - DOI - PMC - PubMed
    1. Becht E., McInnes L., Healy J., Dutertre C. A., Kwok I. W. H., Ng L. G., et al. . (2019). Dimensionality Reduction for Visualizing Single-Cell Data Using UMAP. Nat. Biotechnol. 37 (1), 38–3+. doi: 10.1038/nbt.4314 - DOI - PubMed
    1. Bernardes J. P., Mishra N., Tran F., Bahmer T., Best L., Blase J. I., et al. . (2020). Longitudinal Multi-Omics Analyses Identify Responses of Megakaryocytes, Erythroid Cells, and Plasmablasts as Hallmarks of Severe COVID-19. Immunity 53 (6), 1296–1314 e9. doi: 10.1016/j.immuni.2020.11.017 - DOI - PMC - PubMed

Publication types

Substances

LinkOut - more resources