iCOMIC: a graphical interface-driven bioinformatics pipeline for analyzing cancer omics data
- PMID: 35899080
- PMCID: PMC9310080
- DOI: 10.1093/nargab/lqac053
iCOMIC: a graphical interface-driven bioinformatics pipeline for analyzing cancer omics data
Abstract
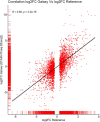
Despite the tremendous increase in omics data generated by modern sequencing technologies, their analysis can be tricky and often requires substantial expertise in bioinformatics. To address this concern, we have developed a user-friendly pipeline to analyze (cancer) genomic data that takes in raw sequencing data (FASTQ format) as input and outputs insightful statistics. Our iCOMIC toolkit pipeline featuring many independent workflows is embedded in the popular Snakemake workflow management system. It can analyze whole-genome and transcriptome data and is characterized by a user-friendly GUI that offers several advantages, including minimal execution steps and eliminating the need for complex command-line arguments. Notably, we have integrated algorithms developed in-house to predict pathogenicity among cancer-causing mutations and differentiate between tumor suppressor genes and oncogenes from somatic mutation data. We benchmarked our tool against Genome In A Bottle benchmark dataset (NA12878) and got the highest F1 score of 0.971 and 0.988 for indels and SNPs, respectively, using the BWA MEM-GATK HC DNA-Seq pipeline. Similarly, we achieved a correlation coefficient of r = 0.85 using the HISAT2-StringTie-ballgown and STAR-StringTie-ballgown RNA-Seq pipelines on the human monocyte dataset (SRP082682). Overall, our tool enables easy analyses of omics datasets, significantly ameliorating complex data analysis pipelines.
© The Author(s) 2022. Published by Oxford University Press on behalf of NAR Genomics and Bioinformatics.
Figures


Similar articles
-
hppRNA-a Snakemake-based handy parameter-free pipeline for RNA-Seq analysis of numerous samples.Brief Bioinform. 2018 Jul 20;19(4):622-626. doi: 10.1093/bib/bbw143. Brief Bioinform. 2018. PMID: 28096075
-
High-throughput bioinformatics with the Cyrille2 pipeline system.BMC Bioinformatics. 2008 Feb 12;9:96. doi: 10.1186/1471-2105-9-96. BMC Bioinformatics. 2008. PMID: 18269742 Free PMC article.
-
An integrated SNP mining and utilization (ISMU) pipeline for next generation sequencing data.PLoS One. 2014 Jul 8;9(7):e101754. doi: 10.1371/journal.pone.0101754. eCollection 2014. PLoS One. 2014. PMID: 25003610 Free PMC article.
-
scAnalyzeR: A Comprehensive Software Package With Graphical User Interface for Single-Cell RNA Sequencing Analysis and its Application on Liver Cancer.Technol Cancer Res Treat. 2022 Jan-Dec;21:15330338221142729. doi: 10.1177/15330338221142729. Technol Cancer Res Treat. 2022. PMID: 36476060 Free PMC article.
-
Automated Isoform Diversity Detector (AIDD): a pipeline for investigating transcriptome diversity of RNA-seq data.BMC Bioinformatics. 2020 Dec 30;21(Suppl 18):578. doi: 10.1186/s12859-020-03888-6. BMC Bioinformatics. 2020. PMID: 33375933 Free PMC article.
Cited by
-
MIRACUM-Pipe: An Adaptable Pipeline for Next-Generation Sequencing Analysis, Reporting, and Visualization for Clinical Decision Making.Cancers (Basel). 2023 Jul 1;15(13):3456. doi: 10.3390/cancers15133456. Cancers (Basel). 2023. PMID: 37444566 Free PMC article.
-
Periodontal treatment and microbiome-targeted therapy in management of periodontitis-related nonalcoholic fatty liver disease with oral and gut dysbiosis.World J Gastroenterol. 2023 Feb 14;29(6):967-996. doi: 10.3748/wjg.v29.i6.967. World J Gastroenterol. 2023. PMID: 36844143 Free PMC article. Review.
References
-
- Nocq J., Celton M., Gendron P., Lemieux S., Wilhelm B.T.. Harnessing virtual machines to simplify next-generation DNA sequencing analysis. Bioinforma. Oxf. Engl. 2013; 29:2075–2083. - PubMed
LinkOut - more resources
Full Text Sources
Other Literature Sources

