

Effect of Tanshinone IIA on Gut Microbiome in Diabetes-Induced Cognitive Impairment
- PMID: 35899118
- PMCID: PMC9309808
- DOI: 10.3389/fphar.2022.890444
Effect of Tanshinone IIA on Gut Microbiome in Diabetes-Induced Cognitive Impairment
Abstract
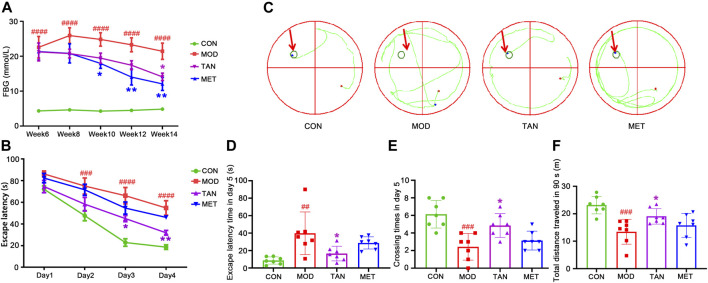
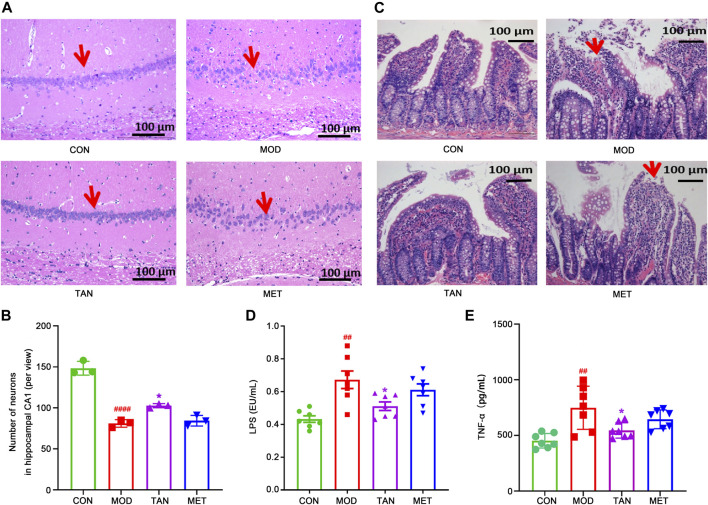
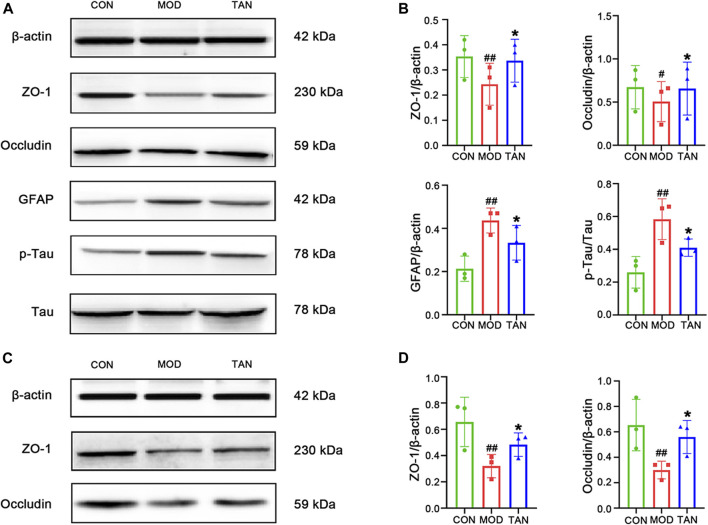
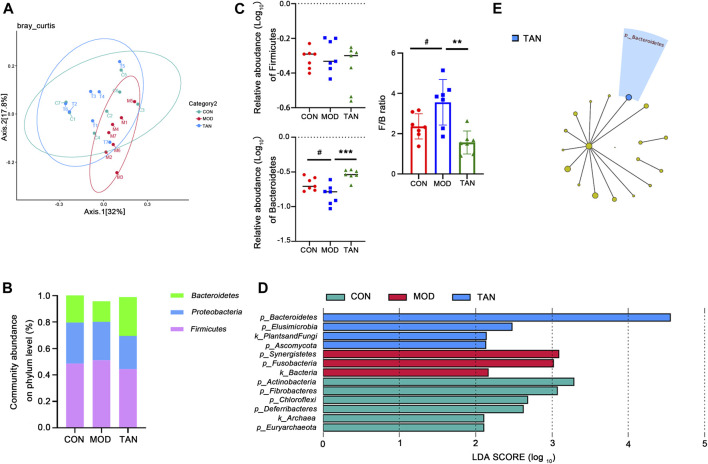
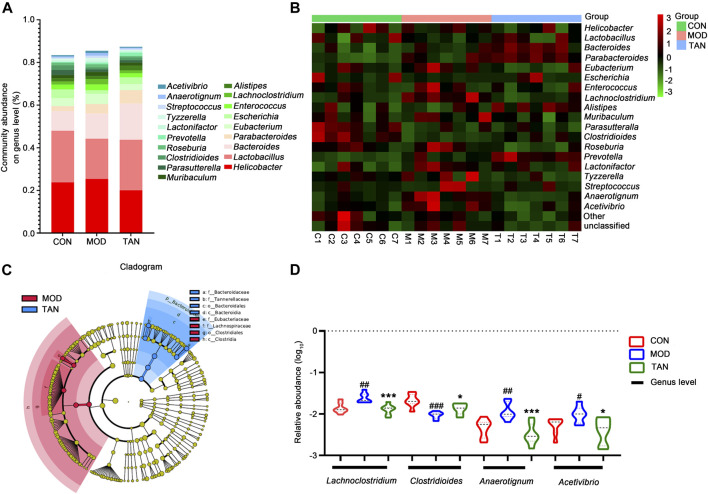
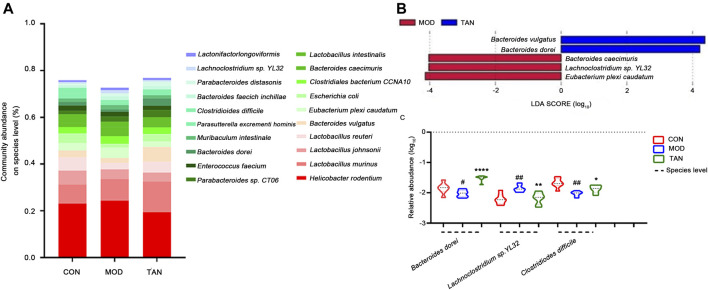
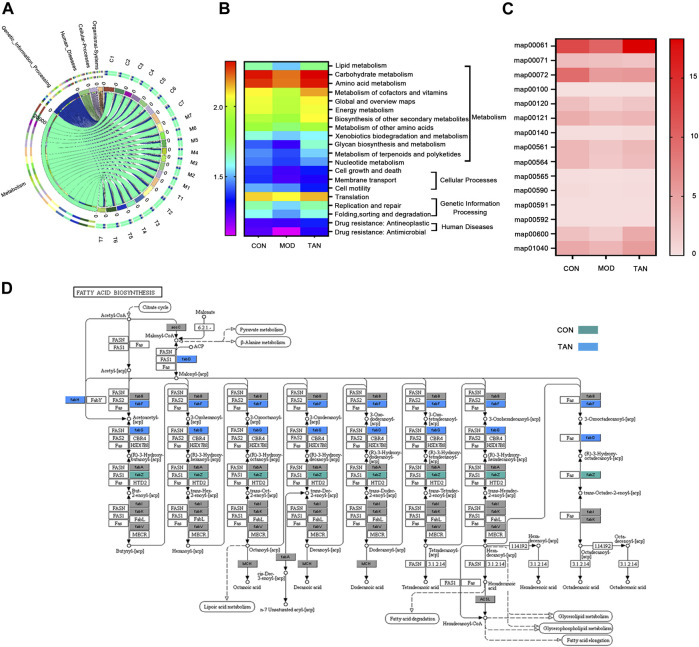
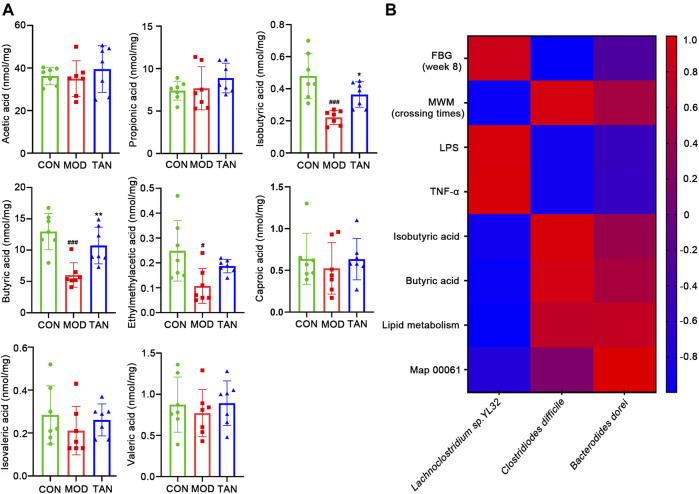
Diabetes-induced cognitive impairment (DCI) presents a major public health risk among the aging population. Previous clinical attempts on known therapeutic targets for DCI, such as depleted insulin secretion, insulin resistance, and hyperglycaemia have delivered poor patient outcomes. However, recent evidence has demonstrated that the gut microbiome plays an important role in DCI by modulating cognitive function through the gut-brain crosstalk. The bioactive compound tanshinone IIA (TAN) has shown to improve cognitive and memory function in diabetes mellitus models, though the pharmacological actions are not fully understood. This study aims to investigate the effect and underlying mechanism of TAN in attenuating DCI in relation to regulating the gut microbiome. Metagenomic sequencing analyses were performed on a group of control rats, rats with diabetes induced by a high-fat/high-glucose diet (HFD) and streptozotocin (STZ) (model group) and TAN-treated diabetic rats (TAN group). Cognitive and memory function were assessed by the Morris water maze test, histopathological assessment of brain tissues, and immunoblotting of neurological biomarkers. The fasting blood glucose (FBG) level was monitored throughout the experiments. The levels of serum lipopolysaccharide (LPS) and tumor necrosis factor-α (TNF-α) were measured by enzyme-linked immunoassays to reflect the circulatory inflammation level. The morphology of the colon barrier was observed by histopathological staining. Our study confirmed that TAN reduced the FBG level and improved the cognitive and memory function against HFD- and STZ-induced diabetes. TAN protected the endothelial tight junction in the hippocampus and colon, regulated neuronal biomarkers, and lowered the serum levels of LPS and TNF-α. TAN corrected the reduced abundance of Bacteroidetes in diabetic rats. At the species level, TAN regulated the abundance of B. dorei, Lachnoclostridium sp. YL32 and Clostridiodes difficile. TAN modulated the lipid metabolism and biosynthesis of fatty acids in related pathways as the main functional components. TAN significantly restored the reduced levels of isobutyric acid and butyric acid. Our results supported the use of TAN as a promising therapeutic agent for DCI, in which the underlying mechanism may be associated with gut microbiome regulation.
Keywords: diabetes-induced cognitive impairment; gut microbiome; inflammation; lipid metabolism; short-chain fatty acid; tanshinone IIA.
Copyright © 2022 Zheng, Zhou, Wang, Zhang, Chang, Liu, Zhu, Zhuang, Shi, Wang, Chen, Cheng, Lin, Nan, Sun, Min, Liu, Chen, Zhang and Huang.
Conflict of interest statement
The authors declare that the research was conducted in the absence of any commercial or financial relationships that could be perceived as a potential conflict of interest. As a medical research institute, NICM Health Research Institute receives research grants and donations from foundations, universities, government agencies, individuals and industry. Sponsors and donors also provide untied funding for work to advance the vision and mission of the Institute.
Figures
Similar articles
-
Effect of melatonin on gut microbiome and metabolomics in diabetic cognitive impairment.Front Pharmacol. 2024 Nov 21;15:1489834. doi: 10.3389/fphar.2024.1489834. eCollection 2024. Front Pharmacol. 2024. PMID: 39640487 Free PMC article.
-
Reshaping the gut microbiota: Tangliping decoction and its core blood-absorbed component quercetin improve diabetic cognitive impairment.Phytomedicine. 2025 May;140:156560. doi: 10.1016/j.phymed.2025.156560. Epub 2025 Mar 5. Phytomedicine. 2025. PMID: 40058319
-
Tanshinone IIA exerts neuroprotective effects on hippocampus-dependent cognitive impairments in diabetic rats by attenuating ER stress-induced apoptosis.Biomed Pharmacother. 2018 Aug;104:530-536. doi: 10.1016/j.biopha.2018.05.040. Epub 2018 May 25. Biomed Pharmacother. 2018. PMID: 29800917
-
Pharmacological Activity and Mechanism of Tanshinone IIA in Related Diseases.Drug Des Devel Ther. 2020 Nov 5;14:4735-4748. doi: 10.2147/DDDT.S266911. eCollection 2020. Drug Des Devel Ther. 2020. PMID: 33192051 Free PMC article. Review.
-
Probiotics: A potential strategy for improving diabetes mellitus complicated with cognitive impairment.Microbiol Res. 2025 Jan;290:127960. doi: 10.1016/j.micres.2024.127960. Epub 2024 Oct 31. Microbiol Res. 2025. PMID: 39515265 Review.
Cited by
-
Dynamics of Gut Microbiota and Clinical Variables after Ketogenic and Mediterranean Diets in Drug-Naïve Patients with Type 2 Diabetes Mellitus and Obesity.Metabolites. 2022 Nov 10;12(11):1092. doi: 10.3390/metabo12111092. Metabolites. 2022. PMID: 36355175 Free PMC article.
-
Protective effect of the curcumin-baicalein combination against macrovascular changes in diabetic angiopathy.Front Endocrinol (Lausanne). 2022 Aug 18;13:953305. doi: 10.3389/fendo.2022.953305. eCollection 2022. Front Endocrinol (Lausanne). 2022. PMID: 36060932 Free PMC article.
-
Uncovering the molecular mechanisms of tonifying kidney and activating blood Decoction against myocardial fibrosis using network Pharmacology and experimental validation.Sci Rep. 2025 May 29;15(1):18912. doi: 10.1038/s41598-025-01276-9. Sci Rep. 2025. PMID: 40442166 Free PMC article.
-
The Combination of Exercise and Konjac Glucomannan More Effectively Prevents Antibiotics-Induced Dysbiosis in Mice Compared with Singular Intervention.Nutrients. 2024 Sep 2;16(17):2942. doi: 10.3390/nu16172942. Nutrients. 2024. PMID: 39275258 Free PMC article.
-
Impact of Ketogenic and Mediterranean Diets on Gut Microbiota Profile and Clinical Outcomes in Drug-Naïve Patients with Diabesity: A 12-Month Pilot Study.Metabolites. 2025 Jan 6;15(1):22. doi: 10.3390/metabo15010022. Metabolites. 2025. PMID: 39852366 Free PMC article.
References
-
- An L., Zhou M., Marikar F. M. M. T., Hu X. W., Miao Q. Y., Li P., et al. (2017). Salvia Miltiorrhiza Lipophilic Fraction Attenuates Oxidative Stress in Diabetic Nephropathy through Activation of Nuclear Factor Erythroid 2-related Factor 2. Am. J. Chin. Med. 45, 1441–1457. 10.1142/S0192415X17500781 - DOI - PubMed
-
- Bioque M., González-Rodríguez A., Garcia-Rizo C., Cobo J., Monreal J. A., Usall J., et al. (2021). Targeting the Microbiome-Gut-Brain axis for Improving Cognition in Schizophrenia and Major Mood Disorders: A Narrative Review. Prog. Neuropsychopharmacol. Biol. Psychiatry 105, 110130. 10.1016/j.pnpbp.2020.110130 - DOI - PubMed
LinkOut - more resources
Full Text Sources