. 2022 Jun 23;15(7):1062-1078.
doi: 10.1111/eva.13426. eCollection 2022 Jul.

Comparative mitogenomics elucidates the population genetic structure of Amblyomma testudinarium in Japan and a closely related Amblyomma species in Myanmar

Affiliations

Comparative mitogenomics elucidates the population genetic structure of Amblyomma testudinarium in Japan and a closely related Amblyomma species in Myanmar

Wessam Mohamed Ahmed Mohamed et al. Evol Appl. .

Abstract

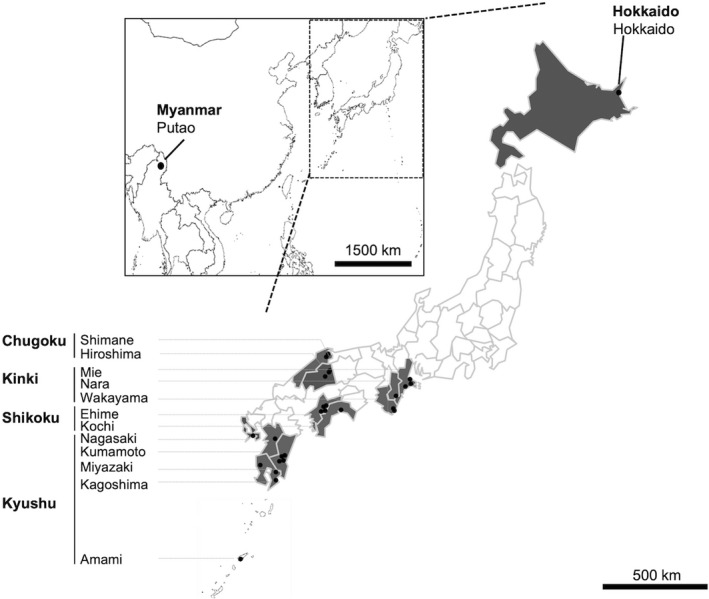
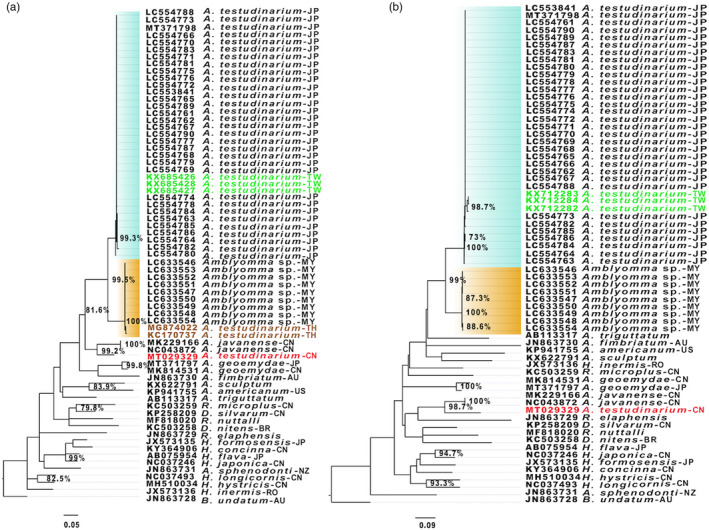
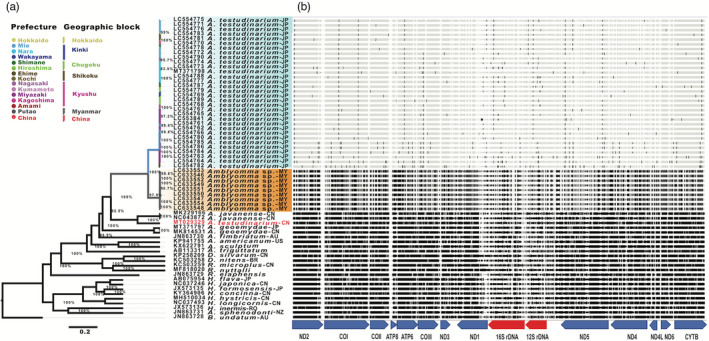
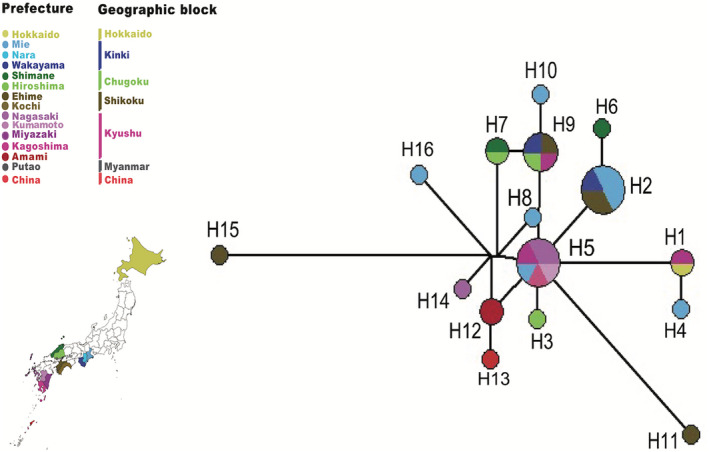
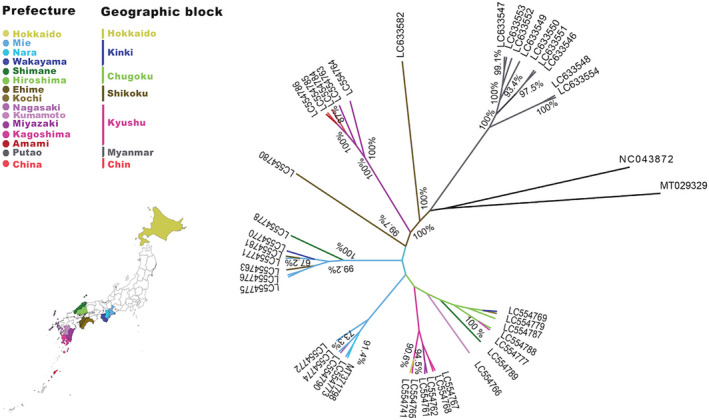
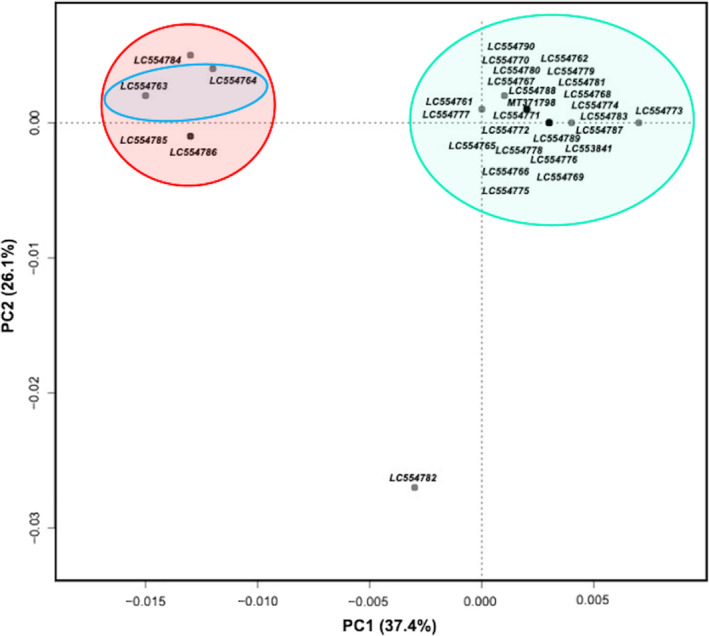
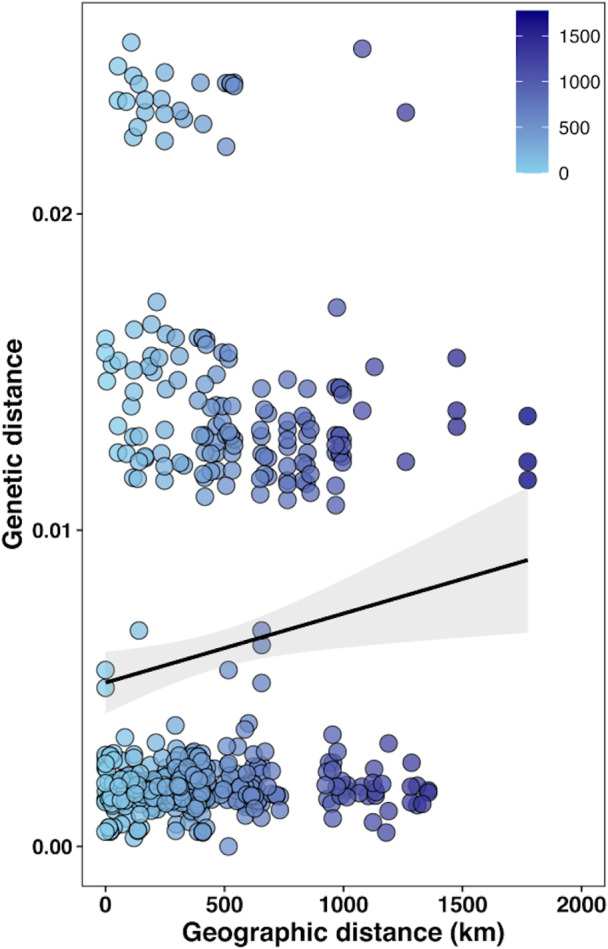
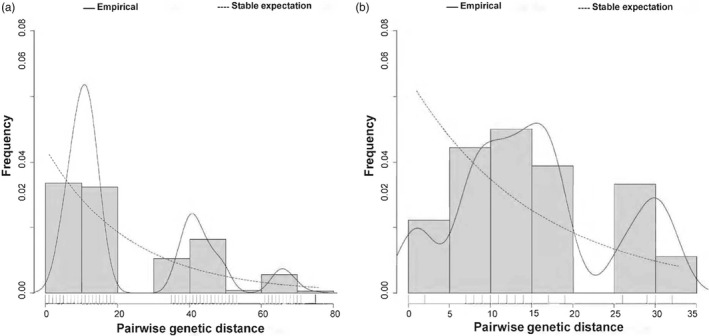
Ticks are the second most important vector capable of transmitting diseases affecting the health of both humans and animals. Amblyomma testudinarium Koch 1844 (Acari: Ixodidae), is a hard tick species having a wide geographic distribution in Asia. In this study, we analyzed the composition of A. testudinarium whole mitogenomes from various geographical regions in Japan and investigated the population structure, demographic patterns, and phylogeographic relationship with other ixodid species. In addition, we characterized a potentially novel tick species closely related to A. testudinarium from Myanmar. Phylogeographic inference and evolutionary dynamics based on the 15 mitochondrial coding genes supported that A. testudinarium population in Japan is resolved into a star-like haplogroup and suggested a distinct population structure of A. testudinarium from Amami island in Kyushu region. Correlation analysis using Mantel test statistics showed that no significant correlation was observed between the genetic and geographic distances calculated between the A. testudinarium population from different localities in Japan. Finally, demographic analyses, including mismatch analysis and Tajima's D test, suggested a possibility of recent population expansion occurred within Japanese haplogroup after a bottleneck event. Although A. testudinarium has been considered widespread and common in East and Southeast Asia, the current study suggested that potentially several cryptic Amblyomma spp. closely related to A. testudinarium are present in Asia.

Keywords: Amblyomma; cryptic species; mitogenome; phylogeography; population expansion; ticks.


Conflict of interest statement

The authors have no competing interests to declare.

Figures

FIGURE 1
FIGURE 1
Geographic distribution of Amblyomma samples used in the present study. Sample collection sites are illustrated in dots. Samples were collected from eleven prefectures in four geographical blocks in Japan. In each prefecture, samples were collected at least from two different collection sites except for Nagasaki where only one site was explored
FIGURE 2
FIGURE 2
Maximum‐likelihood trees based on the mitochondrial (a) 16S rDNA and (b) COI gene. Labels in green, brown, and red indicate the sequences from Taiwan, Thailand, and China, respectively. The clade containing sequences from Japan and Taiwan is highlighted in cyan and the clade highlighted in orange represents the clade containing sequences from Myanmar. Abbreviations in the sample name refers to the country/continent of origin; AU, Australia; BR, Brazil; CN, China; JP, Japan; MY, Myanmar; NZ, New Zealand; TH, Thailand; TW, Taiwan; RO, Romania; US, USA. Bootstrap values above 70% are indicated by percentages
FIGURE 3
FIGURE 3
Genetic diversity and phylogenetic relationships among Amblyomma testudinarium from Japan and Amblyomma sp. from Myanmar. (a) Bayesian phylogenetic Maximum Clade Credibility (MCC) tree based on the 15 concatenated mitochondrial gene sequences. The tree was rooted to Bothriocroton undatum (accession number: JN863728). Clades of the specimen from Japan and Myanmar are heighted in cyan and orange, respectively. Branch colors represent sampling geographic origin of each sequence. (b) The nucleotide differences between 39 new mitogenome sequences of Amblyomma collected from different localities in Japan and Myanmar. Locations of single nucleotide variations are indicated as vertical lines in mitogenome sequences relative to the mitogenome sequence of A. testudinarium Nara strain (accession number: MT371798). Abbreviations in the sample names refer to the country of origin; AU, Australia; BR, Brazil; CN, China; JP, Japan; MY, Myanmar; NZ, New Zealand; RO, Romania; US, USA
FIGURE 4
FIGURE 4
Reduced‐median‐joining phylogenetic network of the 16 haplotypes identified based on the 16S rDNA sequences. Colors in the pie represent the geographical origin of each haplotype. Node size is proportional to the number of individuals
FIGURE 5
FIGURE 5
A maximum clade credibility (MCC) tree based on Bayesian approach. Tree branches are colored based on the geographic regions of sample collection sites. Tree was rooted to Amblyomma testudinarium (MT029329) and Amblyomma javanense (NC_043872) reported from China (branches are shown in bold)
FIGURE 6
FIGURE 6
Nonmetric multidimensional scaling (NMDS) ordination plot based on the distance matrix. Red, blue, and cyan ellipsoids represent the grouping of Amblyomma testudinarium from Amami, Miyazaki (two samples collected at site 2), and the remaining Japan localities, respectively
FIGURE 7
FIGURE 7
Scatter plot of genetic variation versus geographic distances in kilometer (km) between the four sampling regions in Japan. Regression line is overlayed
FIGURE 8
FIGURE 8
Mismatch distribution pattern for Amblyomma testudinarium from Japan and Amblyomma sp. from Myanmar based on the 15 concatenated mitochondrial gene sequences. (a) Mismatch distribution pattern for A. testudinarium sequences from Japan. (b) Mismatch distribution pattern for Amblyomma sp. sequences from Myanmar. The x‐axis shows the number of pairwise differences (genetic distance) between pairs of sequences and the y‐axis shows their frequency. Solid histograms illustrate the observed frequencies. Solid black line indicates the simulated mismatch distributions expected under demographic expansion and dotted black line indicates those expected under spatial expansion

Similar articles

Cited by

References

    1. Aguilar‐Dominguez, M. , Romero‐Salas, D. , Sanchez‐Montes, S. , Serna‐Lagunes, R. , Rosas‐Saito, G. , Cruz‐Romero, A. , & de Leon, A. P. A. (2021). Morphometrics of Amblyomma mixtum in the State of Veracruz, Mexico. Pathogens, 10(5), 533. - PMC - PubMed
    1. Al‐Khafaji, A. M. , Clegg, S. R. , Pinder, A. C. , Luu, L. , Hansford, K. M. , Seelig, F. , Dinnis, R. E. , Margos, G. , Medlock, J. M. , Feil, E. J. , Darby, A. C. , McGarry, J. W. , Gilbert, L. , Plantard, O. , Sassera, D. , & Makepeace, B. L. (2019). Multi‐locus sequence typing of Ixodes ricinus and its symbiont Candidatus Midichloria mitochondrii across Europe reveals evidence of local co‐cladogenesis in Scotland. Ticks and Tick‐borne Diseases, 10(1), 52–62. - PubMed
    1. Amzati, G. S. , Pelle, R. , Muhigwa, J.‐B. B. , Kanduma, E. G. , Djikeng, A. , Madder, M. , Kirschvink, N. , & Marcotty, T. (2018). Mitochondrial phylogeography and population structure of the cattle tick Rhipicephalus appendiculatus in the African Great Lakes region. Parasites & Vectors, 11(1), 329. - PMC - PubMed
    1. Bandelt, H. J. , Forster, P. , & Rohl, A. (1999). Median‐joining networks for inferring intraspecific phylogenies. Molecular Biology and Evolution Molecular Biology and Evolution, 16(1), 37–48. - PubMed
    1. Barker, S. C. , & Burger, T. D. (2018). Two new genera of hard ticks, Robertsicus n. gen. and Archaeocroton n. gen., and the solution to the mystery of Hoogstraal’s and Kaufman’s “primitive” tick from the Carpathian Mountains. Zootaxa, 4500(4), 543–552. - PubMed

LinkOut - more resources