

ZAKβ is activated by cellular compression and mediates contraction-induced MAP kinase signaling in skeletal muscle
- PMID: 35899396
- PMCID: PMC9434084
- DOI: 10.15252/embj.2022111650
ZAKβ is activated by cellular compression and mediates contraction-induced MAP kinase signaling in skeletal muscle
Abstract
Mechanical inputs give rise to p38 and JNK activation, which mediate adaptive physiological responses in various tissues. In skeletal muscle, contraction-induced p38 and JNK signaling ensure adaptation to exercise, muscle repair, and hypertrophy. However, the mechanisms by which muscle fibers sense mechanical load to activate this signaling have remained elusive. Here, we show that the upstream MAP3K ZAKβ is activated by cellular compression induced by osmotic shock and cyclic compression in vitro, and muscle contraction in vivo. This function relies on ZAKβ's ability to recognize stress fibers in cells and Z-discs in muscle fibers when mechanically perturbed. Consequently, ZAK-deficient mice present with skeletal muscle defects characterized by fibers with centralized nuclei and progressive adaptation towards a slower myosin profile. Our results highlight how cells in general respond to mechanical compressive load and how mechanical forces generated during muscle contraction are translated into MAP kinase signaling.
Keywords: ZAKβ; mechanobiology; muscle contraction; myopathy.
© 2022 The Authors. Published under the terms of the CC BY NC ND 4.0 license.
Figures
- A
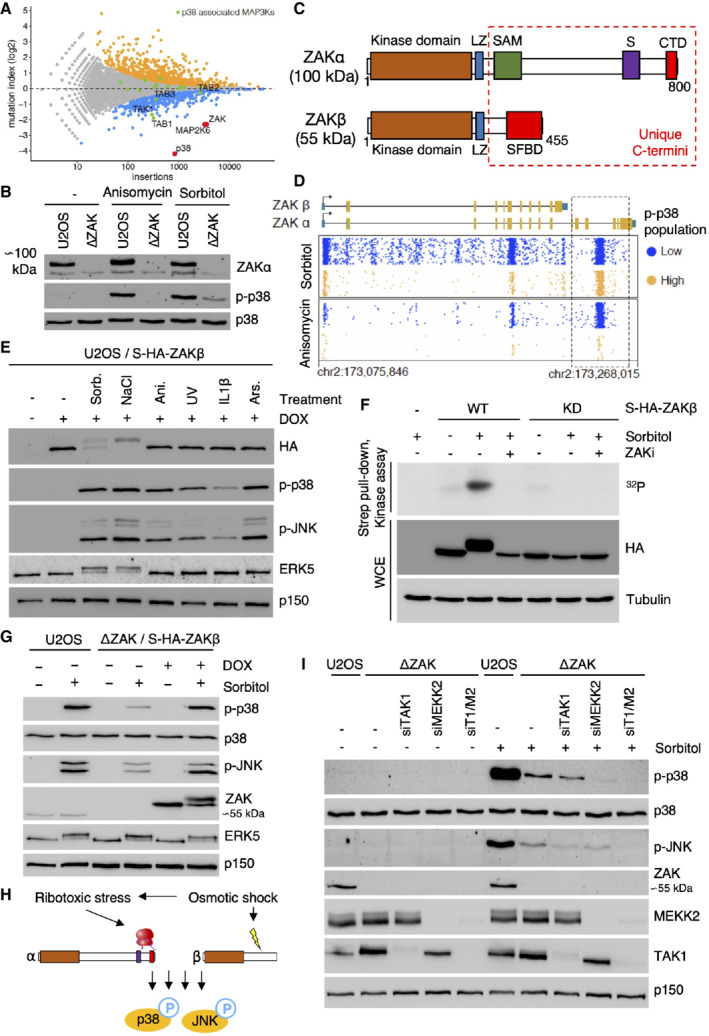
Gene‐trap‐based genetic screen in haploid human cells for regulators of p38 kinase activation (p38 Thr180/Tyr182 phosphorylation) in response to hyperosmotic shock (500 mM Sorbitol, 1 h). Per gene (dots), the frequency of gene‐trap insertions in the “high” phospho‐p38 population divided by the frequency of insertions in the “low” population is plotted as mutation index (y‐axis) against the total number of insertions assigned to the gene (x‐axis). Significant negative and positive regulators are colored in orange and blue, respectively (two‐sided Fisher's exact test, false discovery rate‐corrected, P ≤ 0.05).
- B
Human U2OS cells and cells deleted for ZAK (ΔZAK) were treated with anisomycin (1 h) or 500 mM sorbitol (1 h). Lysates were analyzed by immunoblotting as indicated.
- C
Schematic of ZAK protein isoforms. LZ—leucine zipper; SAM—sterile alpha‐motif; S—sensor domain; CTD—C‐terminal domain; SFBD—stress fiber‐binding domain.
- D
Unique gene‐trap insertions (dots) mapped to the genomic ZAK locus (x‐axis) identified in the low (blue) and high (orange) channels of two individual haploid genetic screens for stress‐induced p38 activation (Sorbitol (Fig 1A) and Anisomycin; Brockmann et al, 2017). The total number of identified insertions was similar for each channel within the individual screens. For visual purposes, insertion dots were spread on the y‐axis, and exons in the ZAK gene body schematic have been scaled up (compared with introns).
- E
U2OS/S‐HA‐ZAKβ cells were induced for expression with doxycycline (DOX) and subjected to the indicated drugs and treatments (1 h). Lysates were analyzed by immunoblotting with the indicated antibodies. Sorb.—sorbitol; Ani.—anisomycin; Ars.—arsenite.
- F
U2OS cells stably expressing WT and kinase‐dead (KD) versions of S‐HA‐ZAKβ were pretreated with ZAK inhibitor (ZAKi ‐ 0.5 h) and 500 mM sorbitol (1 h) as indicated. Whole‐cell extracts (WCE) were analyzed by immunoblotting, and strep‐pull‐down material was used in a kinase assay, separated by SDS–PAGE and analyzed by autoradiography.
- G
U2OS and ΔZAK cells rescued with S‐HA‐ZAKβ, were DOX‐induced, and treated with 500 mM sorbitol (1 h) as indicated. Lysates were analyzed by immunoblotting with the indicated antibodies.
- H
Osmotic shock activates p38 both via a ZAKα‐dependent ribotoxic stress response and a previously uncharacterized ZAKβ‐dependent stress response.
- I
U2OS and ΔZAK cells were transfected with the indicated siRNAs and treated with sorbitol (500 mM, 1 h) as indicated. Lysates were analyzed by immunoblotting with the indicated antibodies. T1—TAK1; M2—MEKK2.
- A
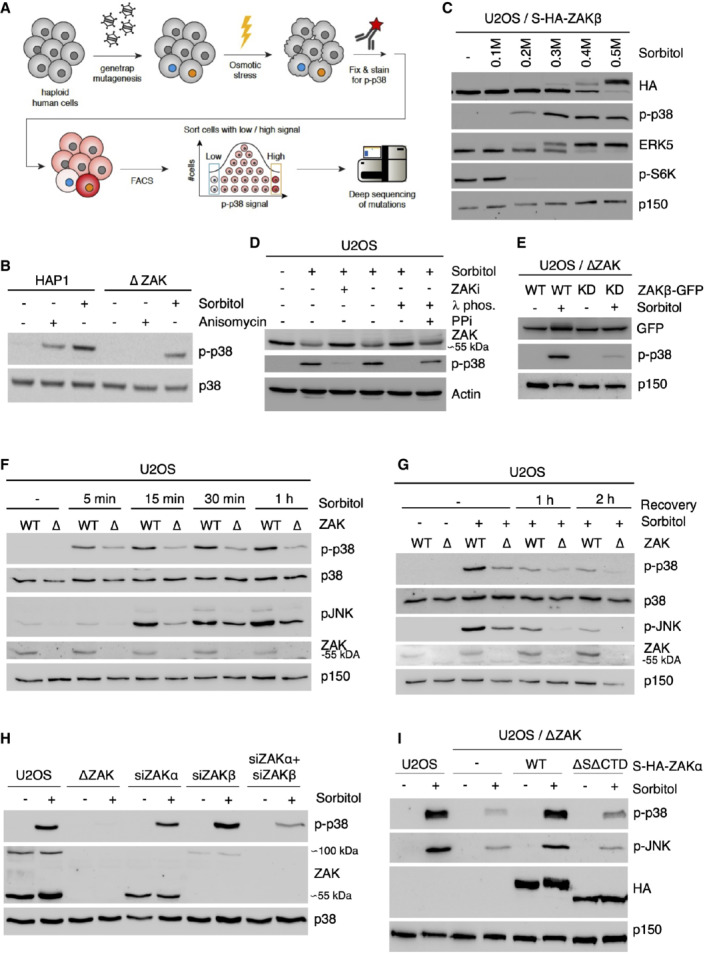
Schematic of the haploid genetic screen workflow to map genetic regulators of p38 activation in response to osmotic shock.
- B
HAP1 cells and cells deleted for ZAK (ΔZAK) were treated with anisomycin (1 h) or 500 mM sorbitol (1 h). Lysates were analyzed by immunoblotting with the indicated antibodies.
- C
U2OS cells stably expressing S‐HA‐ZAKβ were treated with increasing concentrations of sorbitol (1 h). Lysates were analyzed as in (B).
- D
U2OS cells were pretreated with ZAK inhibitor (ZAKi, 0.5 h) and treated with sorbitol (500 mM, 1 h). Lysates were treated with lambda phosphatase (λ phos.) and phosphatase inhibitor (PPi) as indicated and analyzed as in (B).
- E
U2OS ΔZAK cells stably expressing wildtype (WT) or kinase‐dead (KD) ZAKβ‐GFP were treated with sorbitol (500 mM, 1 h) as indicated. Lysates were analyzed as in (B).
- F
U2OS and ΔZAK cells were treated with sorbitol (500 mM) for the indicated time points and analyzed as in (B).
- G
U2OS and ΔZAK cells were treated with sorbitol (500 mM), washed out for sorbitol, and allowed to recover for the indicated time points. Lysates were analyzed as in (B).
- H
U2OS and ΔZAK cells were transfected with siRNAs and treated with sorbitol (500 mM, 1 h) as indicated. Lysates were analyzed as in (B).
- I
U2OS, ΔZAK, and ΔZAK cells rescued with wildtype (WT) or ribosome‐binding deficient (ΔSΔCTD) S‐HA‐ZAKα constructs were treated with sorbitol (500 mM, 1 h) as indicated. Lysates were analyzed as in (B).
- A
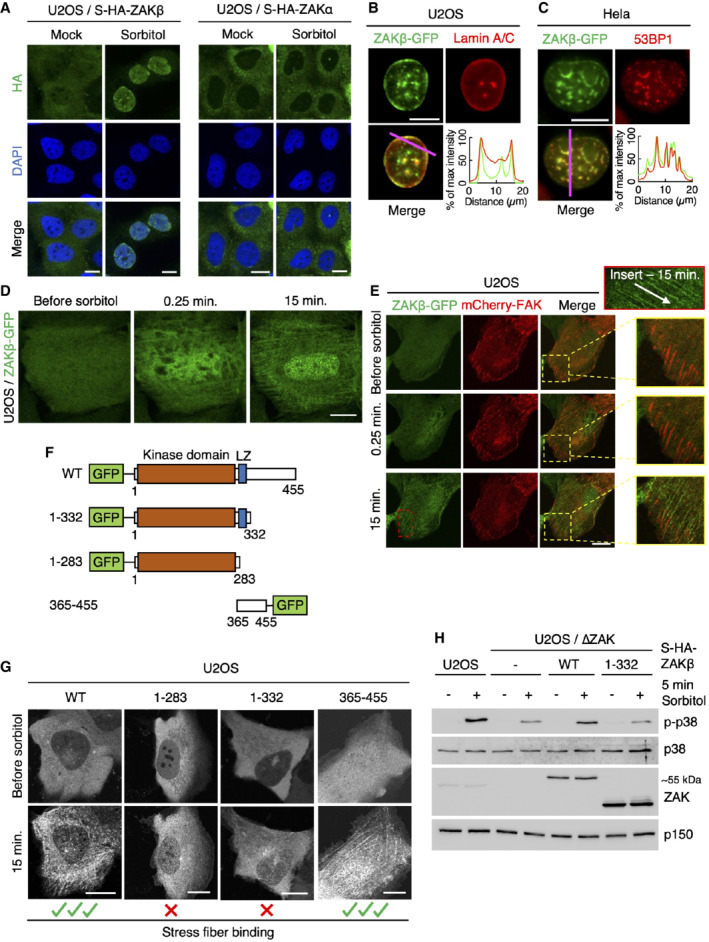
U2OS cells stably expressing Strep‐HA‐ZAKβ or ‐ZAKα were treated with sorbitol (500 mM, 1 h) as indicated. Cells were fixed, immunostained with HA antibody, and counterstained with DAPI.
- B
U2OS cells stably expressing ZAKβ‐GFP were treated with sorbitol (500 mM, 1 h), pre‐extracted, fixed, and immunostained with Lamin A/C antibody. Lower right: Intensity distribution graph showing fluorescence intensities along the magenta line.
- C
As in (B) except that Hela cells were transfected with ZAKbeta‐GFP and immunostained with 53BP1 antibody.
- D
Cells from (B) were imaged by live‐cell fluorescence microscopy. Sorbitol (final concentration 500 mM) was added after the acquisition of the first frame.
- E
As in (D), except that cells were co‐transfected with mCherry‐FAK. Inserts show higher magnification of the yellow and red regions, white arrow indicates the direction of stress fibers.
- F
Schematic of GFP‐tagged ZAKβ truncation constructs.
- G
U2OS cells were transfected with constructs from (F) and imaged by live‐cell fluorescence microscopy. Sorbitol (final concentration 500 mM) was added after the acquisition of the first frame.
- H
U2OS and ΔZAK cells stably expressing the indicated Strep‐HA‐tagged ZAKβ constructs were treated with sorbitol (500 mM, 5 min). Lysates were analyzed by immunoblotting with the indicated antibodies.
- A
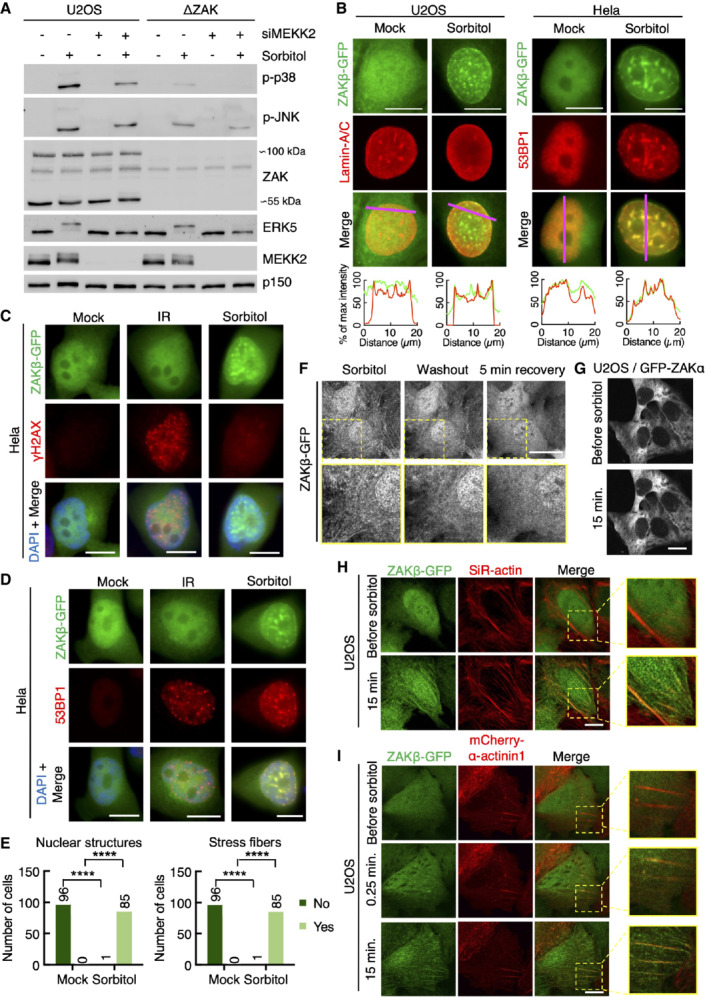
U2OS and ΔZAK cells were transfected with MEKK2 siRNA and treated with sorbitol (500 mM, 1 h) as indicated. Lysates were analyzed by immunoblotting with the indicated antibodies.
- B
Left: U2OS cells stably expressing ZAKβ‐GFP were treated with sorbitol (500 mM, 1 h). Cells were fixed and immunostained with Lamin A/C antibody. Right: Same as left except that Hela cells transiently expressing ZAKβ‐GFP were immunostained with 53BP1 antibody. Lower panel: Intensity distribution graphs showing fluorescence intensities along the magenta lines.
- C
Hela cells transfected with ZAKβ‐GFP were treated with sorbitol (500 mM, 1 h) or exposed to ionizing radiation (IR, 4 Gy – 1 h). Cells were fixed and immunostained with γH2AX antibody and counterstained with DAPI.
- D
As in (C) but immunostained with 53BP1 antibody.
- E
Quantification of cells from (Fig 2D) with nuclear structure‐ and/or stress fiber‐localized ZAKβ. ****P < 0.0001 in the Fisher's exact test.
- F
U2OS cells stably expressing ZAKβ‐GFP were imaged by live‐cell fluorescence microscopy. Cells were treated with sorbitol (500 mM, 15 min) before washout. Shown is the last frame before washout, the first frame after washout, and 5 min after washout.
- G
U2OS cells stably expressing GFP‐ZAKα were imaged by live‐cell fluorescence microscopy. Sorbitol (final concentration 500 mM) was added after the acquisition of the first frame.
- H
U2OS cells from (F) were treated with SiR‐actin for 15 min prior to sorbitol and imaged as in (G).
- I
Cells from (F) were co‐transfected with mCherry‐α‐actinin1 and imaged as in (G). Inserts show higher magnification of the yellow regions.
- A
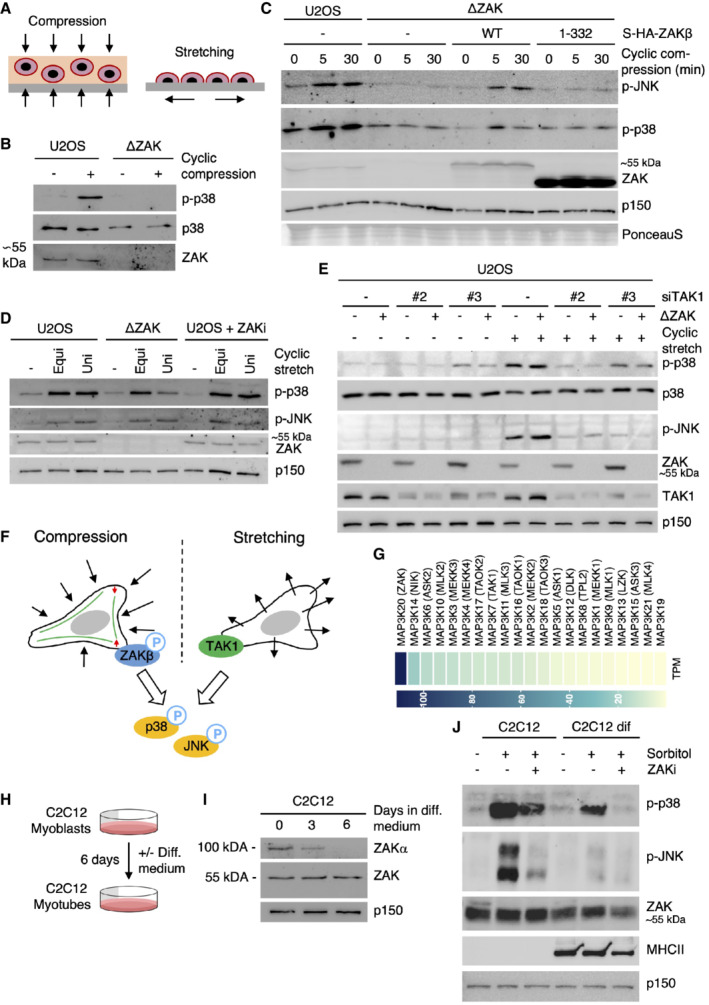
Schematic of mechanical perturbation of cells by compression and stretching.
- B
U2OS and ΔZAK cells were embedded in agarose and subjected to cyclic compression (0.5 h). Lysates were analyzed by immunoblotting with the indicated antibodies.
- C
U2OS and ΔZAK cells stably expressing the indicated Strep‐HA‐tagged ZAKβ constructs were embedded in agarose and subjected to cyclic compression for 5 or 30 min. Lysates were analyzed as in (B).
- D
U2OS and ΔZAK cells were pretreated with ZAK inhibitor (ZAKi) for 30 min and subjected to equibiaxial (Equi) or uniaxial (Uni) cyclic stretch (0.5 h) as indicated. Lysates were analyzed as in (B).
- E
U2OS and ΔZAK cells were transfected with the indicated siRNAs and subjected to equibiaxial cyclic stretch (5 min) as indicated. Lysates were analyzed as in (B).
- F
Model of MAP3Ks involved in p38‐ and JNK‐activating signaling in mechanically stimulated cells. ZAKβ is activated upon compressive load (left), in a manner dependent on stress fiber binding. TAK1 is activated by cell stretching (right).
- G
Expression levels of MAP3 kinase genes in human skeletal muscle (GTEx Portal). TPM—transcripts per million.
- H
Murine C2C12 myoblasts can be differentiated into myotubes by incubation in a myotube differentiation (diff.) medium for 6 days.
- I
C2C12 cells were incubated in diff. Medium for 3 or 6 days. Lysates were analyzed for ZAK isoform expression by immunoblotting.
- J
C2C12 myoblasts and myotubes (6 d differentiation) were pretreated with ZAK inhibitor (ZAKi, 0.5 h) and treated with 500 mM sorbitol (1 h) as indicated. Lysates were analyzed by immunoblotting with the indicated antibodies.
- A
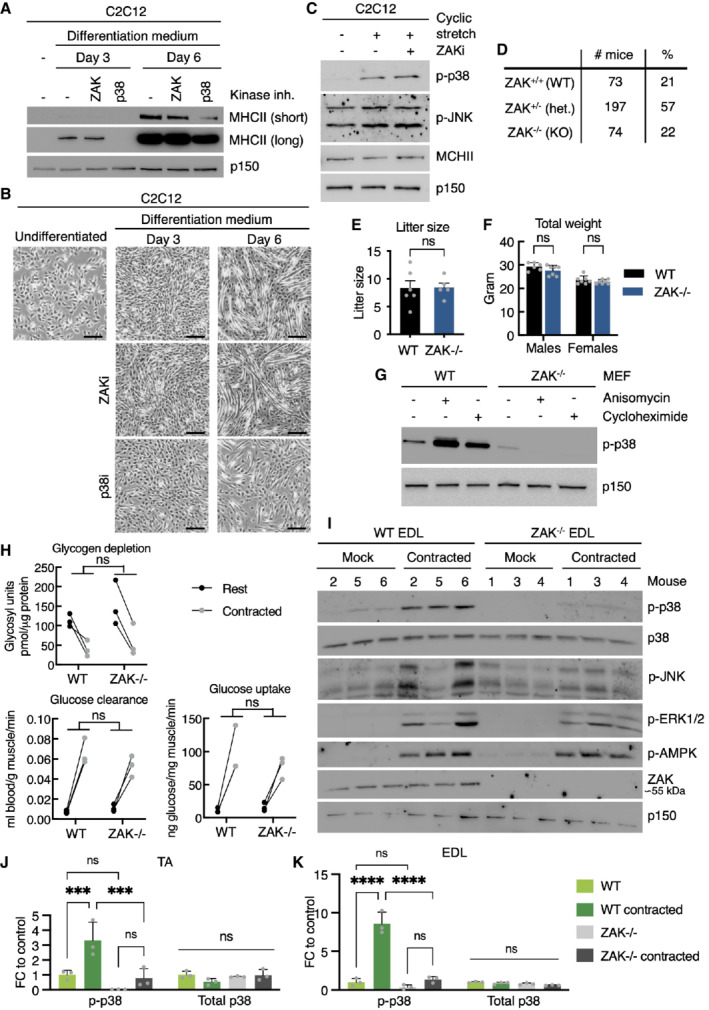
Murine C2C12 myoblasts were incubated in myotube differentiation medium with the indicated kinase inhibitors and harvested after 3 and 6 days. Lysates were analyzed by immunoblotting with the indicated antibodies.
- B
Images of cells from (A) before harvest. Scale bars, 100 μm.
- C
C2C12 myotubes (6 d differentiation) pretreated with ZAK inhibitor (ZAKi, 0.5 h) were subjected to equibiaxial cyclic stretch (5 min) as indicated. Lysates were analyzed in (A).
- D
Genotype frequencies for pups born from ZAK+/− intrabreedings.
- E
Litter sizes from WT and ZAK−/−intrabreedings. Error bars represent the standard deviations (n > 5 biological replicates). ns—not significant in unpaired t‐test.
- F
Weight of 16‐18‐week‐old WT and ZAK−/− male and female mice. Error bars represent the standard deviations (n > 6 biological replicates). ns, not significant in t‐test corrected for multiple comparison using the Bonferroni–Dunn method.
- G
Mouse embryonic fibroblasts (MEF) isolated from WT and ZAK−/− mice were treated with anisomycin (1 h) or cycloheximide (1 h) as indicated. Lysates were analyzed as in (A).
- H
Male mice from (F) were subjected to a retroorbital injection of [3H]‐2‐deoxyglucose followed by 10 min in situ contraction of the lower hindlimb. Upon euthanization, TA muscles were isolated, lysed, and analyzed for glucose uptake/clearance and glycogen content. ns, not significant in 2‐way ANOVA (n = 3 biological replicates).
- I
Anesthetized 16‐ to 18‐week‐old WT and ZAK−/− male mice were subjected to 10 min in situ contraction of the lower hindlimb. Extensor digitorum longus (EDL) muscles were isolated, lysed, and analyzed by immunoblotting with the indicated antibodies (n = 3 mice).
- J
Quantification of western blot results in Fig 4E. Error bars represent the standard deviations. ns—not significant, and ***P < 0.001 in 2‐way ANOVA with multiple comparison using the Tukey's method. FC, fold change (n = 3 biological replicates).
- K
Quantification of (I). Error bars represent the standard deviations. ns—not significant, and ****P < 0.0001 in 2‐way ANOVA with multiple comparison using the Tukey's method. FC—fold change (n = 3 biological replicates).
- A
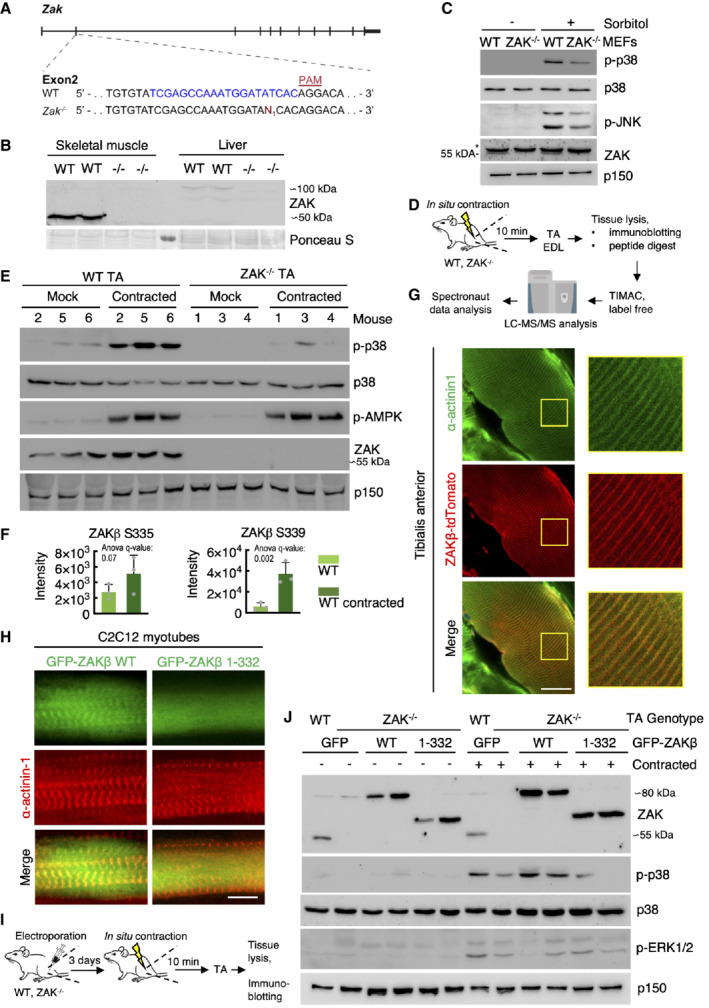
Genomic location of guide‐RNA sequence (blue) and a derived knockout allele in exon 2 of the murine ZAK gene. PAM—protospacer adjacent motif.
- B
Skeletal muscle (tibialis anterior, TA) and liver from WT and ZAK−/− mice were lysed and analyzed for ZAK isoform expression by immunoblotting. Ponceau staining of the membrane indicates equal loading.
- C
Mouse embryonic fibroblasts (MEF) isolated from WT and ZAK−/− mice were treated with 500 mM sorbitol (1 h). Lysates were analyzed by immunoblotting with the indicated antibodies. *—unspecific band.
- D
Schematic of in situ muscle contraction experiments. Mice were anesthetized, and one of the lower hindlimbs was subjected to electrically stimulated contraction (10 min.). Upon euthanization, tibialis anterior (TA) and extensor digitorum longus (EDL) muscles were isolated. Tissue homogenates were processed for immunoblotting (e) or proteins were subjected to trypsin digestion, phospho‐peptide enrichment, and label‐free quantification by mass spectrometry.
- E
16‐18‐week‐old WT and ZAK−/− male mice (n = 3 biological replicates) were subjected to the protocol in (D). TA lysates were analyzed by immunoblotting with the indicated antibodies.
- F
ZAKβ S335 and S339 phosphorylation sites upregulated in WT TA muscles from (D). Values indicate absolute phospho‐peptide abundances and error bars represent the standard deviation (n = 3 biological replicates).
- G
TA muscle in an 8‐week‐old WT male mouse was electroporated with a ZAKβ‐tdTomato construct. After 7 days the muscle was harvested, sectioned longitudinally, and immunostained with an antibody against the Z‐disc marker α‐actinin1. The right panel shows a higher magnification of the region highlighted in yellow.
- H
C2C12 cells were differentiated into myotubes for 14 days and transfected with the indicated GFP‐ZAKβ constructs. Cells were fixed and immunostained with an antibody against α‐actinin1.
- I
Schematic of electroporation rescue experiments. TA muscles were electroporated with GFP‐ZAKβ constructs. After 3 days the muscles were exposed to in situ contraction and processed for immunoblotting.
- J
16‐18‐week‐old WT and ZAK−/− male mice were subjected to the experimental protocol in (I). TA muscle lysates were analyzed by immunoblotting with the indicated antibodies.
- A
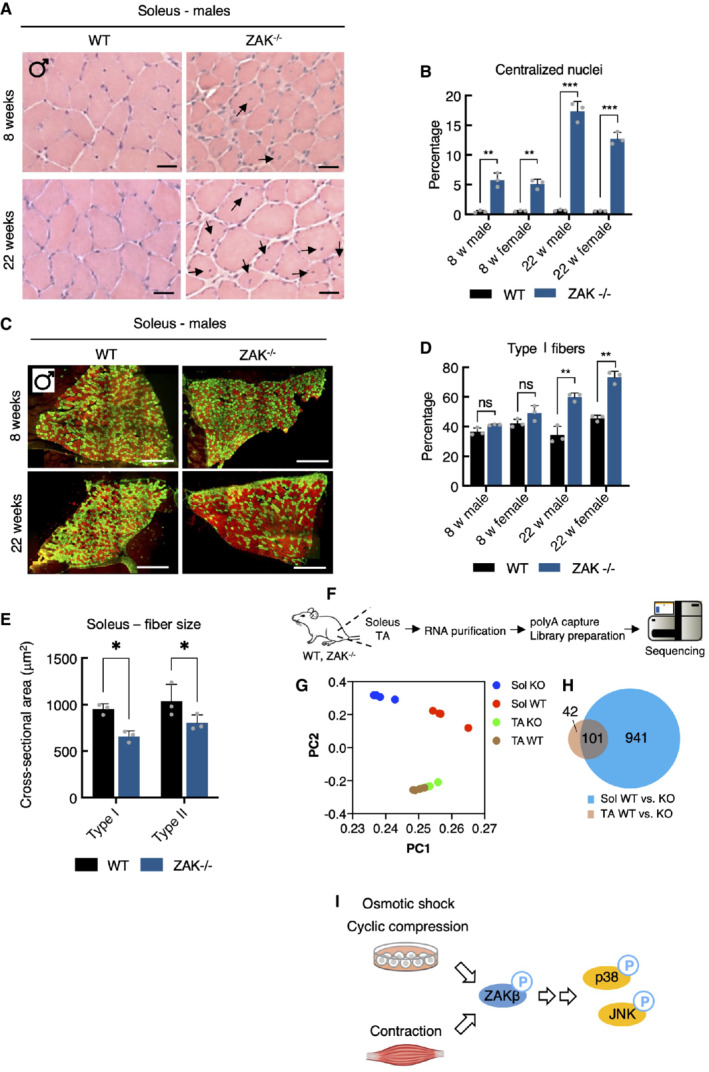
H&E staining of soleus muscle cross‐sections from 8‐ and 22‐week‐old WT and ZAK−/− male mice. Arrows indicate the presence of centralized nuclei. Scale bars, 50 μm.
- B
Quantification of (A). Values indicate the percentage of fibers displaying centralized nuclei and error bars represent the standard deviation (n = 3 biological replicates). **P < 0.01 and ***P < 0.001 in t‐test with the Bonferroni–Dunn correction for multiple comparison.
- C
Muscles from (A) were immunostained for type I (red) and type IIa (green) fibers using myosin isoform‐specific antibodies. Scale bars, 500 μm.
- D
Quantification of (C). Values indicate the percentage of fibers positive for type I myosin and error bars represent the standard deviation (n = 3 biological replicates). **P < 0.01 and ns, not significant in t‐test with the Bonferroni–Dunn correction for multiple comparison.
- E
Cross‐sectional area of type I and type IIa fibers in soleus from 8‐week‐old WT and ZAK−/− male mice. Values indicate the mean from one specimen and error bars represent the standard deviation (n = 3 biological replicates). *P < 0.05 in 2‐way ANOVA corrected for multiple comparison using FDR (Benjamini, Krieger, and Yekutieli).
- F
Schematic of muscle transcriptomic analysis. Soleus and TA muscles were isolated from 16‐18‐week‐old WT and ZAK−/− female mice (n = 4 biological replicates). Purified RNA was subjected to polyA capture and deep sequencing.
- G
Principal component analysis of the data obtained from (F).
- H
Venn diagram from (F) of the overlap of differentially expressed genes (DEG) in soleus (Sol, blue) and TA (brown).
- I
Mechanical perturbation of cells by osmotic shock, compression, and muscle contraction activates ZAKβ and downstream kinases p38 and JNK. These reactions are dependent on sensing of stress fiber/Z‐disc deformation by the ZAKβ SFBD domain.
- A
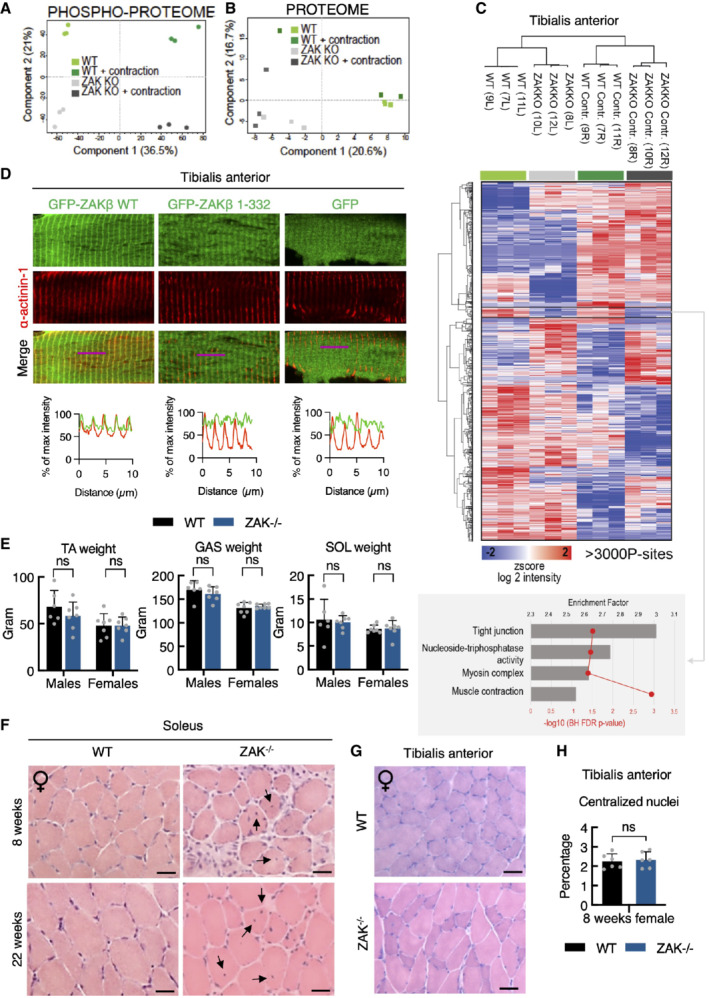
16‐18‐week‐old WT and ZAK−/− female mice (n = 3) were subjected to 10 min in situ contractions of the lower hindlimb. Tibialis anterior muscles were isolated and phospho‐ and total proteomes were recorded by mass spectrometry. Phospho‐proteomes were subjected to principal component analysis.
- B
As in (A), except that total proteomes were analyzed.
- C
Heatmap and clustering of significant phosphorylation changes from data in (A) analyzed by ANOVA. Numbers refer to the mouse‐ID. L—left; R—right. Buttom: GO‐term enrichment analysis for the cluster with phosphorylation sites showing ZAK‐dependent upregulation before and after contraction.
- D
TA muscles of 12‐week‐old WT male mice were electroporated with the indicated GFP constructs. After 7 days the muscle was harvested, sectioned longitudinally, and immunostained with an antibody against the Z‐disc marker α‐actinin1. Lower panel: Intensity distribution graphs showing fluorescence intensities along the magenta lines (10 μm).
- E
Tibialis anterior (TA), gastrocnemius (GAS), and soleus (SOL) muscles were isolated from 16‐18‐week‐old WT and ZAK−/− male and female mice. Values represent the weight of the muscle from one of the legs and error bars represent the standard deviations (n > 6 biological replicates). ns—not significant in t‐test corrected for multiple comparison using the Bonferroni–Dunn method.
- F
H&E staining of soleus muscle cross‐sections from 8‐ and 22‐week‐old WT and ZAK−/− female mice. Arrows indicate the presence of centralized nuclei.
- G
As in (F) except that TA muscles from 8‐week‐old female mice were analyzed.
- H
Quantification of (G). Values indicate the percentage of fibers displaying centralized nuclei and error bars represent the standard deviation (n = 6 biological replicates). ns, not significant in unpaired t‐test.
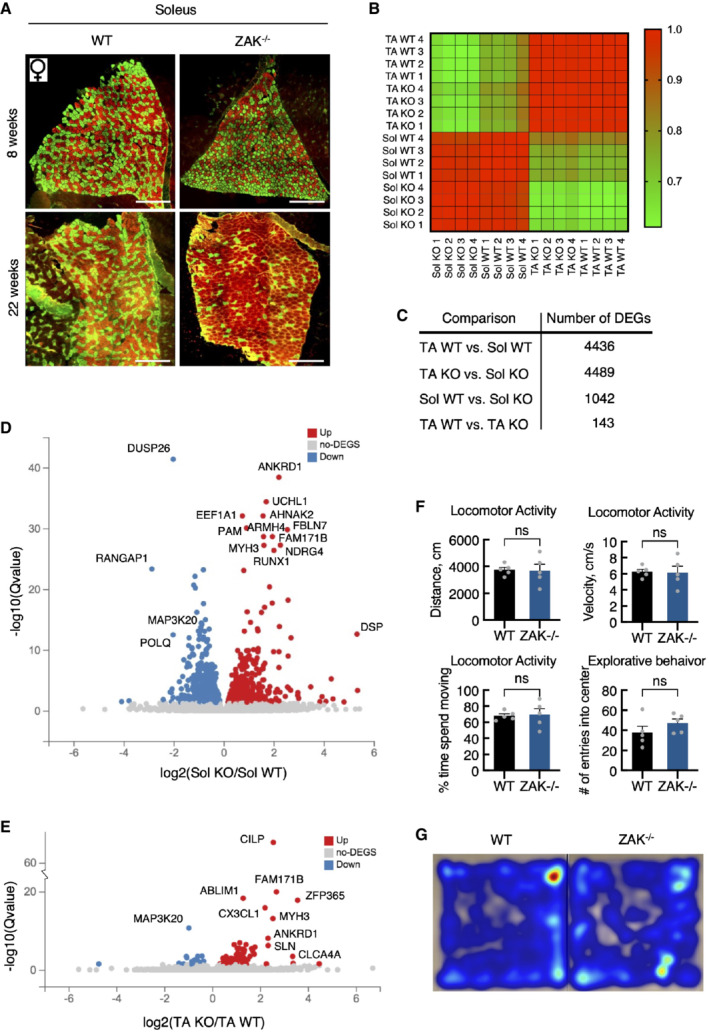
- A
Soleus muscle cross‐sections from 8‐ and 22‐week‐old WT and ZAK−/− female mice were immunostained for type I (red) and type IIa (green) fibers using myosin isoform‐specific antibodies. Scale bars, 500 μm.
- B
Correlation map of transcriptomes from all individual samples color‐coded according to the correlation coefficient.
- C
Number of differentially expressed genes (DEG) for the indicated group comparisons.
- D
Volcano plot of up‐ and downregulated DEGs in soleus muscle dependent on genotype.
- E
Volcano plot of up‐ and downregulated DEGs in TA.
- F
General locomotor activity of 16‐18‐week‐old WT and ZAK−/− male mice was evaluated using a standard open field test. No difference in distance traveled, velocity, time spent moving, or number of entries to the center zone was observed between the genotypes. Error bars represent the standard deviations (n = 5 biological replicates). ns—not significant in unpaired t‐test.
- G
Heat maps illustrating representative moving patterns. TA—tibialis anterior; Sol—soleus.
References
Publication types
MeSH terms
Substances
LinkOut - more resources
Full Text Sources
Molecular Biology Databases
Research Materials
