. 2022 Nov;11(11):1443-1457.
doi: 10.1002/psp4.12854. Epub 2022 Sep 7.

Optimization of trial duration to predict long-term HbA1c change with therapy: A pharmacometrics simulation-based evaluation

Affiliations

Optimization of trial duration to predict long-term HbA1c change with therapy: A pharmacometrics simulation-based evaluation

Hanna Kunina et al. CPT Pharmacometrics Syst Pharmacol. 2022 Nov.

Abstract

Glycated hemoglobin (HbA1c) is the main biomarker of diabetes drug development. However, because of its delayed turnover, trial duration is rarely shorter than 12 weeks, and being able to predict long-term HbA1c with precision using data from shorter studies would be beneficial. The feasibility of reducing study duration was therefore investigated in this study, assuming a model-based analysis. The aim was to investigate the predictive performance of 24- and 52-week extrapolations using data from up to 4, 6, 8 or 12 weeks, with six previously published pharmacometric models of HbA1c. Predictive performance was assessed through simulation-based dose-response predictions and model averaging (MA) with two hypothetical drugs. Results were consistent across the methods of assessment, with MA supporting the results derived from the model-based framework. The models using mean plasma glucose (MPG) or nonlinear fasting plasma glucose (FPG) effect, driving the HbA1c formation, showed good predictive performance despite a reduced study duration. The models, using the linear effect of FPG to drive the HbA1c formation, were sensitive to the limited amount of data in the shorter studies. The MA with bootstrap demonstrated strongly that a 4-week study duration is insufficient for precise predictions of all models. Our findings suggest that if data are analyzed with a pharmacometric model with MPG or FPG with a nonlinear effect to drive HbA1c formation, a study duration of 8 weeks is sufficient with maintained accuracy and precision of dose-response predictions.


Conflict of interest statement

Associate Professor Kjellsson and Mrs. Kunina received grants from Eli Lilly & Company during the conduct of the study. Dr. Chien and Dr. Garhyan are employees and stockholders of Eli Lilly & Company. All other authors declared no competing interests for this work.

Figures

FIGURE 1
FIGURE 1
Schematic representation of the models. In the developed Nathan model, the MPG from the ADOPT model was used. Red indicates inhibition, and green indicates stimulation. ADOPT, A Dynamic HbA1c Endpoint Prediction Tool; BCF, β cell function; f(G), indicates where glucose has an effect; f(IN), glycation of precursors of hemoglobin; FFH2, FSI‐FPG‐HbA1c; FFHSS, FSI‐FPG‐HbA1c with steady‐state solution; FHH, FPG‐Hb‐HbA1c; FPG, fasting plasma glucose; FSI, fasting serum insulin; Hb, hemoglobin; HbA1c, glycated hemoglobin; IGRH, Integrated Glucose‐RBC‐HbA1c; IS, insulin sensitivity effect; KG, glucose turnover; K in, input rate constant; Kout, output rate constant; Ktr, transit rate constant; L1, liraglutide‐similar drug effect on MPG/FPG; L2, liraglutide‐similar drug effect on postprandial glucose; LS, lifespan; M, metformin‐similar drug effect; MPG, mean plasma glucose; RBC, red blood cells.
FIGURE 2
FIGURE 2
The 24‐week individual extrapolations of change in HbA1c from the Nathan regression for the liraglutide‐ (top panels) and metformin‐similar drugs (bottom panels). The figure displays observed response (black) compared with extrapolated response using observed MPG (Approach i, gray) and model‐predicted MPG (Approach ii, blue) for different study durations (from left to right): 12, 8, 6, and 4 weeks. The lines represent medians, whereas the shaded areas (extrapolations) and error bars (observed) display the 90% range of individuals’ responses in the study. HbA1c, glycated hemoglobin; MPG, mean plasma glucose.
FIGURE 3
FIGURE 3
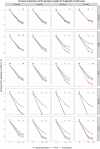
The 24‐week study extrapolations of change in HbA1c for different doses of the liraglutide‐similar drug with the dynamic models (top to bottom): ADOPT, IGRH, FHH, FFHSS, FFH2, and Nathan. The figure displays the observed response (black) compared with the extrapolated response from models relying on priors (red) and developed models (blue) for the study durations (left to right): 12, 8, 6, and 4 weeks. Statistically significant differences in responses between extrapolations from the developed models and observations are indicated with asterisks (* <0.05, ** <0.01, *** <0.001). The lines represent medians, whereas the shaded areas correspond to the 95% confidence intervals of the extrapolated responses in 100 studies. ADOPT, A Dynamic HbA1c Endpoint Prediction Tool; FFH2, FSI‐FPG‐HbA1c; FFHSS, FSI‐FPG‐HbA1c With Steady State; FHH, FPG‐Hb‐HbA1c; FPG, fasting plasma glucose; FSI, fasting serum insulin; Hb, hemoglobin; HbA1c, glycated hemoglobin; IGRH, Integrated Glucose‐RBC‐HbA1c; ns, not significant; RBC, red blood cells.
FIGURE 4
FIGURE 4
The 24‐week study extrapolations of change in HbA1c for different doses of the metformin‐similar drug with the dynamic models (top to bottom): ADOPT, IGRH, FHH, FFHSS, FFH2, and Nathan. The figure displays the observed response (black) compared with the extrapolated response from models relying on priors (red) and developed models (blue) for the study durations (left to right): 12, 8, 6, and 4 weeks. Statistically significant differences in responses between extrapolations from developed models and observations are indicated with asterisks (* <0.05, ** <0.01, *** <0.001). The lines represent medians while the shaded areas correspond to the 95% confidence intervals of the extrapolated responses in 100 studies. ADOPT, A Dynamic HbA1c Endpoint Prediction Tool; FFH2, FSI‐FPG‐HbA1c; FFHSS, FSI‐FPG‐HbA1c With Steady State; FHH, FPG‐Hb‐HbA1c; FPG, fasting plasma glucose; FSI, fasting serum insulin; Hb, hemoglobin; HbA1c, glycated hemoglobin; IGRH, Integrated Glucose‐RBC‐HbA1c; ns, not significant; RBC, red blood cells.
FIGURE 5
FIGURE 5
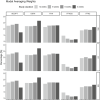
Model‐averaging weights (in percentages) per model (from left to right: ADOPT, IGRH, FHH, FHHSS, FFH2 12 ) from the model‐averaging approaches (from top to bottom: AIC, BS, CV) for different study durations (12, 8, 6, and 4 weeks of data). ADOPT, A Dynamic HbA1c Endpoint Prediction Tool; AIC, Akaike information criterion; BS, bootstrap; CV, cross‐validation; FFH2, FSI‐FPG‐HbA1c; FFHSS, FSI‐FPG‐HbA1c With Steady State; FHH, FPG‐Hb‐HbA1c; FPG, fasting plasma glucose; FSI, fasting serum insulin; Hb, hemoglobin; HbA1c, glycated hemoglobin; IGRH, Integrated Glucose‐RBC‐HbA1c; RBC, red blood cells.
FIGURE 6
FIGURE 6
The 24‐week study extrapolation of change in HbA1c for different doses of the (a) liraglutide‐ and (b) metformin‐similar drugs comparing observed responses (black) to MA (red) and the corresponding best model (blue), that is, ADOPT for 12, 8, and 6 weeks and IGRH for 4 weeks. The lines correspond to the medians, whereas the shaded areas correspond to the 95% confidence intervals of the extrapolated responses in 100 studies. ADOPT, A Dynamic HbA1c Endpoint Prediction Tool; AIC, Akaike information criterion; BS, bootstrap; CV, cross‐validation; HbA1c, glycated hemoglobin; IGRH, Integrated Glucose‐RBC‐HbA1c; MA, model averaging; RBC, red blood cells.

Similar articles

Cited by

References

    1. Zinman B, Wanner C, Lachin JM, et al. Empagliflozin, cardiovascular outcomes, and mortality in type 2 diabetes. N Engl J Med. 2015;373:2117‐2128. - PubMed
    1. Marso SP, Daniels GH, Brown‐Frandsen K, et al. Liraglutide and cardiovascular outcomes in type 2 diabetes. N Engl J Med. 2016;375:311‐322. - PMC - PubMed
    1. ClinicalTrials.gov [Internet]. Bethesda (MD): National Library of Medicine (US), National Center for Biomedical Information. [updated 2021 May]. Available: http://clinicaltrials.gov/. Accessed 13 Jul 2021.
    1. American Diabetes Association . Diagnosis and classification of diabetes mellitus. Diabetes Care. 2009;32(Suppl 1):S62‐S67. - PMC - PubMed
    1. Cersosimo E, Triplitt C, Solis‐Herrera C, et al. Pathogenesis of type 2 diabetes mellitus. [Updated 2018 Feb 27]. In: Feingold KR, Anawalt B, Boyce A, et al., eds. Endotext [Internet]. MDText.com, Inc.; 2000.

Publication types