. 2022 Sep 14;145(9):3288-3307.
doi: 10.1093/brain/awac222.

Astrocyte immunometabolic regulation of the tumour microenvironment drives glioblastoma pathogenicity

Affiliations

Astrocyte immunometabolic regulation of the tumour microenvironment drives glioblastoma pathogenicity

Rita Perelroizen et al. Brain. .

Abstract

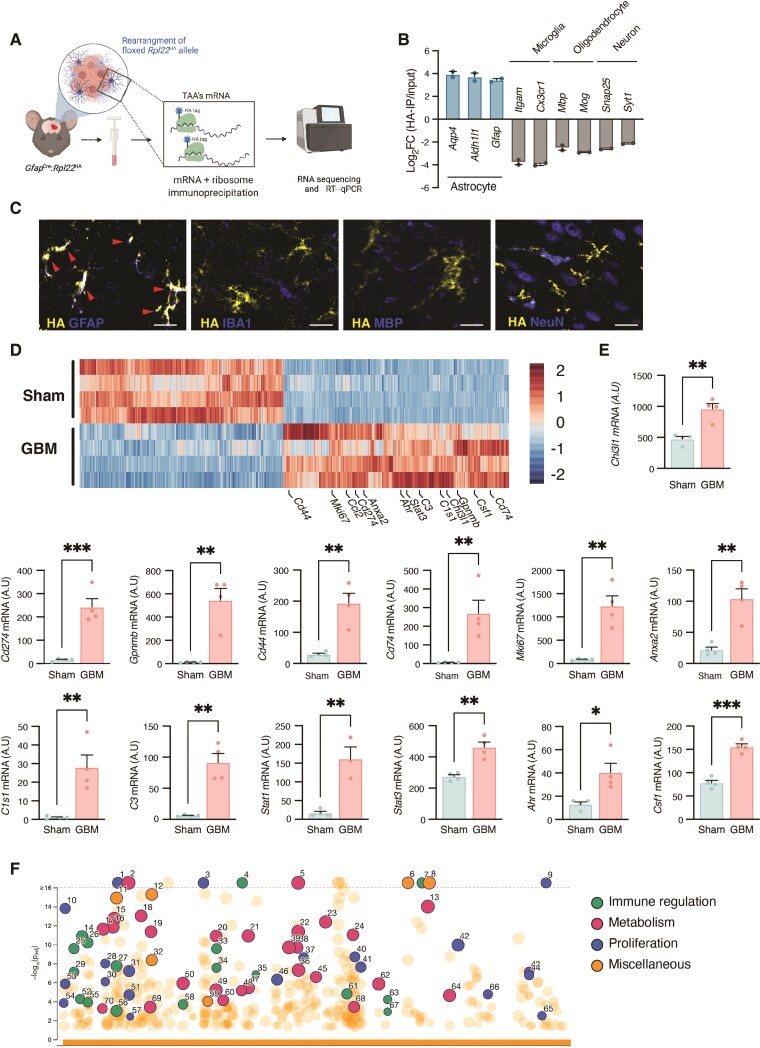
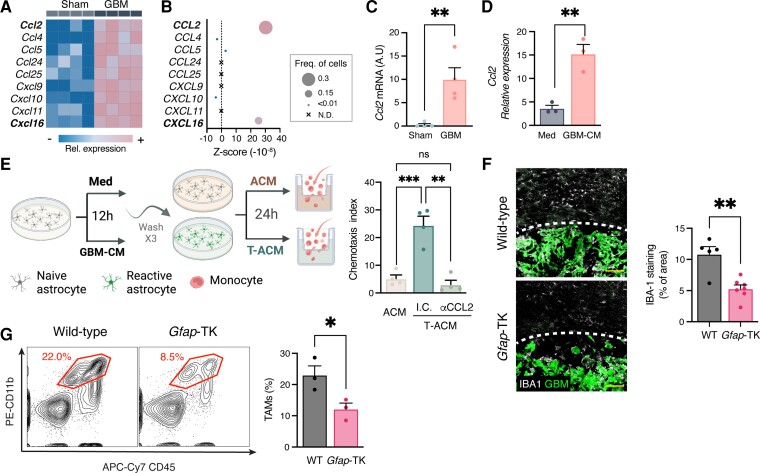
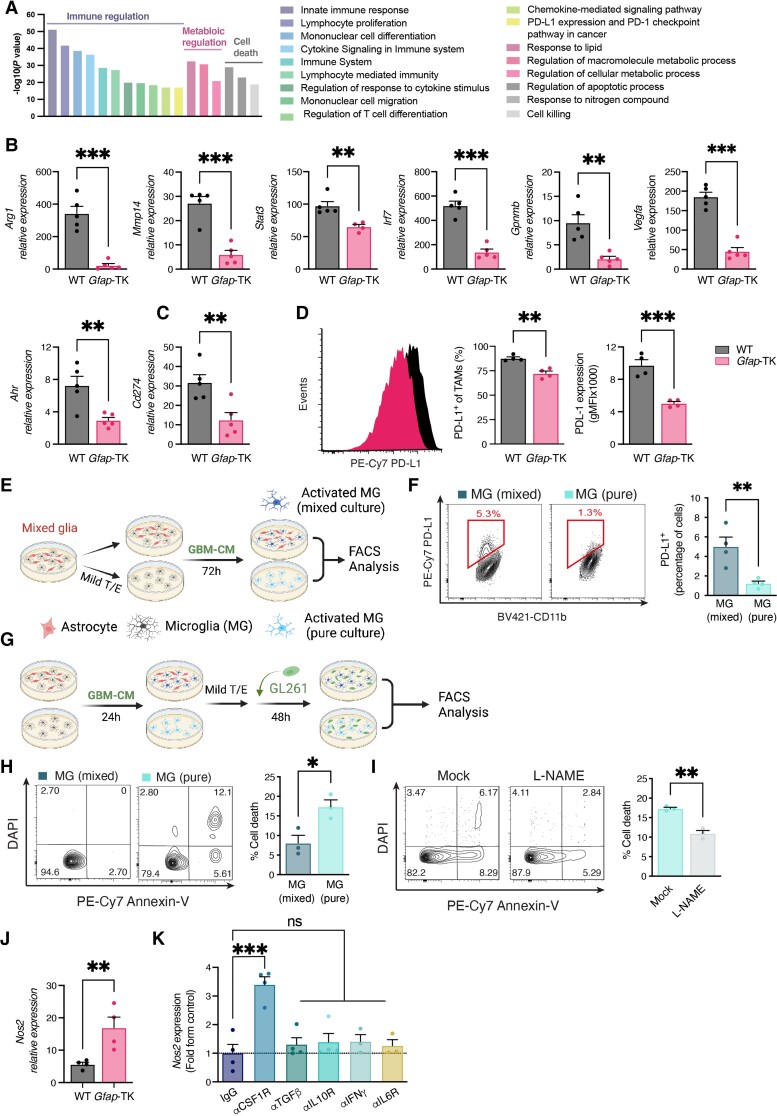
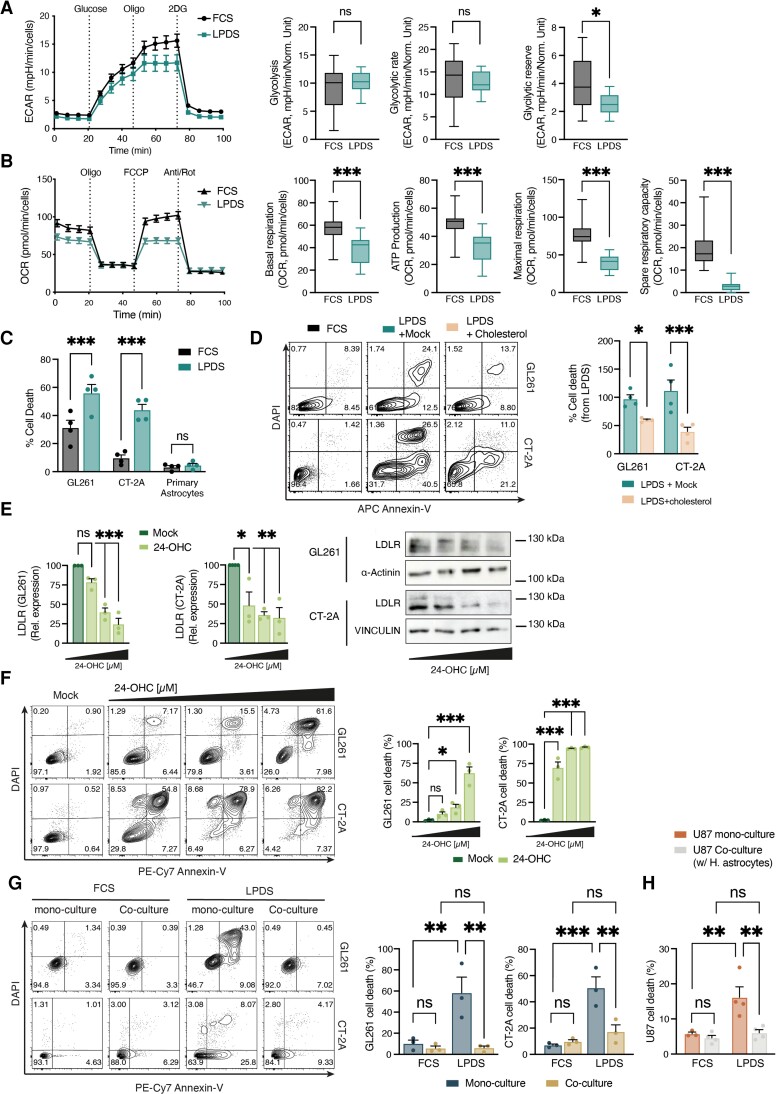
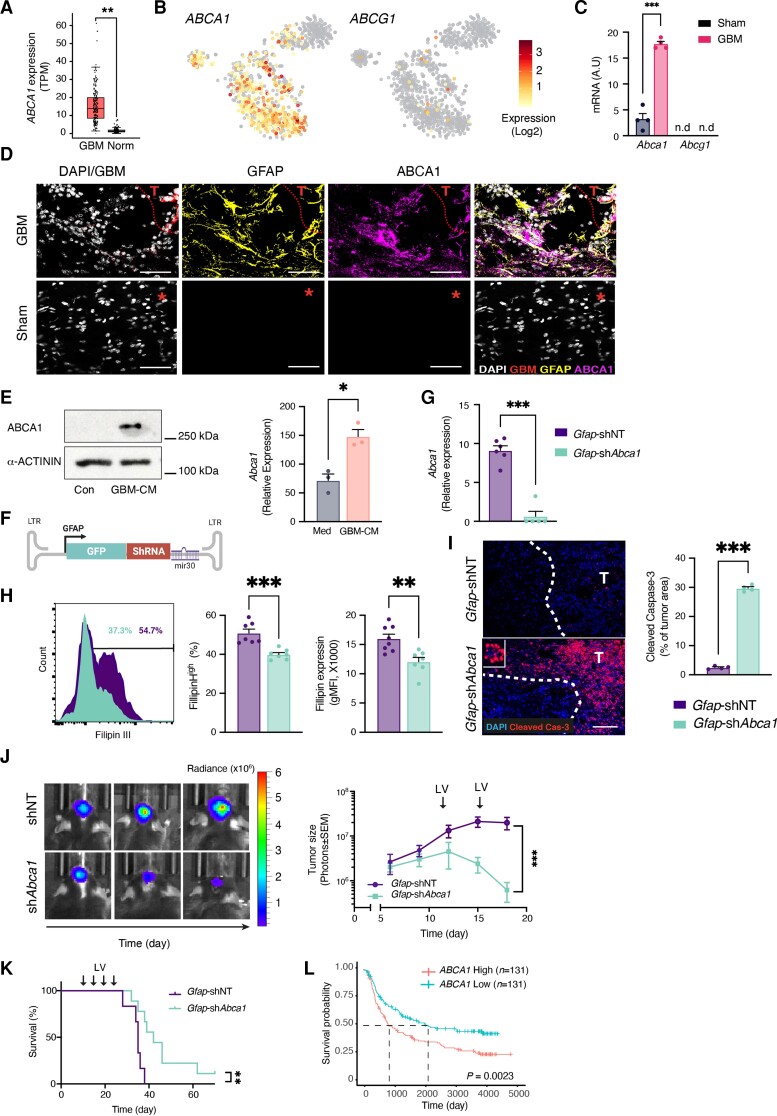
Malignant brain tumours are the cause of a disproportionate level of morbidity and mortality among cancer patients, an unfortunate statistic that has remained constant for decades. Despite considerable advances in the molecular characterization of these tumours, targeting the cancer cells has yet to produce significant advances in treatment. An alternative strategy is to target cells in the glioblastoma microenvironment, such as tumour-associated astrocytes. Astrocytes control multiple processes in health and disease, ranging from maintaining the brain's metabolic homeostasis, to modulating neuroinflammation. However, their role in glioblastoma pathogenicity is not well understood. Here we report that depletion of reactive astrocytes regresses glioblastoma and prolongs mouse survival. Analysis of the tumour-associated astrocyte translatome revealed astrocytes initiate transcriptional programmes that shape the immune and metabolic compartments in the glioma microenvironment. Specifically, their expression of CCL2 and CSF1 governs the recruitment of tumour-associated macrophages and promotes a pro-tumourigenic macrophage phenotype. Concomitantly, we demonstrate that astrocyte-derived cholesterol is key to glioma cell survival, and that targeting astrocytic cholesterol efflux, via ABCA1, halts tumour progression. In summary, astrocytes control glioblastoma pathogenicity by reprogramming the immunological properties of the tumour microenvironment and supporting the non-oncogenic metabolic dependency of glioblastoma on cholesterol. These findings suggest that targeting astrocyte immunometabolic signalling may be useful in treating this uniformly lethal brain tumour.

Keywords: astrocytes; cholesterol; glioma.


Conflict of interest statement

The authors report no competing interests.

Figures

Figure 1
Figure 1
TAA depletion regress GBM progression. (A) Representative immunofluorescence images of reactive TAAs stained for GFAP (cyan) crowning a glioblastoma (GBM) tumour (GFP+-GL261, white), and nuclei (DAPI, yellow). The right image is an expansion of the area marked by the white box. (n = 3 biologically independent experiments, three mice per group). Scale bar = 1000 μm. (BG) Wild-type (WT), or Gfap-TK GBM-bearing mice were treated daily with GCV (25 mg/kg) from Day 10 until the experimental end point as illustrated in B. (C) representative immunofluorescence images of reactive-astrocyte depletion at the tumour margins (GFP+-GL261, white), as detected by GFAP (cyan) and nuclei staining (DAPI, yellow). Scale bars = 500 μm. Data are representative of three independent experiments with n = 4 mice/group. (D and E) Tumour size in GCV-treated wild-type or Gfap-TK GBM-bearing littermates. (D) Representative images of GL261-derived bioluminescence from each group are shown on the left and quantification of tumour size on the right. Data are representative of five independent experiments with n = 6 mice/group. (E) Representative images from each group, 17 days after GL261 cell implantation, are shown on the left with quantification of tumour size on the right, tumour (GL261 cells in purple) and nuclei (DAPI; white). Scale bar = 1000 μm. Data are representative of three independent experiments with n = 5 mice/group. (F) Bodyweight assessment of mice from D. (G) Kaplan–Meier curves assessing overall survival. Data are representative of three independent experiments with n = 8 mice/group. Data in DF are shown as mean ± SEM. P-values were determined by two-way ANOVA (DF) or log rank (Mantel–Cox) test (G). *P < 0.05, **P < 0.01, ***P < 0.001, n.s. = not significant.
Figure 2
Figure 2
RiboTag analysis of TAAs reveals activation of immunoregulatory pathways and perturbation of metabolic circuits. (A) Illustration of the RiboTag workflow. (B) Enrichment of astrocyte-specific gene expression and de-enrichment of neuronal, oligodendroglial and TAMs gene expression, shown as the log fold change calculated between astrocyte RNAs immunoprecipitated by anti-HA antibody versus brain total cell RNAs from the original homogenate (including astrocytes). (C) Representative immunofluorescence images of GfapCRE:Rpl22HA mice demonstrating co-localization of ribosome-associated HA Tag (yellow) with specific cell-lineage markers of astrocytes, TAMs, oligodendrocytes or neurons cell-linage specific markers (GFAP, IBA1, MBP or NeuN, respectively; blue). Co-localization (white) is identified by red arrowheads. Scale bars = 20 μm. (D) Heat map of differently expressed genes (at least 2-fold, Padj < 0.01) of astrocytes derived from sham-injected or GBM-bearing brain hemisphere specimens. (E) RiboTag-isolated mRNA expression in astrocytes from GL261-bearing (GBM) or PBS-injected (Sham) GfapCre:Rpl22HA mice; 17 days after intracranial injection. Data are representative of three independent experiments with n = 4 biologically independent samples, pool of two mice per sample. (F) Manhattan plot of gene ontology (GO) of upregulated in TAAs. Similar pathways are colour-coded: Immune regulation (green), metabolism (pink), proliferation (blue), miscellaneous (orange). Highlighted GO are numbered and detailed in Supplementary Table 2. Data in B and E are shown as mean ± SEM. P-values were determined by one-way ANOVA (B) or two-sided Student’s t-tests (E). *P < 0.05, **P < 0.01, ***P < 0.001.
Figure 3
Figure 3
TAA depletion attenuates TAM recruitment. (AC) Chemokine expression in TAA. (A) Heat map of differently expressed chemokines (at least 2-fold, Padj < 0.01) (A) and Ccl2 mRNA expression (C) in astrocytes derived from sham-injected or GBM-bearing mice, as in Fig. 2E. Data are representative of three independent experiments with n = 4 biologically independent samples. (B) scRNAseq analysis of chemokine expression intensity (colour-coded), frequency (dot size) and Z-score in TAAs from GBM patients (astrocyte cluster as in Supplementary Fig. 2A). Expression levels (A and B) are defined by colour-coded expression as indicated (from blue to pink). (D) Primary astrocytes were stimulated with complete medium (Med) or GBM-CM from GL261 cells for 6 h. qPCR analysis of Ccl2 expression normalized to Ppia (n = 4 biologically independent experiments). (E) Astrocytes were stimulated with complete medium or GBM-CM for 12 h, extensively washed and used to prepare ACM or tumour cell-induced ACM (T-ACM), which was tested in an in vitro monocyte migration assay. (F and G) Analysis of TAMs in the TME. GFP+-GL261 glioma cells were intracranially injected into wild-type (WT) or Gfap-TK mice. Following tumour establishment (Day 9 after tumour implantation), mice were treated daily with GCV (as in Fig. 1); TAMs recruitment to the tumour was examined 17 days after tumour implantation. (F) Representative immunofluorescence images TAMs stained for IBA-1 (white) in the tumour (GBM, green) microenvironment (n = 2 biologically independent experiments, four mice per group). Scale bars = 100 μm. (G) Percentage of TAMs (CD11b+ CD45+) gated from GCV-treated GL261-bearing wild-type and Gfap-TK mice. Representative flow cytometry plots from each group are shown on the left and quantification analyses are on the right (n = 3 independent experiments, six mice per experiment). Data are shown as mean ± SEM. P-values were determined by one-way ANOVA, followed by Fisher’s LSD post hoc analysis (E) or two-sided Student’s t-tests (C, D, F and G). *P < 0.05, **P < 0.01, ***P < 0.001.
Figure 4
Figure 4
TAA ablation attenuates TAM activation. (AD) Functional analysis of TAMs (CD11b+CD45+) isolated from GCV-treated wild-type (WT) and Gfap-TK GL261-implanted mice (as in Fig. 3) 17 days after tumour implantation. (A) Pathway enrichment analysis of differentially expressed genes (at least 2-fold, Padj < 0.05) as detected by Nanostring (Supplementary Fig. 5A). (B and C) qPCR analysis of Arg1, Ahr, Stat3, Irf7, Gpnmb, Vegfa, Mmp14 and Cd274 expression in FACS-sorted TAMs; expression normalized to Ppia. Data are representative of three independent experiments (n = 4 biologically independent samples, pool of two mice per sample). (D) PD-L1 expression in TAMs. Representative flow cytometry plots from each group are shown on the left and quantification analyses of the percentage of PD-L1+ TAMs and PD-L1 expression (geometric mean fluorescence intensity, gMFI) is on the right. Data are representative of three independent experiments (n = 4 biologically independent samples, pool of two mice per sample). (E and F) Mixed glial cultures were treated with mild trypsin/EDTA to remove the astrocyte monolayer leaving only the microglia attached to the plate, or were left untreated. Cultures were then treated with GL261 conditioned media (GBM-CM) for 72 h. (F) Representative flow cytometry plots of microglial (gated as CD11b+ cells) PD-L1 expression from each group are shown on the left, and quantification analyses of the percentage of PD-L1+ microglial cells are on the right (n = 4 biologically independent experiments). (G) Mixed glia and microglial cultures were prepared as in E and treated with GBM-CM for 24 h. Microglial cultures were then isolated with mild trypsin/EDTA and co-cultured with GFP+-GL261 cells for 48 h. The viability of GFP-gated GL261 cells was then determined by Annexin-V assay. (H) Representative flow cytometry plots of GFP-gated GL261 cells from each group are shown on the left, and quantification analyses of cell death are on the right (n = 4 biologically independent experiments). (I) Microglial cultures were pretreated with L-NAME (2 mM) before co-incubation with GL261 cells, and glioma viability was analysed as in H. n = 3 biologically independent experiments. (J) qPCR analysis of Nos2 expression in FACS-sorted microglial cells (CD11b+CD45dim) isolated from GCV-treated wild-type and Gfap-TK GBM-bearing mice, as in Fig. 1; expression normalized to Ppia. Data are representative of three independent experiments (n = 3 biologically independent samples, pool of two mice per sample). (K) Mixed glial cells were treated with the indicated blocking antibodies or appropriate isotype controls (25 μg/ml), and then activated with GBM-CM. Microglia were isolated as in E, and microglial expression of Nos2 was determined by qPCR relative to Ppia (n = 5 biologically independent experiments). Data are shown as mean ± SEM. P-values were determined by two-sided Student’s t-tests (AJ) and one-way ANOVA, followed by Fisher’s LSD post hoc analysis (K) or *P < 0.05, **P < 0.01, ***P < 0.001; ns = not significant.
Figure 5
Figure 5
Astrocyte-derived cholesterol support glioma survival. (A and B) Real-time changes in the ECAR (A) and OCR (B) of GL261 glioma cells, cultured in media supplemented with full serum (FCS) or lipoprotein-deprived serum (LPDS) for 18 h and measured using Seahorse. Oligo = oligomycin; FCCP = carbonyl cyanide4-(trifluoromethoxy) phenylhydrazone; R/A = rotenone plus antimycin A; 2-DG = 2-deoxy-D-glucose. Glycolysis, glycolytic capacity and glycolytic reserve were extracted from the ECAR reading, and basal respiration, ATP production, maximal respiration and spare respiratory capacity were determined on the basis of OCR. Data are representative of two independent experiments (n = 6 technical replicates per experiment). (C) Percentage of cell death of GL261 and CT-2A glioma cells, or primary astrocytes, cultured in FCS or LPDS for 5 days; as determined by Annexin-V assay (n = 4 independent experiments). (D) GL261 or CT-2A glioma cells were cultured in FCS or LPDS-media and treated with PBS (Mock) or cholesterol (250 ng/ml) for 5 days. Representative flow cytometry plots of Annexin-V/DAPI staining from each group are shown on the left and quantification analyses of cholesterol rescue are on the right (n = 4 biologically independent experiments). (E and F) Representative images and quantification of LDLR expression (Immunoblot, E) and cell death via FACS analysis of Annexin-V/DAPI staining (F) in response to endogenous LXR agonists (24-OHC) or Mock (DMSO) treatment in GL261 and CT-2A cells. (n = 3 biologically independent experiments). (G and H) Analysis of LPDS-induced glioma cell death, in the presence of absence of primary astrocytes, by Annexin-V assay. (G) Representative flow cytometry plots of murine GL261 and CT-2A glioma cells co-cultured for 5 days with primary mouse astrocytes are shown on the left and quantification analyses on the right (n = 4 biologically independent experiments). (H) quantification analyses of human U87EGFRvIII (U87) glioma cells co-cultured with human primary astrocytes for 5 days (n = 3 biologically independent experiments). Data are shown as mean ± SEM. P-values were determined by two-sided Student’s t-tests (BD, G and H) or by two-way ANOVA (E and F). *P < 0.05, **P < 0.01, ***P < 0.001.
Figure 6
Figure 6
Astrocytic expression of ABCA1 regulates glioma cholesterol levels and tumour progression. (A) Box plot analysis of TCGA gene expression for ABCA1 in normal (Norm; n = 207) or GBM patients (n = 163). n represents the number of patients per group. (B) Heat map overly of the scRNAseq gene expression intensity of ABCA1, and ABCG1 in TAAs from GBM patients (astrocyte cluster as in Supplementary Fig. 3A). (C) qPCR analysis of Abca1 expression in Ribotag-isolated astrocytes GBM-bearing mice, as in Fig. 2. (D) Representative immunofluorescence images of sham-injected or GL261-bearing mice stained for ABCA1 (purple), GFAP (reactive astrocytes, yellow), GBM, (GFP+-GL261, red) and nuclei (DAPI, white); asterisk indicates the injection coordinates in sham, scale bars = 35 μm (n = 2 biologically independent experiments, four mice per group). (E) Representative immunoblot (left) and quantitative reverse transcription (right) analyses comparing ABCA1 levels in primary astrocytes treated with GBM-CM for 24 h (immunoblot) or 6 h (quantitative reverse transcription; expression normalized to Ppia) (n = 3 biologically independent experiments). (F) Schematic map of the astrocyte-specific shRNA lentiviral vector. (GK) Intracranially injection of astrocyte-specific shAbca1 lentivirus attenuates GBM progressions. Non-targeting (Gfap-shNT) or Abca1-targeting (Gfap-shAbca1) astrocyte-specific lentiviruses were injected into the TME of GL261-bearing mice every 5 days (as indicated) starting 9 days after tumour implantation. (G) Quantitative reverse transcription analysis of FACS-sorted GFP+-astrocytes for Abca1 on Day 18; expression normalized to Ppia. Data are representative of two independent experiments (n = 4 biologically independent samples). (H) Representative flow cytometry plots of Filipin III staining in tdTomato+-expression GL261 cells from each group are shown on the left and quantification analyses of the percentage of Filipin+ GL261 cells and filipin intensity (gMFI) are on the right. Data are representative of two independent experiments (n = 4 biologically independent samples per group). (I) Representative immunofluorescence images of cleaved caspase-3 (red) and nuclei (DAPI, blue) 10 days after lentivirus injection are shown on the left and quantification is on the right. T indicates the tumour. Data are representative of two independent experiments (n = 4 biologically independent samples per group). (J) Representative images of GL261-derived bioluminescence from each group are shown on the left and quantification of tumour size on the right. Data are representative of three independent experiments with n = 6 mice/group. (K) Kaplan–Meier curves assessing overall survival of these groups. Data are representative of two independent experiments with n = 6 mice/group. (L) Kaplan–Meier curves assess the overall survival of GBM patients on the basis of ABCA1 expression; n represents the number of patients per group. Data are shown as mean ± SEM. P-values were determined by two-sided Student’s t-tests (A, C, E, G, H and I), two-way ANOVA (J) or log rank (Mantel–Cox) test (K and L). *P < 0.05, **P < 0.01, ***P < 0.001. n.d. = not detected.

Comment in

References

    1. Quail DF, Joyce JA. Microenvironmental regulation of tumor progression and metastasis. Nat Med. 2013;19:1423–1437. - PMC - PubMed
    1. Bi J, Chowdhry S, Wu S, Zhang W, Masui K, Mischel PS. Altered cellular metabolism in gliomas—An emerging landscape of actionable co-dependency targets. Nat Rev Cancer. 2020;20:57–70. - PubMed
    1. Shi Y, Lim SK, Liang Q, et al. Gboxin is an oxidative phosphorylation inhibitor that targets glioblastoma. Nature. 2019;567:341–346. - PMC - PubMed
    1. Marin-Valencia I, Yang C, Mashimo T, et al. Analysis of tumor metabolism reveals mitochondrial glucose oxidation in genetically diverse human glioblastomas in the mouse brain in vivo. Cell Metab. 2012;15:827–837. - PMC - PubMed
    1. An Z, Weiss WA. Cholesterol: An Achilles’ heel for glioblastoma? Cancer Cell. 2016;30:653–654. - PubMed

Publication types