. 2022 Aug 12;254(3):153-167.
doi: 10.1530/JOE-22-0097. Print 2022 Sep 1.

Increased PHOSPHO1 expression mediates cortical bone mineral density in renal osteodystrophy

Affiliations

Increased PHOSPHO1 expression mediates cortical bone mineral density in renal osteodystrophy

Shun-Neng Hsu et al. J Endocrinol. .

Abstract

Patients with advanced chronic kidney disease (CKD) often present with skeletal abnormalities, a condition known as renal osteodystrophy (ROD). While tissue non-specific alkaline phosphatase (TNAP) and PHOSPHO1 are critical for bone mineralization, their role in the etiology of ROD is unclear. To address this, ROD was induced in both WT and Phospho1 knockout (P1KO) mice through dietary adenine supplementation. The mice presented with hyperphosphatemia, hyperparathyroidism, and elevated levels of FGF23 and bone turnover markers. In particular, we noted that in CKD mice, bone mineral density (BMD) was increased in cortical bone (P < 0.05) but decreased in trabecular bone (P < 0.05). These changes were accompanied by decreased TNAP (P < 0.01) and increased PHOSPHO1 (P < 0.001) expression in WT CKD bones. In P1KO CKD mice, the cortical BMD phenotype was rescued, suggesting that the increased cortical BMD of CKD mice was driven by increased PHOSPHO1 expression. Other structural parameters were also improved in P1KO CKD mice. We further investigated the driver of the mineralization defects, by studying the effects of FGF23, PTH, and phosphate administration on PHOSPHO1 and TNAP expression by primary murine osteoblasts. We found both PHOSPHO1 and TNAP expressions to be downregulated in response to phosphate and PTH. The in vitro data suggest that the TNAP reduction in CKD-MBD is driven by the hyperphosphatemia and/or hyperparathyroidism noted in these mice, while the higher PHOSPHO1 expression may be a compensatory mechanism. Increased PHOSPHO1 expression in ROD may contribute to the disordered skeletal mineralization characteristic of this progressive disorder.

Keywords: PHOSPHO1; TNAP; bone mineral density; bone mineralization; chronic kidney disease-mineral bone disorder; renal osteodystrophy.


Figures

Figure 1
Figure 1
Expression of osteoblast and mineralization markers in mouse femurs from CTL and CKD mice. (A) Expression of key mineralization and osteoblast marker genes in femurs of CTL and CKD mice at the end of the study (13 weeks of age). Of note, Fgf23 and Phospho1 expressions were increased and Alpl expression was decreased in the femurs of the CKD-MBD mice. (B) Representative image of 2 CTL and 2 CKD-MBD femurs analyzed by Western blot for PHOSPHO1 and TNAP expression. (C) Quantification of PHOSPHO1 and TNAP expression indicated that PHOSPHO1 was increased and TNAP was decreased in the femur of CKD-MBD mice compared with control mice. The data are represented as the mean ± s.e.m. (n  = 8); *P < 0.05; **P < 0.01; ***P < 0.001; ****P < 0.0001.
Figure 2
Figure 2
Micro-CT analysis of trabecular bone of the tibia. Micro-CT analysis of tibia from male C57BL/6 mice fed a CTL or CKD diet for 5 weeks. Tb. BMD (trabecular bone mineral density; g/cm3); Tb. BV/TV (trabecular bone volume/tissue volume; %); Tb. Th. (trabecular thickness; mm); SMI (structure model index); Tb. Conn Dn (trabecular connectivity density; mm−3) were all decreased in the CKD-MBD mice. Tb. N. (trabecular number; mm−1) was unchanged. Tibia of n  = 8 (CTL mice) vs n  = 8 (CKD-MBD mice) biological replicates was analyzed. The data are represented as the means ± s.e.m. *P < 0.05; **P < 0.01; ***P < 0.001 vs CTL.
Figure 3
Figure 3
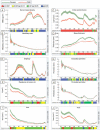
Micro-CT analysis of whole cortical bone of the tibia. Micro-CT analysis of tibia from male C57BL/6 mice fed a CTL or CKD diet for 5 weeks. Quantification of whole bone analyses of cortical bone between 10 and 90% of total tibial length, excluding proximal and distal metaphyseal bone, of CTL and CKD tibia at 13 weeks of age. (A) BMD (bone mineral density; g/cm3), (B) medullary area (cm2), and (G) endosteal perimeter (mm) were generally increased and (C) CSA (cross-sectional area; mm2), (D) mean thickness (mm), (F) resistance to torsion (J; mm4), (H) periosteal perimeter (mm), (I) Imin (mm4), and (J) Imax (mm4) were generally decreased in the CKD–MBD bones. Tibia of n  = 8 (CTL mice) vs n  = 8 (CKD mice) biological replicates was analysed. P < 0.05 was significant and P ≤ 0.01–0.05 was give in green, P ≤ 0.001–0.01 in yellow, and P ≤ 0.000–0.001 in red. Not significant is given in blue.
Figure 4
Figure 4
Micro-CT analysis of cortical bone of WT and PHOSPHO1-deficient CTL and CKD mice. Quantification of cortical bone mineral density (Ct. BMD), cortical bone volume/tissue volume (Ct. BV/TV), cortical cross-sectional area (Ct. CSA), cortical thickness (Ct. Th), and closed pore porosity (Ct Po (cl)) at 50% of the total tibial length from the top of the tibia. Of note, BMD was increased in the WT CKD-MBD tibia but not in the PHOSPHO1-deficient CKD–MBD tibia when compared to their respective controls. The data are represented as the mean ± s.e.m. (n  = 8); *P < 0.05; **P < 0.001; ****P < 0.0001 compared to WT CTL bones.
Figure 5
Figure 5
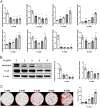
Regulation of key mineralization associated genes, proteins, and osteoblast extracellular matrix mineralization by Pi in primary osteoblasts. (A) Expression analysis of Phospho1, Alpl, Enpp1, Spp1, Slc20a1, Slc20a2, Bglap, and Runx2 by osteoblasts in response to Pi (1–5 mM), (B) Western blotting analysis and quantification of PHOSPHO1 and TNAP expression in response to Pi, and (C) representative images and quantification of alizarin red staining in response to Pi for 28 days after confluency. PHOSPHO1 and TNAP at the gene and protein level were decreased with increasing Pi concentrations, whereas matrix mineralization increased with increasing Pi concentrations. The data are represented as the mean ± s.e.m. (n  = 3); *P < 0.05; **P < 0.01; ***P < 0.001; ****P < 0.0001 compared to 1 mM Pi cultures.
Figure 6
Figure 6
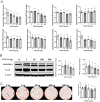
Regulation of key mineralization associated genes, proteins, and osteoblast extracellular matrix mineralization by PTH in primary osteoblasts. (A) Expression analysis of Phospho1, Alpl, Enpp1, Spp1, Slc20a1, Slc20a2, Bglap, and Runx2 by osteoblasts in response to PTH (0–50 nM), (B) Western blotting analysis and quantification of PHOSPHO1 and TNAP expressions in response to PTH, and (C) representative images and quantification of Alizarin red staining in response to PTH for 28 days after confluency. PHOSPHO1 and TNAP at the gene and protein level and matrix mineralization were all decreased with increasing Pi concentrations. The data are represented as the mean ± s.e.m. (n  = 3); *P < 0.05; **P < 0.01; ***P < 0.001; ****P < 0.0001 compared to 0 nM PTH cultures.
Figure 7
Figure 7
Regulation of key mineralization-associated genes, proteins, and osteoblast extracellular matrix mineralization by FGF23 in primary osteoblasts. (A) Expression analysis of Phospho1, Alpl, Enpp1, Spp1, Slc20a1, Slc20a2, Bglap, and Runx2 by osteoblasts in response to FGF23 (0–200 ng/mL), (B) Western blotting analysis and quantification of PHOSPHO1 and TNAP expressions in response to FGF23, and (C) representative images and quantification of Alizarin red staining in response to FGF23 for 28 days after confluency. Phospho1 and Alpl gene expressionS were decreased at the highest FGF23 concentrations, but non-significant differences were noted with PHOSPHO1 and TNAP expression and matrix mineralization. The data are represented as the mean ± s.e.m. (n  = 3); *P < 0.05; **P < 0.01; ***P < 0.001; ****P < 0.0001 compared to 0 nM FGF23 cultures.

References

    1. Bajwa NM, Sanchez CP, Lindsey RC, Watt H, Mohan S.2018Cortical and trabecular bone are equally affected in rats with renal failure and secondary hyperparathyroidism. BMC Nephrology 19 24. (10.1186/s12882-018-0822-8) - DOI - PMC - PubMed
    1. Beck Jr GR, Zerler B, Moran E.2000Phosphate is a specific signal for induction of osteopontin gene expression. PNAS 978352–8357. (10.1073/pnas.140021997) - DOI - PMC - PubMed
    1. Beck-Cormier S, Lelliott CJ, Logan JG, Lafont DT, Merametdjian L, Leitch VD, Butterfield NC, Protheroe HJ, Croucher PI, Baldock PAet al.2019Slc20a2, encoding the phosphate transporter PiT2, is an important genetic determinant of bone quality and strength. Journal of Bone and Mineral Research 341101–1114. (10.1002/jbmr.3691) - DOI - PMC - PubMed
    1. Bervoets ARJ, Spasovski GB, Behets GJ, Dams G, Polenakovic MH, Zafirovska K, Van Hoof VO, De Broe ME, D'Haese PC.2003Useful biochemical markers for diagnosing renal osteodystrophy in predialysis end-stage renal failure patients. American Journal of Kidney Diseases 41997–1007. (10.1016/s0272-6386(0300197-5) - DOI - PubMed
    1. Bover J, Ureña P, Aguilar A, Mazzaferro S, Benito S, López-Báez V, Ramos A, daSilva I, Cozzolino M.2018Alkaline phosphatases in the complex chronic kidney disease-mineral and bone disorders. Calcified Tissue International 103111–124. (10.1007/s00223-018-0399-z) - DOI - PubMed

Publication types

MeSH terms