. 2022 Sep 1;132(17):e152673.
doi: 10.1172/JCI152673.

Bone marrow-confined IL-6 signaling mediates the progression of myelodysplastic syndromes to acute myeloid leukemia

Affiliations

Bone marrow-confined IL-6 signaling mediates the progression of myelodysplastic syndromes to acute myeloid leukemia

Yang Mei et al. J Clin Invest. .

Abstract

Myelodysplastic syndromes (MDS) are age-related myeloid neoplasms with increased risk of progression to acute myeloid leukemia (AML). The mechanisms of transformation of MDS to AML are poorly understood, especially in relation to the aging microenvironment. We previously established an mDia1/miR-146a double knockout (DKO) mouse model phenocopying MDS. These mice develop age-related pancytopenia with oversecretion of proinflammatory cytokines. Here, we found that most of the DKO mice underwent leukemic transformation at 12-14 months of age. These mice showed myeloblast replacement of fibrotic bone marrow and widespread leukemic infiltration. Strikingly, depletion of IL-6 in these mice largely rescued the leukemic transformation and markedly extended survival. Single-cell RNA sequencing analyses revealed that DKO leukemic mice had increased monocytic blasts that were reduced with IL-6 knockout. We further revealed that the levels of surface and soluble IL-6 receptor (IL-6R) in the bone marrow were significantly increased in high-risk MDS patients. Similarly, IL-6R was also highly expressed in older DKO mice. Blocking of IL-6 signaling significantly ameliorated AML progression in the DKO model and clonogenicity of CD34-positive cells from MDS patients. Our study establishes a mouse model of progression of age-related MDS to AML and indicates the clinical significance of targeting IL-6 signaling in treating high-risk MDS.

Keywords: Cancer; Hematology; Inflammation; Mouse models.


Figures

Figure 1
Figure 1. Old moribund mDia1/miR-146a DKO mice progress from MDS to acute leukemia.
(A) Representative images of H&E staining of the bone marrow and spleens from indicated mice (12–14 months old). Scale bars: 100 μm. (B) Representative images of H&E staining show blasts infiltrating the livers of DKO mice (outlined) from A. Scale bar: 100 μm. (C) Representative images of the bone marrow from moribund DKO mice show osteosclerosis (H&E) and marked fibrosis (reticulin). Scale bars: 100 μm. (D) Wright-Giemsa staining of peripheral blood smear from moribund DKO mice and DWT control mice. Arrows indicate the blasts. Scale bar: 20 μm. (E) White blood cell count, hemoglobin, and platelet count in the indicated mice. The mice in these groups were 12–14 months old. Data are presented as mean ± SEM. *P < 0.05, **P < 0.01, ***P < 0.001, ****P < 0.0001; 1-way ANOVA.
Figure 2
Figure 2. IL-6 signaling mediates MDS transformation to acute leukemia.
(A) Complete blood cell counts of indicated mice at indicated time points. TWT, Diap1+/+ Mir146a+/+ Il6+/+, n = 11; IL-6 KO, n = 7; DKO, Diap1–/– Mir146a–/– Il6+/+, n = 16; TKO, Diap1–/– Mir146a–/– Il6–/–, n = 8. (B) Representative spleen images from the indicated mice (left) at 12–14 months of age. The spleen/body weight ratio was further quantified (right). (C) Representative histology images of bone marrow and spleen from the indicated mice in B. The reticulin staining reveals increased fibrosis in DKO mice. The arrow and arrowhead indicate mitotic and apoptotic cells, respectively. Scale bars: 100 μm. (D) Kaplan-Meier survival analysis of the indicated mice. (E and F) In vitro colony-forming unit assay of nucleated cells from the bone marrow (BM), spleen, and peripheral blood (PB) of indicated mice at 12–14 months of age. Representative colonies are shown in E and quantified in F. Scale bars: 500 μm. CFC, colony-forming cell; BMMC, bone marrow mononuclear cell; SPMC, splenic mononuclear cell. Data are presented as mean ± SEM. *P < 0.05, **P < 0.01, ***P < 0.001, ****P < 0.0001; 1-way ANOVA.
Figure 3
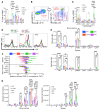
Figure 3. IL-6 deficiency ameliorates the defective hematopoiesis and leukemogenesis in DKO mice.
(A) The percentages of indicated cells among the peripheral blood mononuclear cells of the indicated mice at 12–14 months of age. TWT, n = 12; IL-6 KO, n = 8; DKO, n = 10; TKO, n = 10. Gran, granulocytes, Ly6G+CD11b+; MO, monocytes, Ly6C+CD11b+; B, B cells, B220+; T, T cells, CD3e+. (B) Flow cytometry plots illustrating the gating strategy for MDSCs in cells from A. gMDSC, granulocytic MDSC. (C) Quantification of MDSC populations in B. (D) Flow cytometric analyses of the expression levels of c-Kit among the indicated cell populations from C in the indicated mice. (E) Absolute numbers of cells in the indicated lineages were quantified in the bone marrow and spleens from the indicated mice in A. (F) Cell size of indicated MDSCs in E was measured by flow cytometric forward scatter (FSC-A) and normalized to cells from the TWT group. (G) Absolute number of erythroid cells in various developmental stages (I–VI) from the bone marrow and spleens of the indicated mice in C. The stages were determined by the cell surface expression levels of CD44. Stage I, proerythroblast; stage II, basophilic erythroblast; stage III, polychromatic erythroblast; stage IV, orthochromatic erythroblast; stage V, reticulocyte; stage VI, mature erythrocyte. Data are presented as mean ± SEM. *P < 0.05, **P < 0.01, ***P < 0.001, ****P < 0.0001; 2-way ANOVA.
Figure 4
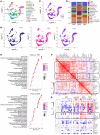
Figure 4. Single-cell RNA sequencing profiling reveals IL-6 signaling mediating MDS transformation to AML with monocytic differentiation.
(A) Merged Uniform Manifold Approximation and Projection (UMAP) plots from the bone marrow of 12- to 14-month-old TWT, DKO, and TKO mice showing the distribution and overlapping of annotated cell populations. (B) Same as A except the plots are shown separately for TWT, DKO, and TKO. (C) Merged UMAP plots from B highlighting the increased cell populations. (D) The percentages of the annotated cell types were compared among the indicated groups of mice. (E) KEGG pathway enrichment analysis of differentially expressed genes from AD. The size of each circle represents the count of genes in that pathway. The color key from blue to red represents the low to high of adjusted P value based on –log10. (F) Pairwise similarity analysis of selected cytokine levels across 4 groups of mice: TWT, IL-6 KO, DKO, and TKO. Darker red indicates coexpression patterns consistent within 4 groups. (G) Hierarchical-clustering analyses of cytokine expression profiles from the serum of indicated mice determined by multiplex ELISA. Each column represents serum from a single mouse.
Figure 5
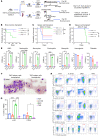
Figure 5. IL-6 deficiency abolishes the transplantation abilities of leukemia-initiating cells.
(A) Schematic diagram of the transplantation strategies in BD. (B) Kaplan-Meier survival analyses of CD45.1+ mice subjected to transplantation of 2 × 10⁶ bone marrow mononuclear cells from the indicated mice. Both the recipient and donor mice were approximately 2 months old at transplantation. (C and D) Same as B except 2 × 10⁷ splenic mononuclear cells from moribund DKO mice or age-matched wild-type counterparts were used as donor cells. Survival data before (C) and after (D) 21 days of transplantation are shown. (E) Complete blood counts of the recipient mice in D when the mice were 12 weeks post-transplantation. (F) Wright-Giemsa staining of peripheral blood smear of mice in E. Arrows indicate blasts. Scale bar: 20 μm. (G) Flow cytometric analysis evaluated stem cell surface marker expression in peripheral blood from mice in E. (H) Representative flow cytometric profiling of c-Kit+ cells in peripheral blood from mice in E. Data are presented as mean ± SEM. *P < 0.05, **P < 0.01, ***P < 0.001, ****P < 0.0001; 1-way ANOVA.
Figure 6
Figure 6. IL-6R and sIL-6R are increased in the bone marrow of patients with high-risk MDS.
(A) IL-6 receptor (IL-6R) mRNA levels were examined from a gene expression profiling data set in CD34+ hematopoietic progenitor cells from patients with indicated MDS subtypes. Control, n = 17; MDS-EB1, MDS with excess blast-1, n = 37; MDS-EB2, MDS with excess blast-2, n = 43; MDS-RS, MDS with ring sideroblasts, n = 48; MDS-SLD, MDS with single-lineage dysplasia, n = 55. (B) Kaplan-Meier analysis of overall survival in MDS patients with high or low expression levels of IL-6R from A. (C) Representative images of immunohistochemical staining of IL-6R in bone marrow biopsies from patients with indicated MDS subtypes. Scale bar: 100 μm. (D) ELISA analyses of soluble IL-6R (sIL-6R) levels in bone marrow (BM) aspirate or peripheral blood (PB) serum from control and MDS patients in a separate cohort from A. BM control, n = 12; BM MDS, n = 33; PB control, n = 5; PB MDS, n = 10. (E) ELISA analysis of sIL-6R of bone marrow aspirate from different subtypes of MDS patients in D. Control, n = 12; MDS-EB, n = 15; MDS-MLD, MDS with multilineage dysplasia, n = 6; MDS-RS, n = 3; MDS-SLD, n = 9. (F) ELISA analysis of sIL-6R in serum of the indicated mice at 12 months old. n = 4 in each group. (G) Flow cytometric analyses of IL-6R expression on the cell surface of various cell lineages from the indicated mice at 12 months old. Data are presented as mean ± SEM. *P < 0.05, **P < 0.01, ***P < 0.001, ****P < 0.0001; 1-way ANOVA (A, E, and F), 2-way ANOVA (G), and 2-tailed Student’s t test (D).
Figure 7
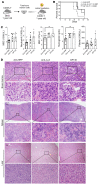
Figure 7. Targeting IL-6 signaling ameliorates MDS to AML progression in DKO model.
(A) Schematic illustration of bone marrow transplantation. 5 × 10⁶ bone marrow cells from 1-year-old DKO mice were transplanted into lethally irradiated 1-year-old CD45.1+ recipient mice. (B) Kaplan-Meier survival analysis of the old CD45.1+ recipient mice subjected to transplantation of bone marrow cells from 1-year-old DKO mice as illustrated in A and treated with the indicated reagents once per week. n = 7 in each group. (C) Complete blood cell counts of the mice from B given the indicated reagents 1 month after treatment. Data are presented as mean ± SEM. *P < 0.05; 1-way ANOVA. (D) Representative H&E staining of the bone marrow, spleen, and liver from the mice in B. Scale bars: 100 μm.
Figure 8
Figure 8. Tocilizumab reduces cell proliferation and colony formation in MDS patient cells.
(A) Cultured MDSL cells were treated with tocilizumab or IgG for 1 hour at indicated concentrations. Cells were then challenged with human recombinant IL-6 (10 ng/mL) for 15 minutes followed by Western blot assay of p-STAT3. Actin was used as a loading control. See complete unedited blots in the supplemental material. (B) 1 × 10⁴ MDSL cells per well were seeded in a 96-well plate on day 0 in MDSL culture medium with 50 μg/mL tocilizumab or 50 μg/mL human IgG control. Relative cell number was assessed with CCK-8 reagent at indicated time points. (C) 1 × 10⁶ MDSL cells were transplanted into sublethally irradiated NSG recipient mice. Ten days after transplantation, mice were subjected to weekly tocilizumab (TCZ) or human IgG (8 mg/kg) by i.p. administration. Engraftment was evaluated 60 days after transplantation via flow cytometry assays of hCD45+ mononuclear cells in the peripheral blood. n = 5 in each group. (D) Quantification of the percentage of hCD45+ cells in C. (E and F) Colony-forming unit (CFU) assays in normal (E) and high-risk MDS patient (F) bone marrow–derived CD34+ cells. 1 × 10³ normal (E) or 2 × 10³ patient CD34+ cells (F) were seeded in MethoCult medium supplemented with human IgG or tocilizumab (50 μg/mL) on day 0. The number of colonies was assessed on day 14. Triplicate assay colonies were independently identified by 2 individuals. Data are presented as mean ± SD. *P < 0.05, **P < 0.01, ***P < 0.001; 2-tailed Student’s t test. E, G, M, GM, and GEMM represent BFU/CFU-E, CFU-G, CFU-M, CFU-GM, and CFU-GEMM, respectively, in both E and F.

References

    1. Lindsley RC, Ebert BL. Molecular pathophysiology of myelodysplastic syndromes. Annu Rev Pathol. 2013;8:21–47. doi: 10.1146/annurev-pathol-011811-132436. - DOI - PMC - PubMed
    1. Gangat N, et al. Myelodysplastic syndromes: contemporary review and how we treat. Am J Hematol. 2016;91(1):76–89. doi: 10.1002/ajh.24253. - DOI - PubMed
    1. Haferlach T, et al. Landscape of genetic lesions in 944 patients with myelodysplastic syndromes. Leukemia. 2014;28(2):241–247. doi: 10.1038/leu.2013.336. - DOI - PMC - PubMed
    1. Link DC, Walter MJ. ‘CHIP’ping away at clonal hematopoiesis. Leukemia. 2016;30(8):1633–1635. doi: 10.1038/leu.2016.130. - DOI - PubMed
    1. Steensma DP, et al. Clonal hematopoiesis of indeterminate potential and its distinction from myelodysplastic syndromes. Blood. 2015;126(1):9–16. doi: 10.1182/blood-2015-03-631747. - DOI - PMC - PubMed

Publication types