. 2022 Aug 4;29(10):557-568.
doi: 10.1530/ERC-22-0045. Print 2022 Oct 1.

miR-3156-5p is downregulated in serum of MEN1 patients and regulates expression of MORF4L2

Affiliations

miR-3156-5p is downregulated in serum of MEN1 patients and regulates expression of MORF4L2

Kreepa G Kooblall et al. Endocr Relat Cancer. .

Abstract

Multiple endocrine neoplasia type 1 (MEN1), caused by mutations in the MEN1 gene encoding menin, is an autosomal dominant disorder characterised by the combined occurrence of parathyroid, pituitary and pancreatic neuroendocrine tumours (NETs). Development of these tumours is associated with wide variations in their severity, order and ages (from <5 to >80 years), requiring life-long screening. To improve tumour surveillance and quality of life, better circulating biomarkers, particularly for pancreatic NETs that are associated with higher mortality, are required. We, therefore, examined the expression of circulating miRNA in the serum of MEN1 patients. Initial profiling analysis followed by qRT-PCR validation studies identified miR-3156-5p to be significantly downregulated (-1.3 to 5.8-fold, P < 0.05-0.0005) in nine MEN1 patients, compared to matched unaffected relatives. MEN1 knock-down experiments in BON-1 human pancreatic NET cells resulted in reduced MEN1 (49%, P < 0.05), menin (54%, P < 0.05) and miR-3156-5p expression (20%, P < 0.005), compared to control-treated cells, suggesting that miR-3156-5p downregulation is a consequence of loss of MEN1 expression. In silico analysis identified mortality factor 4-like 2 (MOR4FL2) as a potential target of miR-3156-5p, and in vitro functional studies in BON-1 cells transfected with either miR-3156-5p mimic or inhibitors showed that the miR-3156-5p mimic significantly reduced MORF4L2 protein expression (46%, P < 0.005), while miR-3156-5p inhibitor significantly increased MORF4L2 expression (1.5-fold, P < 0.05), compared to control-treated cells, thereby confirming that miR-3156-5p regulates MORF4L2 expression. Thus, the inverse relationship between miR-3156-5p and MORF4L2 expression represents a potential serum biomarker that could facilitate the detection of NET occurrence in MEN1 patients.

Keywords: menin; microRNA; mortality factor 4-like protein 2; multiple endocrine neoplasia type 1; neuroendocrine tumour.


Figures
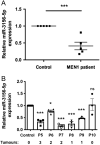
Figure 1
Figure 1
miR-3156-5p downregulation in serum of MEN1 patients. miR-3156-5p expression was reduced in the serum of five MEN1 patients, when compared to sex-matched control (unaffected) relatives (A). n  = 3-4 technical replicates were undertaken for each patient and controls with n  = 5 biological replicates. A t-test was used to determine significance; ***P < 0.005. Data on all five patients (P5-9, Table 1) was then assessed individually, with samples arranged by the number of MEN1-associated tumour manifestations, to determine if all showed statistically significant reductions in miR-3156-5p compared to controls. A patient (P10) who had undergone extensive treatment and was described as tumour-free has also been included for comparison (B). n  = 3-4 technical replicates were undertaken for each patient and control. One-way ANOVA was undertaken to determine statistical significance; *P < 0.05, ***P < 0.0005.
Figure 2
Figure 2
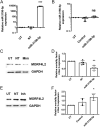
Expression of miR-3156-5p after menin knock-down. BON-1 cells were treated with siRNA for MEN1 or control non-targeting (NT) siRNA. Untransfected (UT) cells were used as controls. Quantitative RT PCR (qRT-PCR) was used to evaluate MEN1 expression (A). Data are represented relative to UT cells. Studies were undertaken in n  = 4 biological replicates. Statistical significance comparing all treatments to each other was assessed by one-way ANOVA; *P < 0.05. Menin protein, encoded by MEN1, was assessed by Western blot analyses, with calnexin (housekeeper) used as a control (B). A representative Western blot is shown. Protein expression from the Western blot was quantified using densitometry analysis from n  = 4 biological replicates (C). Data are represented relative to UT cells. Statistical significance comparing all treatments to each other was assessed by one-way ANOVA; *P < 0.05. miR-3156-5p expression after MEN1 knock-down was evaluated using qRT-PCR (D). Data are represented relative to UT cells. Studies were undertaken in n  = 4 biological replicates, and statistical significance comparing all treatments to each other was assessed by one-way ANOVA; **P < 0.005.
Figure 3
Figure 3
Regulation of MORF4L2 expression by miR-3156-5p. BON-1 cells were transfected with either miR-3156-5p mimic or inhibitors for 48 h, and MORF4L2 expression was assessed. Confirmation of miR-3156-5p mimic transfection was undertaken using qRT-PCR (A). Untransfected (UT) cells and non-targeting (NT) scrambled RNA-treated cells were used as controls. Experiments were performed in n  = 4 biological replicates. Data are represented relative to UT cells, with statistical significance comparing all transfections to each other assessed by one-way ANOVA; ***P < 0.0001. To determine if inhibitor transfection altered miR-3156-5p expression, qRT-PCR analysis was undertaken (B). UT and control miRNA inhibitor transfections were used as controls. Experiments were performed in n  = 4 biological replicates. Data are represented relative to UT cells, with statistical significance comparing all transfections to each other assessed by one-way ANOVA; ns, not significant. MORF4L2 expression after mimic treatment was assessed by Western blot analyses (C). A representative image from n  = 4 biological replicates is shown. GAPDH was used as a housekeeper. Western blot analyses were quantified using densitometry analysis (D). Data are represented relative to UT cells. Studies were undertaken in n  = 4 biological replicates, and statistical significance comparing all treatments to each other was assessed by one-way ANOVA; **P < 0.005. MORF4L2 expression after inhibitor treatment was also assessed by Western blot analyses (E). A representative image from n  = 4 biological replicates is shown. GAPDH was used as a housekeeper. The Western blots were quantified using densitometry analysis (F). Data are represented relative to UT cells. Studies were undertaken in n  = 4 biological replicates, and statistical significance comparing all treatments to each other was assessed by one-way ANOVA; *P < 0.05.
Figure 4
Figure 4
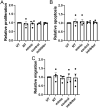
Functional analysis after dysregulation of miR-3156-5p in BON-1 cells. BON-1 cells were transfected with either miR-3156-5p mimic or inhibitors for 48 hours, untransfected (UT) cells and non-targeting (NT) scrambled RNA-treated cells or control inhibitor-treated cells were used as controls. All experiments were performed in n  = 4 biological replicates. Cell viability was assessed 5 days after transfection using Cell Titer blue assay. Data are shown relative to UT cells. Statistical analysis using one-way ANOVA indicated no significant difference (A). Apoptosis was assessed using Caspase 3/7 Glo assay 5 days post-transfection. Data are shown relative to UT cells. Statistical analysis using one-way ANOVA indicated no significant difference (B). Cell migration was assessed 5 days post-transfection using wound-healing assays. Data are shown relative to UT cells. Statistical analysis using one-way ANOVA indicated no significant difference (C).
Figure 5
Figure 5
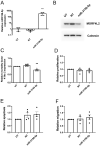
m iR -3156-5p regulates MORF4L2 in HEPG2 cells. HEPG2 cells were transfected with miR-3156-5p mimic for 48 h. Untransfected (UT) cells and non-targeting (NT) scrambled RNA-treated cells were used as controls. Experiments were performed in n  = 4 biological replicates. Confirmation of miR-3156-5p mimic transfection was undertaken using qRT-PCR. Data are represented relative to UT cells. Statistical analysis was performed using one-way ANOVA, **P < 0.005 (A). MORF4L2 expression after mimic treatment was assessed by Western blot analyses. A representative image from n  = 4 biological replicates is shown. Calnexin was used as a housekeeper (B). Western blot analyses were quantified using densitometry. Statistical analysis was performed using one-way ANOVA, **P < 0.005 (D). After 5 days of transfection, the effect of miR-3156-5p overexpression was assessed in cell viability (E), apoptosis (F) and migration assays (G). No significant difference was observed in any of the three assays.

References

    1. Anders S, Pyl PT, Huber W.2015HTSeq – a Python framework to work with high-throughput sequencing data. Bioinformatics 31166–169. (10.1093/bioinformatics/btu638) - DOI - PMC - PubMed
    1. Ardekani AM, Naeini MM.2010The role of microRNAs in human diseases. Avicenna Journal of Medical Biotechnology 2161–179. - PMC - PubMed
    1. Avniel-Polak S, Leibowitz G, Riahi Y, Glaser B, Gross DJ, Grozinsky-Glasberg S.2016Abrogation of autophagy by chloroquine alone or in combination with mTOR inhibitors induces apoptosis in neuroendocrine tumor cells. Neuroendocrinology 103724–737. (10.1159/000442589) - DOI - PubMed
    1. Brandi ML, Agarwal SK, Perrier ND, Lines KE, Valk GD, Thakker RV.2021Multiple endocrine neoplasia type 1: latest insights. Endocrine Reviews 42133–170. (10.1210/endrev/bnaa031) - DOI - PMC - PubMed
    1. Chen Y, Wang X.2019miRDB: an online database for prediction of functional microRNA targets. Nucleic Acids Research 48D127–D131. (10.1093/nar/gkz757) - DOI - PMC - PubMed

Publication types

LinkOut - more resources