. 2022 Sep;69(9):2651-2662.
doi: 10.1109/TUFFC.2022.3194548. Epub 2022 Aug 26.

Combining ADMIRE and MV to Improve Image Quality

Combining ADMIRE and MV to Improve Image Quality

Siegfried Schlunk et al. IEEE Trans Ultrason Ferroelectr Freq Control. 2022 Sep.

Abstract

Aperture domain model image reconstruction (ADMIRE) is a frequency-domain, model-based beamformer, in part designed for removing reverberation and off-axis clutter. Minimum variance (MV) is alternatively designed to reduce off-axis interference and improve lateral resolution. MV is known to be less effective in high incoherent noise scenarios, and its performance in the presence of reverberation has not been evaluated. By implementing ADMIRE before MV, the benefits of both these beamformers can be achieved. In this article, the assumptions of MV are discussed, specifically their relationship to reverberation clutter. The use of ADMIRE as a preprocessing step to suppress noise from simulations with linear scanning and in vivo curvilinear kidney data is demonstrated, and both narrowband and broadband implementations of MV are applied. With optimal parameters, ADMIRE + MV demonstrated sizing improvements over MV alone by an average of 52.1% in 0-dB signal-to-clutter ratio reverberation cyst simulations and 14.5% in vivo while improving the contrast ratio compared to ADMIRE alone by an average of 15.1% in simulations and 14.0% in vivo. ADMIRE + MV demonstrated a consistent improvement compared to DAS, MV, and ADMIRE both in terms of sizing and contrast ratio.


Figures

Fig. 1.
Fig. 1.
Field II simulations of an individual point target (A,C,E) without interference and (B,D,F) with reverberant signal interference. The reverberant signal is simulated at a much shallower depth than the point target and then time-delayed to appear at the same time index. (A,B) channel data at the depth of the point target. The arrows indicate the directions of the vector wavenumbers of the echoes, showing a subset of the possible wavenumbers in the reverberant spherical wave case. (C,D) DAS and (E,F) MV images of the point target. B-mode images are displayed on a 60 dB scale. (G) a high-resolution beamplot from MV of a separate simulation where the reverberant signal is replaced with an off-axis target, highlighting the null that is created in the off-axis case and the lack thereof in the reverberation case.
Fig. 2.
Fig. 2.
Example of an ADMIRE model X, composed of a set of estimated signals from locations considered to be clutter (sparsely sampled, e.g a and b), and a set from locations considered to be region of interest (highly sampled, e.g. c). For a given aperture domain signal y, the model can be used to estimate which sources are components of the received signal, allowing us to remove signal components that are not from the ROI.
Fig. 3.
Fig. 3.
Example of MVNB and AD+MVNB radial intensity curves from which the cyst edge width is estimated as the distance it takes to rise from 0.25 to 0.75 (indicated with the dashed lines).
Fig. 4.
Fig. 4.
Parameter testing for the subarray length (L) versus the full aperture length (M) for both narrowband (MVNB) and broadband (MVBB) implementations. Point spread functions for (A,B) a bright target with no reverberation interference and (C,D) a bright target with an interfering reverberant signal. (E,F,G) show an in vivo example of MVNB with varying subarray lengths, demonstrating how increasing the subarray length can lead to general image quality degradation.
Fig. 5.
Fig. 5.
Sample cases of an anechoic cyst with no added noise, added reverberation clutter (0dB SCR), and added thermal noise (0dB SNR) displayed on a 50 dB dynamic range. The black solid circles indicate the true region of the cyst as well as a background speckle region surrounding it for use with our imaging metrics. The white solid lines show the radial region for which the cyst boundary width was estimated.
Fig. 6.
Fig. 6.
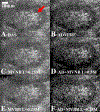
Comparisons of the b-mode images for Case 1 on a 60dB dynamic range for the minimum variance methods both individually (C,E) and after pre-processing with ADMIRE (D,F). The kidney stone is indicated by the red arrow in the DAS image.
Fig. 7.
Fig. 7.
B-mode images on a 30dB dynamic range of a selection of the in vivo kidney stones. The individual stones are manually highlighted in red with the help of a contour map, and the background used for image quality metrics is shown in yellow based on the stone region selected. The blue line shows the lateral length of the stone region.

References

    1. Byram B, Dei K, Tierney J, and Dumont D, “A Model and Regularization Scheme for Ultrasonic Beamforming Clutter Reduction,” IEEE Transactions on Ultrasonics, Ferroelectrics, and Frequency Control, vol. 62, no. 11, pp. 1913–1927, 2015. - PMC - PubMed
    1. Dei K and Byram B, “The Impact of Model-Based Clutter Suppression on Cluttered, Aberrated Wavefronts,” IEEE Transactions on Ultrasonics, Ferroelectrics, and Frequency Control, vol. 64, no. 10, pp. 1450–1464, 2017. - PMC - PubMed
    1. Byram B and Jakovljevic M, “Ultrasonic Multipath and Beamforming Clutter Reduction: A Chirp Model Approach,” IEEE Transactions on Ultrasonics, Ferroelectrics, and Frequency Control, vol. 61, no. 3, pp. 428–440, 2014. - PMC - PubMed
    1. Capon J, “High-resolution frequency-wavenumber spectrum analysis,” Proceedings of the IEEE, vol. 57, no. 8, pp. 1408–1418, 1969. [Online]. Available: http://ieeexplore.ieee.org/document/1449208/
    1. Sasso M and Cohen-Bacrie C, “Medical ultrasound imaging using the fully adaptive beamformer,” in Proceedings. (ICASSP ‘05). IEEE International Conference on Acoustics, Speech, and Signal Processing, 2005., vol. 2, no. 4. IEEE, 2005, pp. 489–492. [Online]. Available: http://ieeexplore.ieee.org/document/1415448/

Publication types