. 2022 Jul 28;17(7):e0271260.
doi: 10.1371/journal.pone.0271260. eCollection 2022.

An empirical evaluation of sampling methods for the classification of imbalanced data

Affiliations

An empirical evaluation of sampling methods for the classification of imbalanced data

Misuk Kim et al. PLoS One. .

Abstract

In numerous classification problems, class distribution is not balanced. For example, positive examples are rare in the fields of disease diagnosis and credit card fraud detection. General machine learning methods are known to be suboptimal for such imbalanced classification. One popular solution is to balance training data by oversampling the underrepresented (or undersampling the overrepresented) classes before applying machine learning algorithms. However, despite its popularity, the effectiveness of sampling has not been rigorously and comprehensively evaluated. This study assessed combinations of seven sampling methods and eight machine learning classifiers (56 varieties in total) using 31 datasets with varying degrees of imbalance. We used the areas under the precision-recall curve (AUPRC) and receiver operating characteristics curve (AUROC) as the performance measures. The AUPRC is known to be more informative for imbalanced classification than the AUROC. We observed that sampling significantly changed the performance of the classifier (paired t-tests P < 0.05) only for few cases (12.2% in AUPRC and 10.0% in AUROC). Surprisingly, sampling was more likely to reduce rather than improve the classification performance. Moreover, the adverse effects of sampling were more pronounced in AUPRC than in AUROC. Among the sampling methods, undersampling performed worse than others. Also, sampling was more effective for improving linear classifiers. Most importantly, we did not need sampling to obtain the optimal classifier for most of the 31 datasets. In addition, we found two interesting examples in which sampling significantly reduced AUPRC while significantly improving AUROC (paired t-tests P < 0.05). In conclusion, the applicability of sampling is limited because it could be ineffective or even harmful. Furthermore, the choice of the performance measure is crucial for decision making. Our results provide valuable insights into the effect and characteristics of sampling for imbalanced classification.


Conflict of interest statement

The authors have declared that no competing interests exist.

Figures
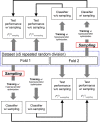
Fig 1
Fig 1. Schematic diagram of the workflow for evaluating the effectiveness of sampling for imbalanced classification.
The process is repeated five times (i = 1, 2, 3, 4, 5) with repeated random division of an imbalanced classification dataset.
Fig 2
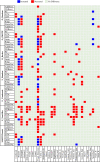
Fig 2. Heatmap of the difference in the area under the precision-recall curve between classification with and without sampling on the 31 imbalanced datasets.
Combinations of the seven sampling methods [i.e., random oversampling (O_Random), synthetic minority oversampling technique (O_SMOTE), borderline synthetic minority oversampling technique (O_Border), random undersampling (U_Random), condensed nearest neighbors undersampling (U_Condensed), NearMiss2 (U_NearMiss), and SMOTETomek] and eight machine learning methods [i.e., adaptive boosting (AdaBoost), extreme gradient boosting (XGBoost), random forests (RFs), support vector machines (SVMs), the linear discriminant analysis (LDA), lasso, ridge, and elastic net] were compared using the 31 datasets.
Fig 3
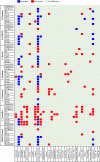
Fig 3. Heatmap of the difference in the area under the receiver operating characteristics curve between classification with and without sampling on the 31 imbalanced datasets.
Combinations of the seven sampling methods [i.e., random oversampling (O_Random), synthetic minority oversampling technique (O_SMOTE), borderline synthetic minority oversampling technique (O_Border), random undersampling (U_Random), condensed nearest neighbors undersampling (U_Condensed), NearMiss2 (U_NearMiss), and SMOTETomek] and eight machine learning methods [i.e., adaptive boosting (AdaBoost), extreme gradient boosting (XGBoost), random forests (RFs), support vector machines (SVMs), the linear discriminant analysis (LDA), lasso, ridge, and elastic net] were compared using the 31 datasets.
Fig 4
Fig 4. Comparison of the effectiveness of the seven sampling methods.
The number of cases in which a sampling method enhanced (blue) or reduced (red) the performance in (A) the area under the precision-recall curve (AUPRC) and (B) the area under the receiver operating characteristics curve (AUROC) is shown. Seven sampling methods—random oversampling (O_Random), synthetic minority oversampling technique (O_SMOTE), borderline synthetic minority oversampling technique (O_Border), random undersampling (U_Random), condensed nearest neighbors undersampling (U_Condensed), NearMiss2 (U_NearMiss), and SMOTETomek—were compared.
Fig 5
Fig 5. Comparison of machine learning methods by the effectiveness of sampling.
The number of cases in which (A) the area under the precision-recall curve (AUPRC) and (B) the area under the receiver operating characteristics curve (AUROC) of a machine learning method were improved (blue) or reduced (red) by sampling. Eight machine learning methods—adaptive boosting (AdaBoost), extreme gradient boosting (XGBoost), random forests (RFs), support vector machines (SVMs), the linear discriminant analysis (LDA), lasso, ridge, and elastic net—were compared.
Fig 6
Fig 6
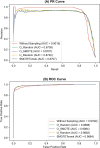
(A) Precision-recall (PR) and (B) receiver operating characteristics (ROC) curves of linear discriminant analysis with and without the four sampling methods on the Letter_a dataset. The PR and ROC curves on the test dataset of the first fold of the first iteration of the 5x2 cross-validation run are shown. Four sampling methods were compared: random oversampling (O_Random), synthetic minority oversampling technique (O_SMOTE), random undersampling (U_Random), and SMOTETomek. AUC indicates the area under the PR or ROC curve.
Fig 7
Fig 7
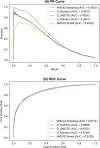
(A) Precision-recall (PR) and (B) receiver operating characteristics (ROC) curves of linear discriminant analysis with and without the four sampling methods on the Fraud_Detection dataset. The PR and ROC curves on the test dataset of the first fold of the first iteration of the 5x2 cross-validation run are shown. Four sampling methods were compared: random oversampling (O_Random), synthetic minority oversampling technique (O_SMOTE), random undersampling (U_Random), and SMOTETomek. AUC means the area under the PR or ROC curve.

References

    1. Haixiang G, Yijing L, Shang J, Mingyun G, Yuanyue H, Bing G. Learning from class-imbalanced data: Review of methods and applications. Expert Syst Appl. 2017;73:220–39.
    1. Bolton RJ, Hand DJ. Statistical fraud detection: A review. Stat Sci. 2002;17(3):235–55.
    1. Yang Z, Tang W, Shintemirov A, Wu Q. Association rule mining-based dissolved gas analysis for fault diagnosis of power transformers. IEEE Trans Syst Man Cybern C Appl Rev. 2009;39(6):597–610.
    1. Zhu Z-B, Song Z-H. Fault diagnosis based on imbalance modified kernel Fisher discriminant analysis. Chem Eng Res Des. 2010;88(8):936–51.
    1. Khreich W, Granger E, Miri A, Sabourin R. Iterative Boolean combination of classifiers in the ROC space: An application to anomaly detection with HMMs. Pattern Recognit. 2010;43(8):2732–52.

Publication types