. 2022 Jul 28;17(7):e0266098.
doi: 10.1371/journal.pone.0266098. eCollection 2022.

Automatic Multi-functional Integration Program (AMFIP) towards all-optical mechano-electrophysiology interrogation

Affiliations

Automatic Multi-functional Integration Program (AMFIP) towards all-optical mechano-electrophysiology interrogation

Qin Luo et al. PLoS One. .

Abstract

Automatic operations of multi-functional and time-lapse live-cell imaging are necessary for the biomedical science community to study active, multi-faceted, and long-term biological phenomena. To achieve automatic control, most existing solutions often require the purchase of extra software programs and hardware that rely on the manufacturers' own specifications. However, these software programs are usually non-user-programmable and unaffordable for many laboratories. To address this unmet need, we have developed a novel open-source software program, titled Automatic Multi-functional Integration Program (AMFIP), as a new Java-based and hardware-independent system that provides proven advantages over existing alternatives to the scientific community. Without extra hardware, AMFIP enables the functional synchronization of the μManager software platform, the Nikon NIS-Elements platform, and other 3rd party software to achieve automatic operations of most commercially available microscopy systems, including but not limited to those from Nikon. AMFIP provides a user-friendly and programmable graphical user interface (GUI), opening the door to expanding the customizability for myriad hardware and software systems according to user-specific experimental requirements and environments. To validate the intended purposes of developing AMFIP, we applied it to elucidate the question whether single cells, prior to their full spreading, can sense and respond to a soft solid substrate, and if so, how does the interaction depend on the cell spreading time and the stiffness of the substrate. Using a CRISPR/Cas9-engineered human epithelial Beas2B (B2B) cell line that expresses mNeonGreen2-tagged mechanosensitive Yes-associated protein (YAP), we show that single B2B cells develop distinct substrate-stiffness-dependent YAP expressions within 10 hours at most on the substrate, suggesting that cells are able to sense, distinguish, and respond to mechanical cues prior to the establishment of full cell spreading. In summary, AMFIP provides a reliable, open-source, and cost-free solution that has the validated long-term utility to satisfy the need of automatic imaging operations in the scientific community.


Conflict of interest statement

The authors have declared that no competing interests exist.

Figures

Fig 1
Fig 1. The design of automatic multi-functional integration program (AMFIP).
(A) Software-based AMFIP is designed and developed to achieve customizable and automatic control of generic microscopy systems. This capability is needed in many research laboratories. AMFIP enables automatic, customizable, and hardware-independent control (in blue) of multi-functional imaging conditions to acquire spatial-temporal biological information. In contrast, other software-based solutions (in grey), such as μManager plugins, and hardware-based solutions, such as micro-controllers, only control limited hardware and thus provide restricted functions. (B) The Workflow of implementing AMFIP in a typical experiment. (1) A custom MATLAB program assists in detecting the cells of interest and generates a coordinate list of selected FOVs. (2) The GUI of AMFIP reads the coordinates to guide the movement of the XY motor-stage. Users input pre-defined experimental parameters and initiate μManager to modulate the Nikon Ti2-E microscope. (3) Java code in AMFIP activates Elements and SpinView to manipulate the A1R confocal microscope system and Blackfly S camera. The MATLAB program reads the latest bright-field image to update the coordinates of current FOVs. (4) AMFIP automatically conducts these operations in sequence for multi-functional imaging. (C) A representative view of MATLAB operation interface for automatic cell detection and stage-drift prevention. (C1) The Interface of MATLAB to edit marks of detected cell islands. Red marks indicate the centroids of detected cell islands while blue circles denote unwanted marks. The mis-match rate (number of marks that are not cell divided by number of overall marks) is 4.66% ± 0.82%. (C2) Patterns of detected cells. The detected cells are marked with green rectangles. (C3) Detection control with “DELETE” and “QUIT” buttons. The button in grey indicates that its statement is inactivated. By clicking the button, its function is activated.
Fig 2
Fig 2. The graphical user interface (GUI) of AMFIP.
The all-in-one GUI of AMFIP enables users to program all experimental parameters and essential functions according to users’ specific experimental requirements and environment. Users are allowed to (1) Input X, Y, Z coordinates for each FOV; (2) Specify the types of microscope objective for each FOV; (3) Specify the intensity of DiaLamp for each FOV; (4) Specify desired filter cubes for each FOV; (5) Define the universal time and laser configurations for each FOV in the experiment; (6) Switch to different light path; (7) Add or remove points; (8) Open up the window for additional laser configuration; (9) Open up the window for additional time configuration; and (10) Start the specified experimental procedure.
Fig 3
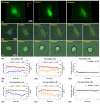
Fig 3. Relationship between YAP N/C ratio and cell spreading states of single B2B cells on 2-kPa hydrogels substrates.
(A) 3D fluorescent confocal YAP image stack of a single spreading B2B cell on 2-kPa substrate at 0.5th, 5th, and 10th hour. Notably, YAP intensity in nucleus decreases with respect to that in cytoplasm and the YAP distribution becomes homogenous during the process of cell spreading. (B) 10-hr time-lapse image stack that contains overlapped fluorescent YAP images and bright-field cell images of a single B2B cell spreading on 2-kPa hydrogels. Note: The shapes of the cell (in blue contour) and nucleus (in orange contour) transform from roundness to flatness. YAP N/C ratio decreases from 1.93 at 0th hour to 1.40 at 10th hour. (C) 10-hr time-lapse image stack of a non-spreading single cell. Note: The shape of the cell maintains rounded. YAP N/C ratio changed from 1.62 at 0th hour to 1.59 at 10th hour. (D) YAP N/C ratio versus nucleus/cell-body area of spreading cells (n = 10). The average YAP N/C ratio (red bold line; n = 10) changed from 1.97 ± 0.17 to 1.49 ± 0.12 (p-value = 0.0022**; D1). The average cell area (blue bold line; n = 10) increased from 708.96 ± 118.71 μm2 to 922.30 ± 147.73 μm2 (p-value = 0.0920 (ns); D1) and the average nucleus area (orange bold line; n = 10) changed from 222.70 ± 41.35 μm2 to 262.37 ± 45.64 μm2 (p-value = 0.3220 (ns); D2). The average nucleus-spread-area/cell-spread-area ratio changed from 0.27 ± 0.03 to 0.22 ± 0.06 over time (p-value = 0.2422 (ns))with a trend-line slope of -0.0024 (D3). (E) YAP N/C ratio versus nucleus/cell-body area of non-spreading cells (n = 5). The average YAP N/C ratio (red bold line) changed from 1.69 ± 0.16 to 1.62 ± 0.09 (p-value = 0.6741 (ns); E1), and the average cell area (blue bold line) changed from 399.49 ± 38.74 μm2 to 391.24 ± 21.30 μm2 (p-value = 0.8400 (ns); E1). The average nucleus area (orange bold line) changed from 230.02 ± 43.03 μm2 to 225.83 ± 33.60 μm2 (p-value = 0.9377 (ns); E2) The average nucleus-spread-area/cell-spread-area ratio maintained at 0.57 ± 0.07 (p-value = 0.9908 (ns)), with a trend-line slope of -0.0022 (E3). All p-values are indicated according to the Michelin guide scale (p ≤ 0.001: [***]; 0.001 < p ≤ 0.01: [**]; 0.01 < p ≤ 0.05: [*]; 0.05 < p: ns).
Fig 4
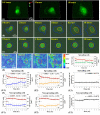
Fig 4. YAP N/C ratio and cell spreading states of single B2B cells on 5-kPa substrates.
(A) 3D fluorescent YAP image stack of the single spreading B2B cell at 0.5th, 5th and 10th hour. Note: YAP intensity in nucleus remains higher than the intensity in cytoplasm through the process of cell spreading. (B) 10-hr time-lapse image stack of a single spreading B2B cell on 5-kPa substrates. Note: The cell body (in blue contour) and the nucleus (in orange contour) flatten down. YAP N/C ratio changes from 2.09 at 0th hour to 1.73 at 10th hour. (C) 10-hr time-lapse image stack of a non-spreading single cell. The YAP N/C ratio changed from 2.00 at 0th hour to 2.09 at 10th hour. (D) A filmstrip of the traction field under the single spreading cell (A) and YAP N/C ratio vs. traction as a function of time (n = 10). The magnitude of traction remains constant as the cell spreads over time. (E) YAP N/C ratio versus nucleus/cell-body area of single spreading cells (n = 10). The average YAP N/C ratio (red bold line; n = 10) changed from 2.39 ± 0.28 to 1.74 ± 0.17 (p-value = 0.0057**; E1). The average normalized cell area (blue bold line; n = 10) increased from 580.96 ± 77.79 μm2 to 906.39 ± 245.43 μm2 (p-value = 0.0610 (ns); E1) and the average normalized nucleus area (orange bold line; n = 10) augmented from 164.85 ± 27.21 μm2 to 223.50 ± 43.19 μm2 (p-value = 0.0860 (ns); E2). The average nucleus-spread-area/cell-spread-area ratio changed from 0.29 ± 0.05 to 0.28 ± 0.05 (p-value = 0.7461 (ns)), with a trend-line slope of 0.0006 (E3). (F) YAP N/C ratio versus nucleus/cell-body area of non-spreading cells (n = 5). The average YAP N/C ratio (red bold line; n = 5) changed from 2.09 ± 0.09 to 2.03 ± 0.12 (p-value = 0.6335 (ns); F1), and the average cell area (blue bold line; n = 5) increased from 316.12 ± 42.58 μm2 to 333.75 ± 40.37 μm2 (p-value = 0.7455 (ns); F1). The average normalized nucleus area (orange bold line; n = 5) rose from 192.85 ± 15.71 μm2 to 218.17 ± 22.10 μm2 (p-value = 0.3271 (ns); F2) The average nucleus-spread-area/cell-spread-area ratio changed from 0.63 ± 0.05 to 0.66 ± 0.03 (p-value = 0.5575 (ns)), with a trend-line slope of 0.0051 (F3).
Fig 5
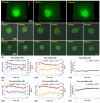
Fig 5. YAP N/C ratio and cell spreading states of single B2B cells on 40-kPa hydrogels substrates.
(A) 3D fluorescent YAP image stack of the single spreading B2B cell (B) at 0.5th, 5th and 10th hour. (B) 10-hr time-lapse filmstrip of a single B2B cell on 40-kPa substrates during the spreading process. Note: cell flattens down and YAP N/C ratio changes from 3.14 at 0th hour to 2.48 at 10th hour. (C) 10-hr time-lapse image stack of a non-spreading single cell. The YAP N/C ratio changed from 1.95 at 0th hour to 1.89 at 10th hour. (D) YAP N/C ratio compared with nucleus/cell-body area of single spreading cells (n = 10). The average YAP N/C ratio (red bold line; n = 10) changed from 2.53 ± 0.32 to 1.93 ± 0.12 (p-value = 0.0118 *; D1). The average normalized cell area (blue bold line; n = 10) increased from 988.25 ± 247.34 μm2 to 1082.84 ± 207.46 μm2 (p-value = 0.6487 (ns); D1) and the average normalized nucleus area (orange bold line; n = 10) augmented from 220.70 ± 41.35 μm2 to 262.37 ± 45.64 μm2 (p-value = 0.3220 (ns); D2). The average nucleus-spread-area/cell-spread-area ratio changed from 0.25 ± 0.05 to 0.26 ± 0.04 (p-value = 0.9317 (ns)), with a trend-line slope of 0.002 (D3). (E) YAP N/C ratio compared with nucleus/cell-body area of non-spreading cells (n = 5). The average YAP N/C ratio (red bold line; n = 5) changed from 2.16 ± 0.23 to 2.18 ± 0.19 (p-value = 0.9440 (ns); E1), and the average cell area (blue bold line; n = 5) changed from 379.36 ± 43.42 μm2 to 360.48 ± 37.97 (ns); E1). The average normalized nucleus area (orange bold line; n = 5) rose from 181.47 ± 39.09 μm2 to 234.02 ± 28.37 μm2 (p-value = 0.2585 (ns); E2). The average nucleus-spread-area/cell-spread-area ratio changed from 0.49 ± 0.06 to 0.61 ± 0.04 (p-value = 0.1091 (ns)), with a trend-line slope of 0.0147 (E3).
Fig 6
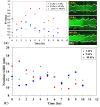
Fig 6. Comparison of the p-values of YAP N/C ratio on different stiffnesses of substrates during the first 10 hours of the spreading process.
(A) The p-values of the YAP N/C ratio on 2-kPa substrates and 5-kPa substrates (red dots) increased from 0.1725 at 0th hour to 0.9642 at 4th hour and decreased to 0.3103 at 10th hour. The p-values of the YAP N/C ratio between 5-kPa substrates and 40-kPa substrates (blue squares) showed a gradual decrease from 0.6271 at 0th hour to 0.1637 at 10th hour. The p-values of the YAP N/C ratio on 2-kPa substrates and 40-kPa substrates (green triangles) maintained stable at the first two hours and rose from 0.0955 at 2nd hour to 0.3668 at 4th hour. Next, the p-value declined to 0.0595 at 7th hour and increased to 0.2727 at 9th hour. At 10th hour, the p-value stayed at 0.0262 (*). Generally, when the difference of the two stiffnesses being compared is small (i.e., 2 kPa vs. 5 kPa), the p-value of the YAP N/C ratio is relatively larger over time. As the difference of the two stiffnesses increases (i.e., 2 kPa vs. 40 kPa), the p-value of the YAP N/C ratio declines. (B) Kymographs of single spreading B2B cells on 2-kPa, 5-kPa and 40-kPa substrates during the first 10 hours of the spreading process. The change of the position of the short white lines (time interval: 0.5 hrs.) on the graphs shows fluctuations of the nucleus area and fluorescence as cells are spreading. (C) The nucleus width of the single spreading B2B cells from (B) fluctuates over time. The fluctuation of the nucleus area changes the YAP density in nucleus, which may result in a fluctuation of YAP N/C ratio. This fluctuation of the YAP N/C ratio is reflected in the three groups of p-values in (A), which show fluctuating trends over time.
Fig 7
Fig 7. Comparison of the volume-based YAP N/C ratio on hydrogel substrates of different stiffnesses at the 10th hour of the spreading process.
(A) The 3D reconstruction image of YAP-mNeonGreen2-expressing B2B cells on 2 kPa (n = 9), 5 kPa (n = 6) and 40 kPa (n = 10) at 10th hour. YAP N/C ratio (N/C) for each cell is calculated based on the nuclear volume and cytoplasmic volume. Nuclear boundary and cell boundary are marked by orange and blue dashed line, respectively. (B) At 10th hour, volume-based YAP N/C ratio show significant difference between cells on 2 kPa and 40 kPa (* p-value = 0.038). At 10th hour, volume-based YAP N/C ratio show significant difference between cells on 5 kPa and 40 kPa (* p-value = 0.027). (C) Volume-based YAP N/C ratio is calculated from 3 slices of the z-stack of YAP images. The interval h between each slice is 0.78 μm. Within each slice, nuclear YAP integrated density (IN) and cytoplasmic YAP integrated density (IC) are recorded for an area from nucleus (AN) and an area from cytoplasm (AC), respectively.

Similar articles

Cited by

References

    1. Werley C, Boccardo S, Rigamonti A, Hansson E, Cohen A. Multiplexed Optical Sensors in Arrayed Islands of Cells for multimodal recordings of cellular physiology. Nat Commun. 2020;11(1):1–17. doi: 10.1038/s41467-019-13993-7 - DOI - PMC - PubMed
    1. Fan LZ, Kheifets S, Böhm UL, Wu H, Piatkevich KD, Xie ME, et al.. All-Optical Electrophysiology Reveals the Role of Lateral Inhibition in Sensory Processing in Cortical Layer 1. Cell. 2020;180(3):521–35. doi: 10.1016/j.cell.2020.01.001 - DOI - PMC - PubMed
    1. Dempsey GT, Chaudhary KW, Atwater N, Nguyen C, Brown BS, McNeish JD, et al.. Cardiotoxicity screening with simultaneous optogenetic pacing, voltage imaging and calcium imaging. J Pharmacol Toxicol Methods [Internet]. 2016;81:240–50. Available from: doi: 10.1016/j.vascn.2016.05.003 - DOI - PubMed
    1. Zhang H, Reichert E, Cohen A. Optical electrophysiology for probing function and pharmacology of voltage-gated ion channels. Elife. 2016;5:e15202. doi: 10.7554/eLife.15202 - DOI - PMC - PubMed
    1. Tang X, Bajaj P, Bashir R, Saif T. How far cardiac cells can see each other mechanically. Soft Matter. 2011;7(13):6151–8.

Publication types