. 2022 Jul 28;17(7):e0271414.
doi: 10.1371/journal.pone.0271414. eCollection 2022.

The dynamic network of IS30 transposition pathways

Affiliations

The dynamic network of IS30 transposition pathways

Ferenc Olasz et al. PLoS One. .

Abstract

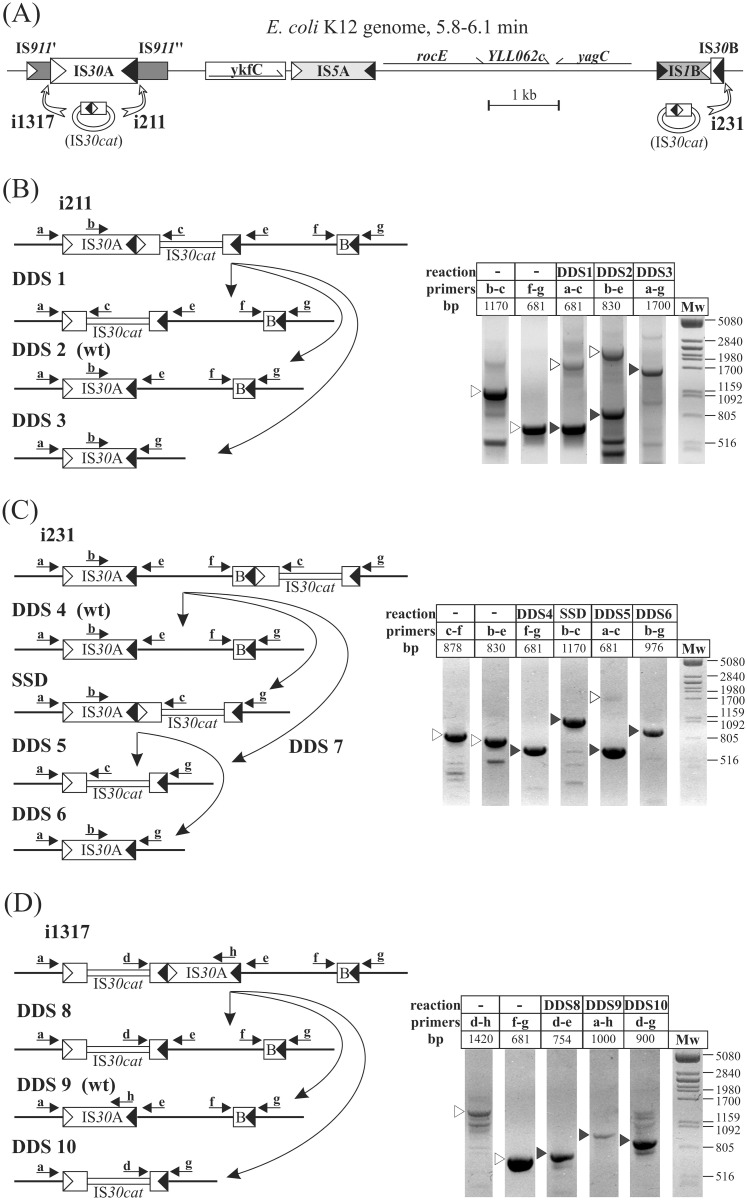
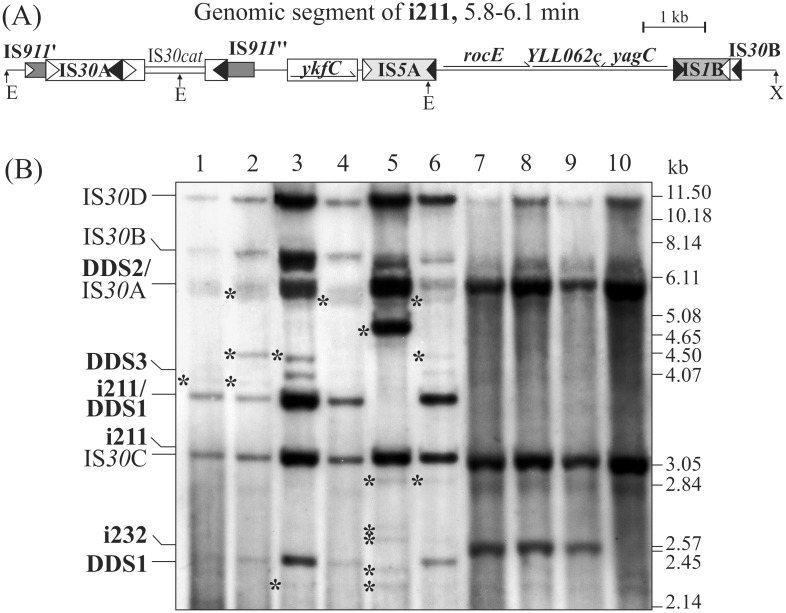
The E. coli element IS30 has adopted the copy-out-paste-in transposition mechanism that is prevalent in a number of IS-families. As an initial step, IS30 forms free circular transposition intermediates like IS minicircles or tandem IS-dimers by joining the inverted repeats of a single element or two, sometimes distantly positioned IS copies, respectively. Then, the active IR-IR junction of these intermediates reacts with the target DNA, which generates insertions, deletions, inversions or cointegrates. The element shows dual target specificity as it can insert into hot spot sequences or next to its inverted repeats. In this study the pathways of rearrangements of transposition-derived cointegrate-like structures were examined. The results showed that the probability of further rearrangements in these structures depends on whether the IS elements are flanked by hot spot sequences or take part in an IR-IR junction. The variability of the deriving products increases with the number of simultaneously available IRs and IR-IR joints in the cointegrates or the chromosome. Under certain conditions, the parental structures whose transposition formed the cointegrates are restored and persist among the rearranged products. Based on these findings, a novel dynamic model has been proposed for IS30, which possibly fits to other elements that have adopted the same transposition mechanism. The model integrates the known transposition pathways and the downstream rearrangements occurring after the formation of different cointegrate-like structures into a complex network. Important feature of this network is the presence of "feedback loops" and reversible transposition rearrangements that can explain how IS30 generates variability and preserves the original genetic constitution in the bacterial population, which contributes to the adaptability and evolution of host bacteria.


Conflict of interest statement

The authors have declared that no competing interests exist.

Figures

Fig 1
Fig 1. Schematic model of IS30 transposition.
(A) Molecular model of the formation of IS minicircles and IS-dimers (IS30)2. The IS element is delimited by open (IRL) and filled (IRR) triangles representing the 26-bp left and right inverted repeats, respectively. The two bases adjacent to the Tpase-generated nick next to the donor end are indicated by open circles. The two bases bordering the targeted end at the same strand are shown as filled circles. The free 3’OH ends (3’) are indicated. Note that the same reaction produces a Tn-circle that is formally equivalent to the (IS30)2 dimer, if the IRs of two IS30 copies are joined. (B) A mechanistic model of the two-step copy-out-paste-in transposition of IS30. The IS elements are shown as open boxes delimited by IRL and IRR. Thin line, donor replicon; thick line, target replicon. Solid and dashed arrows indicate transposition and non-transposition events, respectively. Dimer replicon may arise by homologous recombination. Letters show the order of genes and indicate inversion or deletion on the donor replicon (intramolecular transposition). One of the deletion products is not detectable if it cannot replicate (crossed). IS minicircle is frequently produced from a dimer via DDS, but any IS copy can also produce circular element via a SSD-like process.
Fig 2
Fig 2. Dynamics and pathways of IS30-mediated decomposition of cointegrates.
The fate of cointegrates were analysed in recA- hosts (TG2; panels A1, B1, C1, D1 and JM109; panels A2, B2) through approx. 50 generations with or without antibiotic selection for the plasmid markers. The relative frequencies of different phenotypes are shown on the graphs and the percent values are given underneath. The three phenotypes are marked as AR KR, AR KS and AS KR (ApRKmR, ApRKmS and ApSKmR, respectively). Panels A3, B3, C2 and D2 summarize the formation (the parental plasmids of the cointegrates are in curly brackets) and the main decomposition paths of the cointegrates observed in the different hosts and growth conditions. Thin line—p15A based KmR plasmid or part of the cointegrates, thick line–pMB1 based ApR plasmid or part of the cointegrates. The LHS hot spot sequence and its two halves interrupted by IS30 elements are shown by shaded circle or semicircles, respectively. Dashed arrows show the alternative SSD reactions in pAW1067. Thin arrows indicate the potential IR-targeting reactions in the original cointegrates, the circled numbers indicate the IR-targeting events and their results. Bracketed structures (designated as hypothetical–‘hyp’) were not isolated as individual plasmid species probably due to their low abundance or stability. Open rectangles below the linear plasmid maps represent different deletions identified (not in scale). Approximate size and the endpoints of deletions were determined by restriction mapping. Inverted regions are indicated, other symbols are as in Fig 1. (A) Decomposition of cointegrate pAW1067 in TG2 (A1) and JM109 (A2) host. (B) Decomposition of cointegrate pAW1072 in TG2 (B1) and JM109 (B2) host. Derivatives of pAW1072 are shown in panel B3. (C) Decomposition of cointegrate pFOL622. The pathways of rearrangements and the resulting plasmid species are summarized in panel C2. The two largest deletions isolated (marked by asterisk) could derive from pFOL622 or the undetected high copy intermediate (hyp 1). (D) Decomposition of cointegrate pAW1118. The plasmid derivatives are shown in (panel D2). Large deletions affecting both IR-IR junctions could derive from pAW1118, pFOL617 (*) or pFOL256 (**). The deletion products of pFOL256 marked with *** could arise in consecutive steps: regeneration of pAW1105 followed by targeting of backbone sequences by the new IR-IR junction. Since pAW1105 cannot code for Tpase, this reaction requires the enzyme synthesized from another plasmids or chromosomal IS30 copies [35].
Fig 3
Fig 3. Chromosomal rearrangements promoted by the IR-IR junctions formed by IS30cat insertions.
(A) The schematic map of the 5.8–6.1 min chromosomal region of E. coli K-12. The mobile elements or transposon-like sequences are shown as rectangles with different patterns. Open and filled triangles show IRL and IRR of the IS elements, respectively. The IS911 sequence is incomplete and interrupted by the insertion of IS30A (the two parts are indicated as IS911’ and IS911”). Other ORFs are shown as thin arrows. IS30B is a truncated copy including the last 184 bp of the element. The open arrows point to the integration sites where IS30cat inserted in the three TG2-derived strains i1317, i211 and i231. The map is based on the chromosome of E. coli K-12 W3110. (B-D) Genomic rearrangements in the population of descendants of strains i211 (B), i231 (C) and i1317 (D). Left panels show the expected products generated via targeting the IR ends by the active junctions (disregarding the IRs of other two resident IS30 copies, IS30C and IS30D, which locates far from this region, consequently, the reaction with their IRs would generate large chromosomal deletions that are most likely lethal for the host cell). The right panels show the products of PCRs designed to detect the original constitution (open arrowheads) or the expected rearrangements (SSD and DDS1-10, filled arrowheads). Lettered arrows show the positions and directions of primers on the graphs. The primer pairs used in PCRs and the expected fragment sizes are shown above the lanes. DDS reactions restoring the genomic state prior to IS30cat insertion in each strain are marked as wt. Note that in i231, DDS5 and DDS7 lead to the same product. For uncropped images, see S2B-S2D Fig in S1 File.
Fig 4
Fig 4. Southern analysis of rearrangements in i211 and i232 insertion strains.
(A) The schematic map of the 5.8–6.1 min genomic region of E. coli TG2 derived strain i211, where IS30cat has inserted next to the IRR of IS30A. Symbols are as in Fig 3A. (B) A representative set of genomic DNA samples of individual clones derived from the descendants of i211 (lanes 1–6) and i232 (lanes 7–9). Lane 10 –total DNA of strain TG2. The total DNA digested with EcoRI-XhoI (E and X indicates the respective restriction sites on panel A) were hybridized to a full length IS30 probe. Bands representing the resident IS30 copies are indicated as IS30A-D, while those referring to the original insertion or the expected DDS derivatives are in bold. Unidentified hybridizing bands (marked by asterisks) may represent insertions, deletions, or inversions. In contrast, i232, where the IS30cat insertion occurred at a chromosomal hot spot (lanes 7–9) did not produce any rearranged products. For uncropped image, see S3 Fig in S1 File.
Fig 5
Fig 5. The dynamic model of IS30 transposition.
The model integrates the results of this work and those published previously [–22]. The reversible IR-targeting events (shown by thin arrows) always produce molecule species that carry an active IR-IR junction (shown as red) and define a closed circuit. HS-targeting events (shown by thick dashed arrows) provide the break-out pathways and produce the “classical” transposition products, like insertion, deletion, inversion, or replicon fusion (shown as black). These rearrangements are irreversible and produce stable molecule species. One of the two deletion products generally has no replication origin, so it is not detectable (crossed out). Dotted arrows represent consecutive steps of a non-transpositional (formation of dimer replicon by homologous recombination or partial replication) and a transpositional (SSD) process resulting in an IS-dimer. Note that minicircles do not only derive as products of DDSs, but can emerge from any IS-containing replicon via an SSD reaction (not indicated) [16, 19]. Apart from minicircles and some deletion products most components of the network can replicate and survive even many cell cycles ensuring that many different plasmid species and/or chromosome can occur in the same bacterial population. The classical cointegrate structure (shown as green) may have an important role in maintaining the network. It is stable enough to spread in the whole population and can produce active structures (IS-dimer) via a single SSD reaction, by which it can be the start point of bursts of rearrangements in different cells in the population.

Similar articles

Cited by

References

    1. Dalrymple B. Novel rearrangements of IS 30 carrying plasmids leading to the reactivation of gene expression. MGG Mol Gen Genet. 1987;207: 413–420. doi: 10.1007/BF00331609 - DOI - PubMed
    1. Szeverényi I, Hodel A, Arber W, Olasz F. Vector for IS element entrapment and functional characterization based on turning on expression of distal promoterless genes. Gene. 1996;174: 103–110. doi: 10.1016/0378-1119(96)00407-6 - DOI - PubMed
    1. Vandecraen J, Chandler M, Aertsen A, Van Houdt R. The impact of insertion sequences on bacterial genome plasticity and adaptability. Crit Rev Microbiol. 2017;43: 709–730. doi: 10.1080/1040841X.2017.1303661 - DOI - PubMed
    1. Vallenet D, Nordmann P, Barbe V, Poirel L, Mangenot S, Bataille E, et al.. Comparative analysis of acinetobacters: Three genomes for three lifestyles. PLoS One. 2008;3. doi: 10.1371/journal.pone.0001805 - DOI - PMC - PubMed
    1. Siguier P, Gourbeyre E, Chandler M. Bacterial insertion sequences: Their genomic impact and diversity. FEMS Microbiol Rev. 2014;38: 865–891. doi: 10.1111/1574-6976.12067 - DOI - PMC - PubMed

Publication types

Substances