. 2022 Jul 28;17(7):e0272298.
doi: 10.1371/journal.pone.0272298. eCollection 2022.

Optimization and evaluation of a live virus SARS-CoV-2 neutralization assay

Affiliations

Optimization and evaluation of a live virus SARS-CoV-2 neutralization assay

Anders Frische et al. PLoS One. .

Abstract

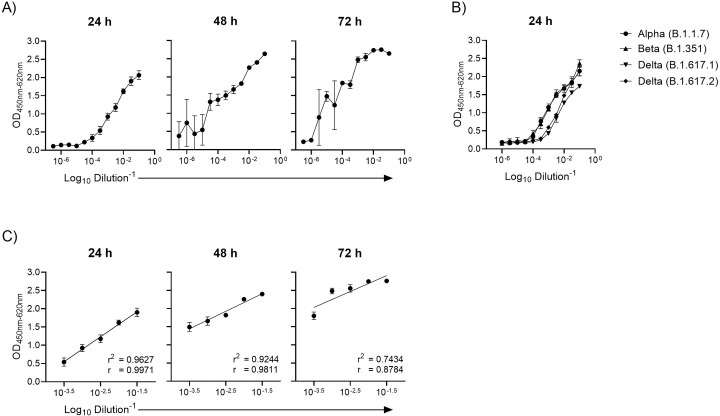
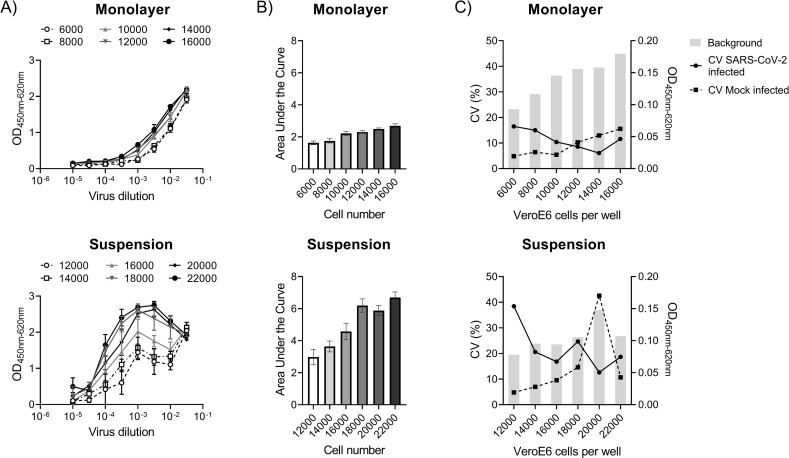
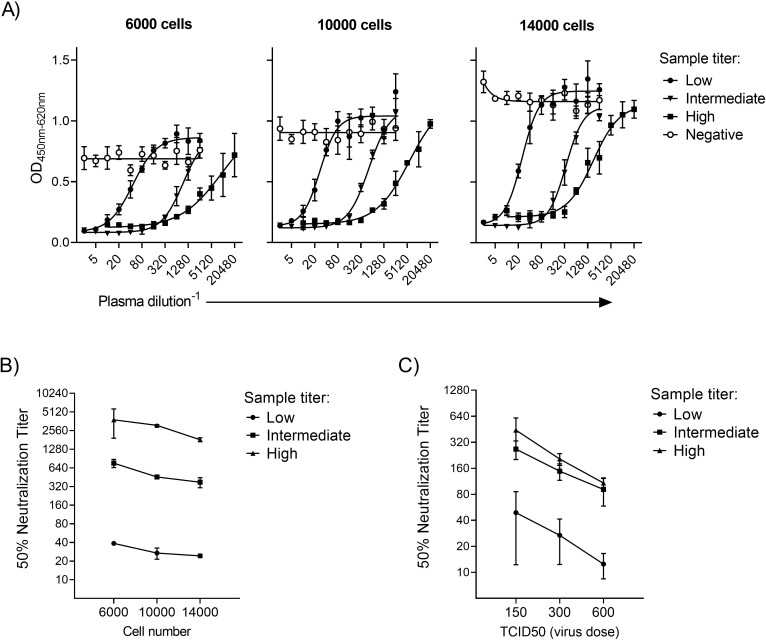
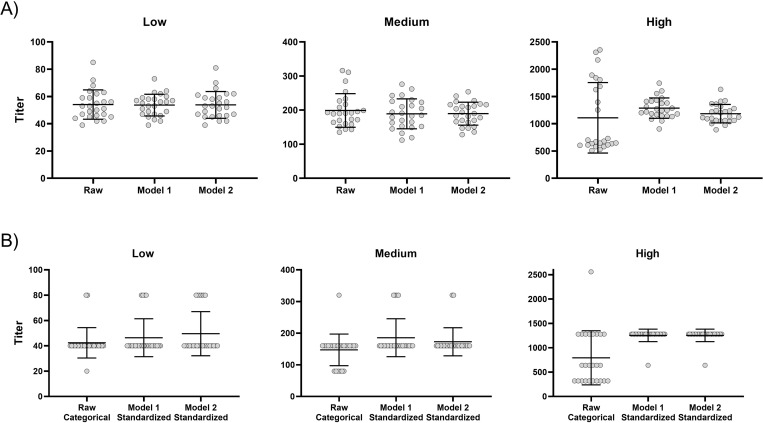
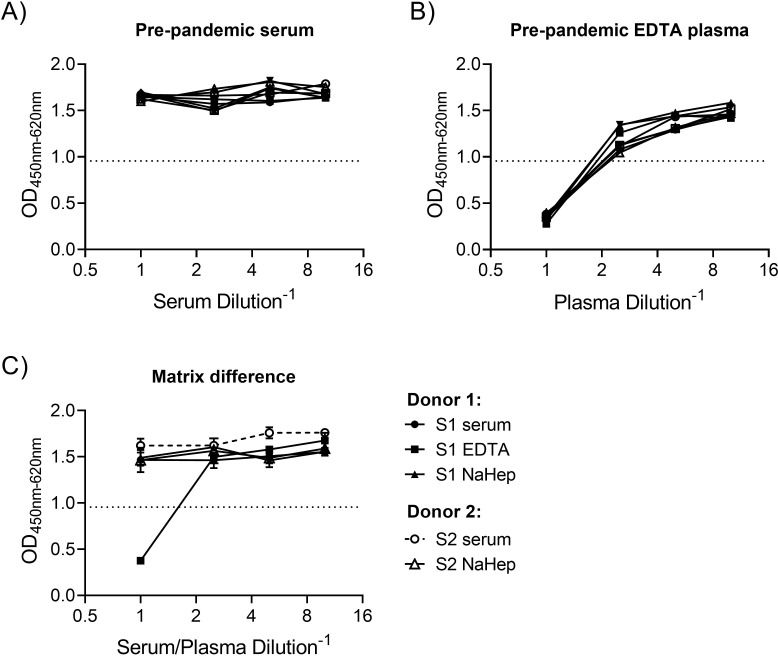
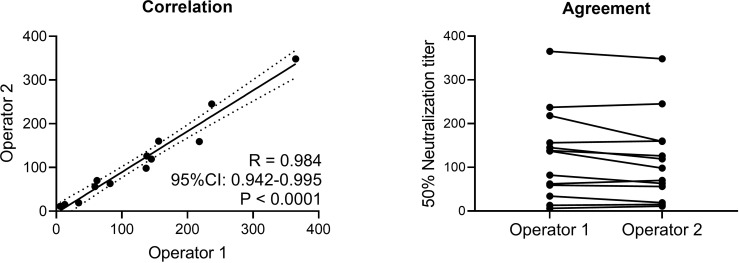
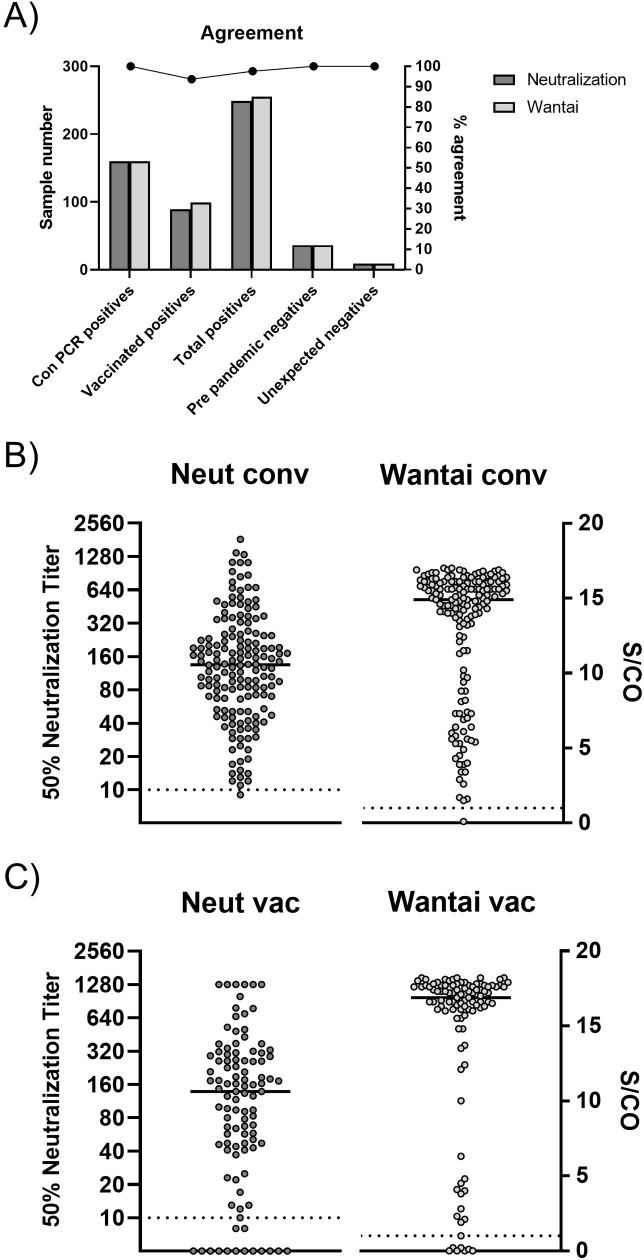
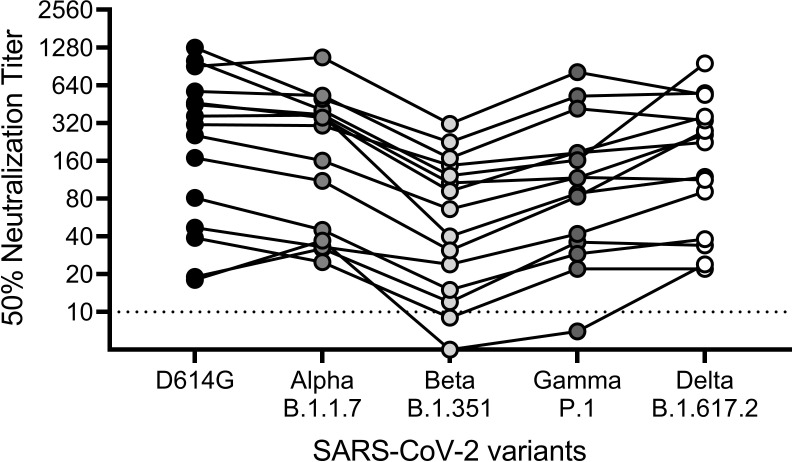
Virus neutralization assays provide a means to quantitate functional antibody responses that block virus infection. These assays are instrumental in defining vaccine and therapeutic antibody potency, immune evasion by viral variants, and post-infection immunity. Here we describe the development, optimization and evaluation of a live virus microneutralization assay specific for severe acute respiratory syndrome coronavirus 2 (SARS-CoV-2). In this assay, SARS-CoV-2 clinical isolates are pre-incubated with serial diluted antibody and added to Vero E6 cells. Replicating virus is quantitated by enzyme-linked immunosorbent assay (ELISA) targeting the SARS-CoV-2 nucleocapsid protein and the standardized 50% virus inhibition titer calculated. We evaluated critical test parameters that include virus titration, assay linearity, number of cells, viral dose, incubation period post-inoculation, and normalization methods. Virus titration at 96 hours was determined optimal to account for different growth kinetics of clinical isolates. Nucleocapsid protein levels directly correlated with virus inoculum, with the strongest correlation at 24 hours post-inoculation. Variance was minimized by infecting a cell monolayer, rather than a cell suspension. Neutralization titers modestly decreased with increasing numbers of Vero E6 cells and virus amount. Application of two different normalization models effectively reduced the intermediate precision coefficient of variance to <16.5%. The SARS-CoV-2 microneutralization assay described and evaluated here is based on the influenza virus microneutralization assay described by WHO, and are proposed as a standard assay for comparing neutralization investigations.


Conflict of interest statement

The authors have declared that no competing interests exist.

Figures

Fig 1
Fig 1. Relationship between virus inoculum size and SARS-CoV-2 nucleocapsid protein measured at 24, 48 and 72 hours post-inoculation.
(A) A serial dilution of SARS-CoV-2 early pandemic strain (lineage B.1) was transferred from a master stock to three identical cell culture plates seeded with 104 Vero E6 cells per well the preceding day. An anti-SARS-CoV-2 nucleocapsid ELISA was performed on washed and fixed cells after 24, 48 and 72 hours. Each data point represents the mean of quadruplicate measurements with the standard deviation. ELISA primary antibody: rabbit mAb 40143-R019. (B) Different SARS-CoV-2 variants of concern treated as described in (A) show a similar linear relationship between inoculum and nucleocapsid protein levels measured by ELISA 24 hours post-inoculation. The comparison between strains was done on the same day using a single dilution for each serum sample. ELISA primary antibody: mouse mAb BSM-41414M. (C) Linear regression and Pearson correlation test of virus inoculum size and SARS-CoV-2 nucleocapsid protein level in the quantification range from a dilution of 10−3.5 to 10−1.5. r2 = Goodness of fit. r = Pearson correlation coefficient. Error bars represent standard deviations of replicate determinations.
Fig 2
Fig 2. Effect of Vero E6 cell number and morphology on the relationship between SARS-CoV-2 nucleocapsid protein measured by ELISA and SARS-CoV-2 virus inoculum.
Triplicate serial dilutions (0.5 log10-fold) of a Danish SARS-CoV-2 clinical isolate (early pandemic strain (lineage B.1)) was added to increasing numbers of Vero E6 cells in a monolayer or in suspension. The cell numbers indicated for the monolayer are as seeded the day prior to the infection. On the day of infection, the seeded cell numbers– 6000, 8000, 10000, 12000, 14000, and 16000 –increased to 12000, 14000, 16000, 18000, 20000, and 22000, respectively. The latter cell numbers were used for the infection of suspended cells to ensure a similar multiplicity of infection for the monolayers. (A) SARS-CoV-2 virus titration curve for different cell numbers infected in a monolayer and suspension. Symbols indicate the mean and error bars the standard deviation. (B) The overall SARS-CoV-2 nucleocapsid protein signal measured for the virus dilution series, expressed as area under the curve for the Log10 decimal virus dilution and ELISA OD value as a measure of the magnitude of variance associated with changes in cell number (shown in A). Error bars represent the 95% confidence interval. (C) The percentage coefficient of variation (CV) for SARS-CoV-2 infected and mock infected cells as well as the background anti-SARS-CoV-2 nucleocapsid protein level measured for mock infected cells. For all experiments, ELISA primary antibody: rabbit mAb 40143-R019.
Fig 3
Fig 3. Effect of variable Vero E6 cell number and virus amount on assay sensitivity.
(A) Four serum samples of known neutralization titer (negative, 1:10, 1:160 and 1:1280) were tested in the neutralization assay (early pandemic strain (lineage B.1)) with different Vero E6 cell numbers seeded the day prior (6000, 10000, or 14000). Lines represent the four-parameter titration curve calculated from the mean of triplicate measurements. (B) Neutralization titers for assays using 6000, 10000 and 14000 cells seeded the day prior. (C) Neutralization titers for three samples from assays using 10000 cells and different amounts of input virus (150, 300 and 600 TCID50). Each data point represent the mean of triplicate determinations with standard deviation. For all experiments, ELISA primary antibody: rabbit mAb 40143-R019.
Fig 4
Fig 4. Distribution of raw and normalized results from a precision study.
Scatterplots of exact titers (A) and categorical/ standardized titers (B) from replicate determinations in the low, medium and high titered sample groups from raw data, data normalized using model 1 and data normalized using model 2. Bars represent global mean and standard deviation. Exact titer = titer calculated according to a four-parameter logistic regression curve fit from non-normalized (raw data) or normalized OD-values; Categorical titer = the highest serum dilution positive for neutralization activity determined from non-normalized OD-values (raw data); Standardized titer = the closest standard dilution factor on a log2 scale starting from a 1:10 dilution calculated from normalized OD-values. Virus: early pandemic strain (lineage B.1). For all precision study experiments, ELISA primary antibody: rabbit mAb 40143-R019.
Fig 5
Fig 5. Sample matrix influence on specificity.
(A) Neutralization activity on 8 negative pre-pandemic serum samples, and (B) 8 negative EDTA plasma samples run in duplicates and run undiluted, 1:2.5, 1:5 and 1:10. (C) Neutralization activity on serum, EDTA or sodium heparin (NaHep) samples collected from two donors on the same day tested in duplicate and run undiluted, 1:2.5, 1:5 and 1:10. Virus: early pandemic strain (lineage B.1). Error bars represent standard deviations of duplicate determinations. ELISA primary antibody: rabbit mAb 40143-R019.
Fig 6
Fig 6. Operator-derived variation.
Two operators tested the same clinical samples. Correlation and agreement between neutralization titers measured were assessed. ELISA primary antibody: rabbit mAb 40143-R019.
Fig 7
Fig 7. Agreement and data distribution of neutralizing antibody and total antibody results.
Qualitative result comparison between SARS-CoV-2 virus neutralization qualitative results and Wantai Total Antibody ELISA kit results for the cohort of PCR confirmed positive convalescent plasma samples, SARS-CoV-2 vaccinated individuals and pre-pandemic samples (A). Distribution of 50% neutralization titers from the neutralization assay and sample over cut off (S/CO) from the Wantai ELISA from convalescent plasma (B) and SARS-CoV-2 vaccinated individuals (C). Bars represent mean, dotted lines represent assay cut off. ELISA primary antibody: (B) rabbit mAb 40143-R019; (C) mouse mAb BSM-41414M.
Fig 8
Fig 8. Virus neutralization of SARS-CoV-2 variants of concern.
Virus neutralization titers for SARS-CoV-2 convalescent sera against four SARS-CoV-2 variants of concern–Alpha (B.1.1.7), Beta (B.1.351), Gamma (P.1) and Delta (B.1.617.2)–relative to an early pandemic strain (D614G). The comparison between strain variants was done on the same day using a single dilution for each serum sample. ELISA primary antibody: mouse mAb BSM-41414M.

References

    1. Corbett KS, Nason MC, Flach B, Gagne M, O’Connell S, Johnston TS, et al. Immune correlates of protection by mRNA-1273 vaccine against SARS-CoV-2 in nonhuman primates. Science. 2021;373(6561):eabj0299. doi: 10.1126/science.abj0299 - DOI - PMC - PubMed
    1. Muruato AE, Fontes-Garfias CR, Ren P, Garcia-Blanco MA, Menachery VD, Xie X, et al. A high-throughput neutralizing antibody assay for COVID-19 diagnosis and vaccine evaluation. Nat Commun. 2020;11(1):1–6. DOI: 10.1038/s41467-020-17892-0 - DOI - PMC - PubMed
    1. Sehr P, Rubio I, Seitz H, Putzker K, Ribeiro-Müller L, Pawlita M, et al. High-Throughput Pseudovirion-Based Neutralization Assay for Analysis of Natural and Vaccine-Induced Antibodies against Human Papillomaviruses. PLoS One. 2013;8(10):1–11. doi: 10.1371/journal.pone.0075677 - DOI - PMC - PubMed
    1. Selvarajah S, Puffer B, Pantophlet R, Law M, Doms RW, Burton DR. Comparing Antigenicity and Immunogenicity of Engineered gp120. J Virol. 2005;79(19):12148–63. doi: 10.1128/JVI.79.19.12148-12163.2005 - DOI - PMC - PubMed
    1. Lin Y, Gu Y, Wharton SA, Whittaker L, Gregory V, Li X, et al. Optimisation of a micro-neutralisation assay and its application in antigenic characterisation of influenza viruses. Influenza Other Respi Viruses. 2015;9(6):331–40. doi: 10.1111/irv.12333 - DOI - PMC - PubMed

Publication types