

LDL retention time in plasma can be -based on causation- estimated by the lipid composition of LDL and other lipoproteins
- PMID: 35901111
- PMCID: PMC9333322
- DOI: 10.1371/journal.pone.0272050
LDL retention time in plasma can be -based on causation- estimated by the lipid composition of LDL and other lipoproteins
Abstract
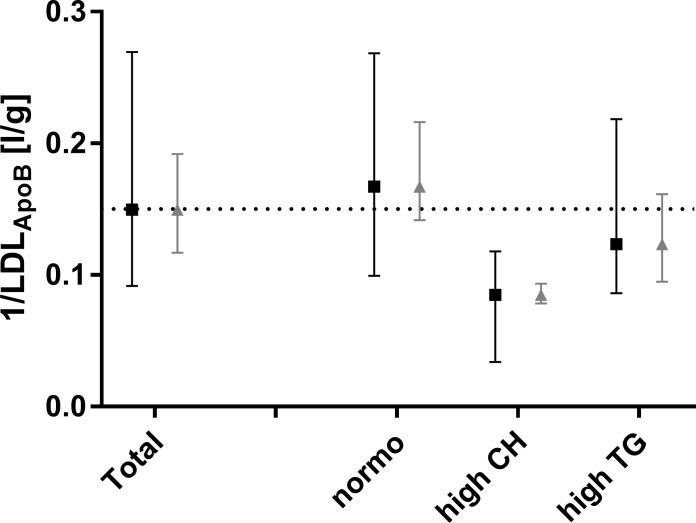
Introduction: Information on LDL's dynamic behaviour of LDL (i.e. production rate and fractional catabolic rate) are of interest if pathologies, lipid-lowering strategies or LDL-metabolism itself are investigated. Determination of these rates is costly and elaborate. Here we studied the interrelationship of LDL mass, its composition and other lipoproteins. Based on this data, we deducted information about LDL's dynamic behaviour.
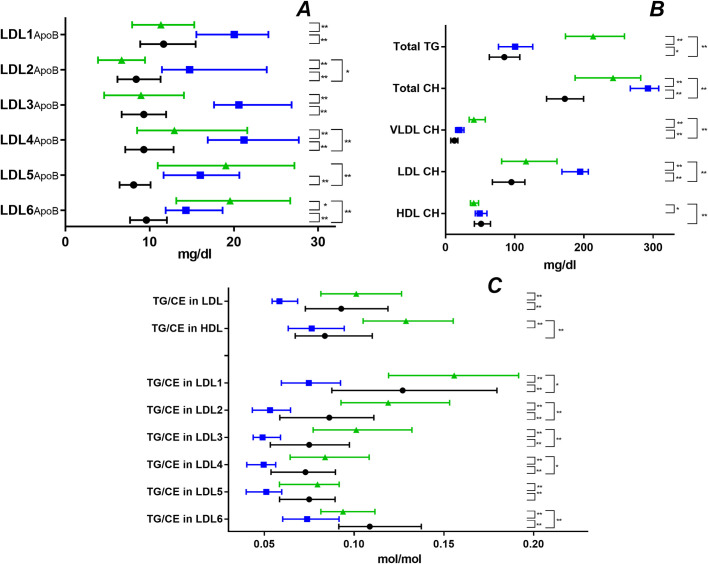
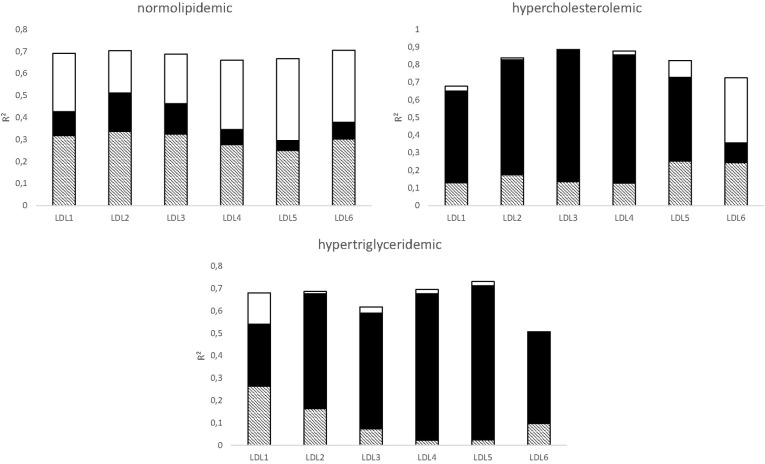
Methods: Lipoprotein profiles of n = 236 participants are evaluated. Plasma was separated by sequential ultracentrifugation into VLDL, IDL, LDL and HDL. Additionally, LDL and HDL were separated into subfractions. Stepwise multiple linear regressions were used to study LDL's ApoB mass and lipid composition. Relying on these results and on causation, we constructed a mathematical model to estimate LDL's retention time.
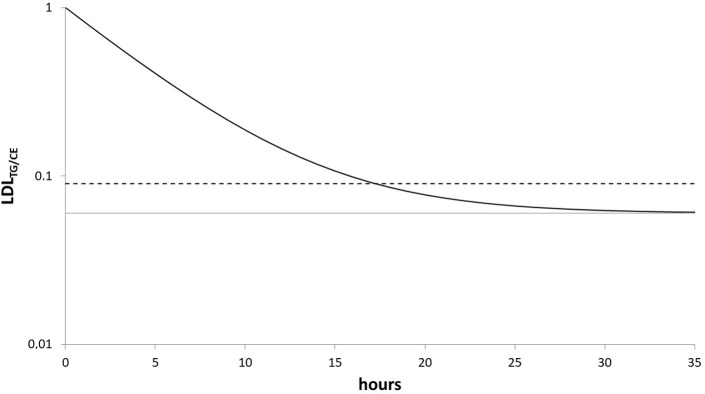
Results: The ApoB mass in LDL correlated best among all measured parameters (including corresponding lipid compositions but using no LDL-associated parameters) with the cholesterol ester content in IDL. TG/CE ratios in LDL's subfractions were strongly correlated with the corresponding ratios in IDL and HDL. The constructed mathematical model links the TG/CE ratio of LDL and HDL to LDL's ApoB concentration and enables a good estimate of LDL's retention time in plasma.
Discussion: Relying on our statistic evaluations, we assume that i) the production of nascent LDL via IDL as well as ii) LDL's prolonged retention are mapped by the TG/CE ratio in LDL subfractions. HDL's TG/CE ratio is associated with the change in LDL's TG/CE ratio during its retention in plasma. Our mathematical model uses this information and enables-by relying on causation- a good estimation of LDL's retention time.
Conflict of interest statement
The authors have declared that no competing interests exist.
Figures
Similar articles
-
Preferential reduction of very low density lipoprotein-1 particle number by fenofibrate in type IIB hyperlipidemia: consequences for lipid accumulation in human monocyte-derived macrophages.Atherosclerosis. 2001 Mar;155(1):251-60. doi: 10.1016/s0021-9150(00)00634-1. Atherosclerosis. 2001. PMID: 11223449 Clinical Trial.
-
Apolipoprotein B metabolism and the distribution of VLDL and LDL subfractions.J Lipid Res. 2000 Feb;41(2):305-18. J Lipid Res. 2000. PMID: 10681415
-
Hyperbetalipoproteinemia with small low-density lipoprotein, a characteristic disorder of lipoprotein in essential hypertension.J Diabetes Complications. 1995 Oct-Dec;9(4):227-9. doi: 10.1016/1056-8727(95)80008-3. J Diabetes Complications. 1995. PMID: 8573733
-
[Recent trends in research on lipoprotein metabolism].Nihon Rinsho. 1994 Dec;52(12):3073-8. Nihon Rinsho. 1994. PMID: 7853691 Review. Japanese.
-
Atherogenic circulating lipoproteins in ischemic stroke.Front Cardiovasc Med. 2024 Dec 6;11:1470364. doi: 10.3389/fcvm.2024.1470364. eCollection 2024. Front Cardiovasc Med. 2024. PMID: 39713216 Free PMC article. Review.
Cited by
-
Extracellular vesicle and lipoprotein diagnostics (ExoLP-Dx) with membrane sensor: A robust microfluidic platform to overcome heterogeneity.Biomicrofluidics. 2024 Jul 24;18(4):041301. doi: 10.1063/5.0218986. eCollection 2024 Jul. Biomicrofluidics. 2024. PMID: 39056024 Free PMC article.
-
Measurement of Serum Low Density Lipoprotein Cholesterol and Triglyceride-Rich Remnant Cholesterol as Independent Predictors of Atherosclerotic Cardiovascular Disease: Possibilities and Limitations.Nutrients. 2023 May 5;15(9):2202. doi: 10.3390/nu15092202. Nutrients. 2023. PMID: 37432317 Free PMC article. Review.
References
-
- Bagdade JD, Lane JT, Stone N, Ritter MC, Subbaiah PV. Persistent abnormalities in lipoprotein composition and cholesteryl ester transfer following lovastatin treatment. Journal of lipid research. 1990;31(7):1263–9. Epub 1990/07/01. - PubMed
-
- Capell WH, Zambon A, Austin MA, Brunzell JD, Hokanson JE. Compositional differences of LDL particles in normal subjects with LDL subclass phenotype A and LDL subclass phenotype B. Arteriosclerosis, thrombosis, and vascular biology. 1996;16(8):1040–6. Epub 1996/08/01. doi: 10.1161/01.atv.16.8.1040 - DOI - PubMed
MeSH terms
Substances
LinkOut - more resources
Full Text Sources
Miscellaneous
