

Disparities in distribution of COVID-19 vaccines across US counties: A geographic information system-based cross-sectional study
- PMID: 35901171
- PMCID: PMC9333439
- DOI: 10.1371/journal.pmed.1004069
Disparities in distribution of COVID-19 vaccines across US counties: A geographic information system-based cross-sectional study
Abstract
Background: The US Centers for Disease Control and Prevention has repeatedly called for Coronavirus Disease 2019 (COVID-19) vaccine equity. The objective our study was to measure equity in the early distribution of COVID-19 vaccines to healthcare facilities across the US. Specifically, we tested whether the likelihood of a healthcare facility administering COVID-19 vaccines in May 2021 differed by county-level racial composition and degree of urbanicity.
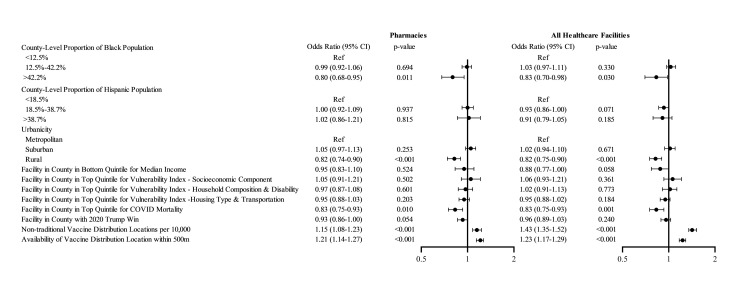
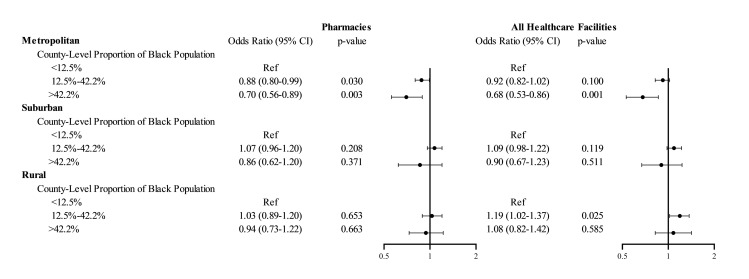
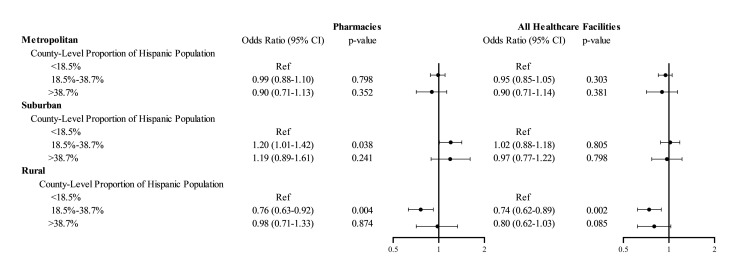
Methods and findings: The outcome was whether an eligible vaccination facility actually administered COVID-19 vaccines as of May 2021, and was defined by spatially matching locations of eligible and actual COVID-19 vaccine administration locations. The outcome was regressed against county-level measures for racial/ethnic composition, urbanicity, income, social vulnerability index, COVID-19 mortality, 2020 election results, and availability of nontraditional vaccination locations using generalized estimating equations. Across the US, 61.4% of eligible healthcare facilities and 76.0% of eligible pharmacies provided COVID-19 vaccinations as of May 2021. Facilities in counties with >42.2% non-Hispanic Black population (i.e., > 95th county percentile of Black race composition) were less likely to serve as COVID-19 vaccine administration locations compared to facilities in counties with <12.5% non-Hispanic Black population (i.e., lower than US average), with OR 0.83; 95% CI, 0.70 to 0.98, p = 0.030. Location of a facility in a rural county (OR 0.82; 95% CI, 0.75 to 0.90, p < 0.001, versus metropolitan county) or in a county in the top quintile of COVID-19 mortality (OR 0.83; 95% CI, 0.75 to 0.93, p = 0.001, versus bottom 4 quintiles) was associated with decreased odds of serving as a COVID-19 vaccine administration location. There was a significant interaction of urbanicity and racial/ethnic composition: In metropolitan counties, facilities in counties with >42.2% non-Hispanic Black population (i.e., >95th county percentile of Black race composition) had 32% (95% CI 14% to 47%, p = 0.001) lower odds of serving as COVID administration facility compared to facilities in counties with below US average Black population. This association between Black composition and odds of a facility serving as vaccine administration facility was not observed in rural or suburban counties. In rural counties, facilities in counties with above US average Hispanic population had 26% (95% CI 11% to 38%, p = 0.002) lower odds of serving as vaccine administration facility compared to facilities in counties with below US average Hispanic population. This association between Hispanic ethnicity and odds of a facility serving as vaccine administration facility was not observed in metropolitan or suburban counties. Our analyses did not include nontraditional vaccination sites and are based on data as of May 2021, thus they represent the early distribution of COVID-19 vaccines. Our results based on this cross-sectional analysis may not be generalizable to later phases of the COVID-19 vaccine distribution process.
Conclusions: Healthcare facilities in counties with higher Black composition, in rural areas, and in hardest-hit communities were less likely to serve as COVID-19 vaccine administration locations in May 2021. The lower uptake of COVID-19 vaccinations among minority populations and rural areas has been attributed to vaccine hesitancy; however, decreased access to vaccination sites may be an additional overlooked barrier.
Conflict of interest statement
I have read the journal’s policy and the authors of this manuscript have the following competing interests: IH reports consulting fees from Pfizer, outside of the submitted work.
Figures
References
-
- National Academies of Sciences, Engineering, and Medicine, Health and Medicine Division; Board on Population Health and Public Health Practice, et al. The National Academies Collection: Reports funded by National Institutes of Health. In: Kahn B, Brown L, Foege W, Gayle H, editors. Framework for Equitable Allocation of COVID-19 Vaccine. Washington (DC): National Academies Press (US) Copyright 2020 by the National Academy of Sciences. All rights reserved; 2020. - PubMed
MeSH terms
Substances
LinkOut - more resources
Full Text Sources
Medical
