. 2022 Jul 28;17(7):e0271723.
doi: 10.1371/journal.pone.0271723. eCollection 2022.

An evolutionary machine learning algorithm for cardiovascular disease risk prediction

Affiliations

An evolutionary machine learning algorithm for cardiovascular disease risk prediction

Mohammad Ordikhani et al. PLoS One. .

Abstract

Introduction: This study developed a novel risk assessment model to predict the occurrence of cardiovascular disease (CVD) events. It uses a Genetic Algorithm (GA) to develop an easy-to-use model with high accuracy, calibrated based on the Isfahan Cohort Study (ICS) database.

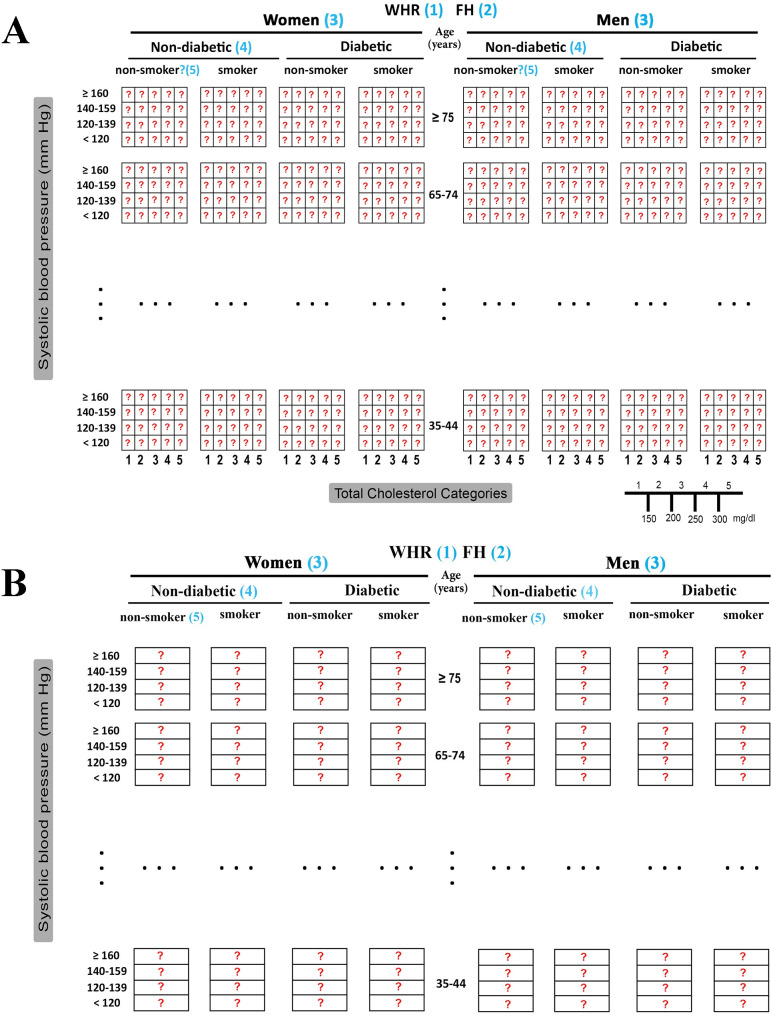
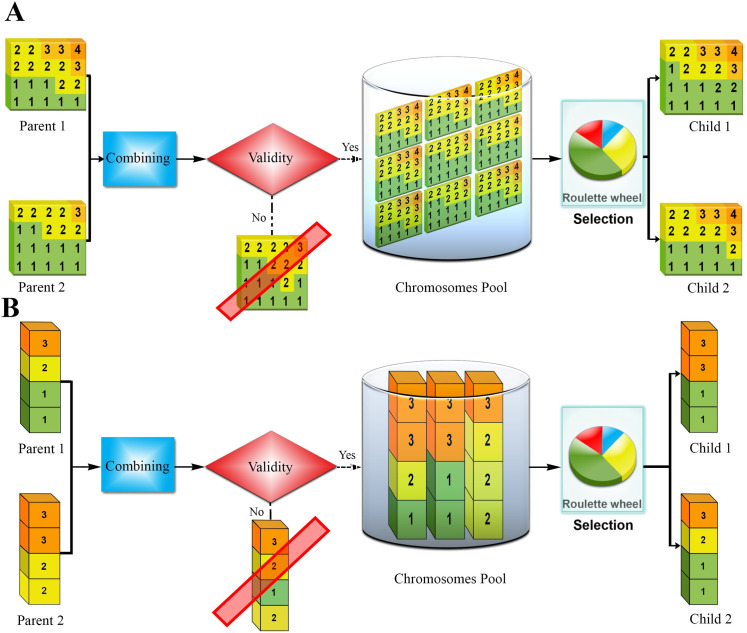
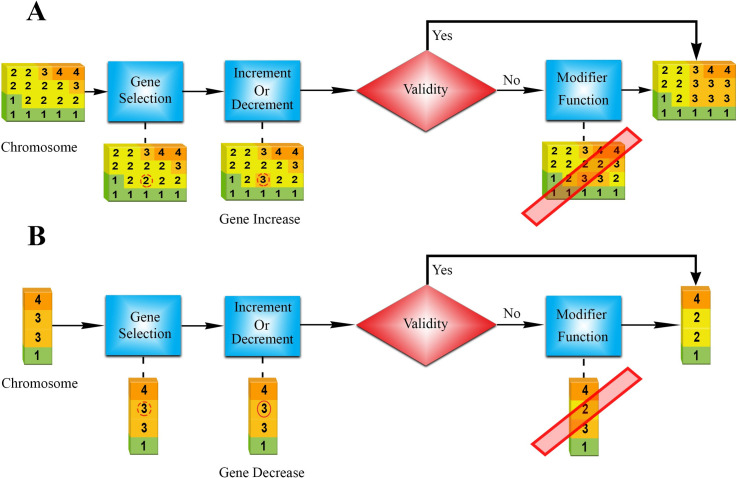
Methods: The ICS was a population-based prospective cohort study of 6,504 healthy Iranian adults aged ≥ 35 years followed for incident CVD over ten years, from 2001 to 2010. To develop a risk score, the problem of predicting CVD was solved using a well-designed GA, and finally, the results were compared with classic machine learning (ML) and statistical methods.

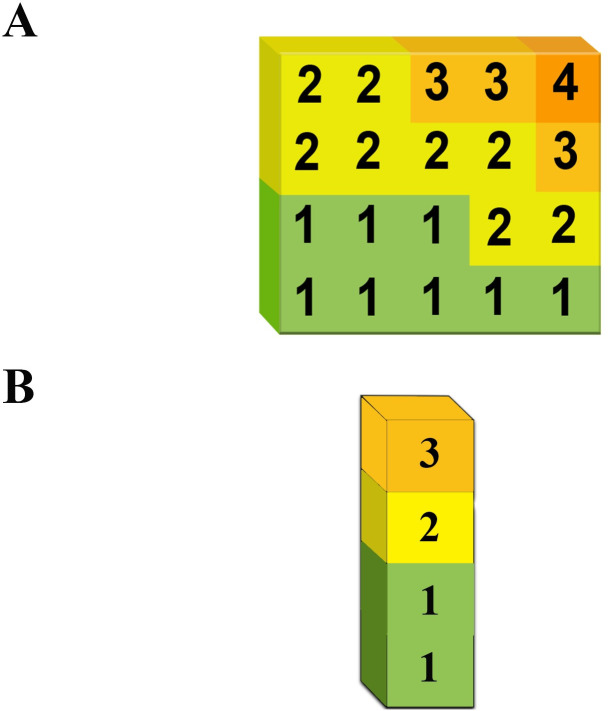
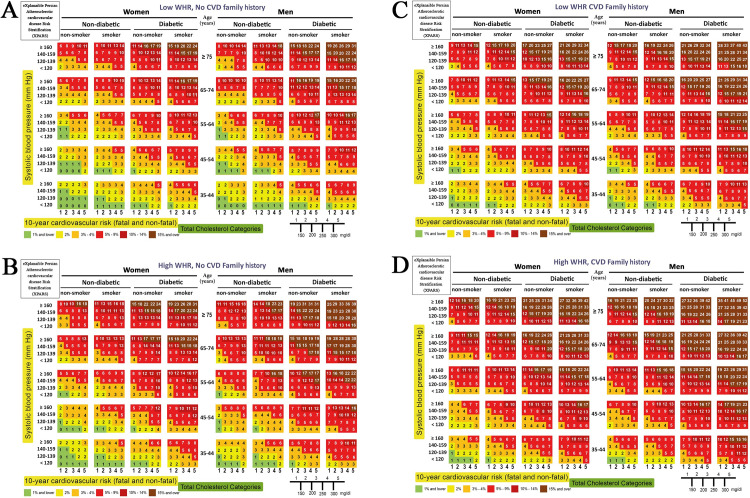
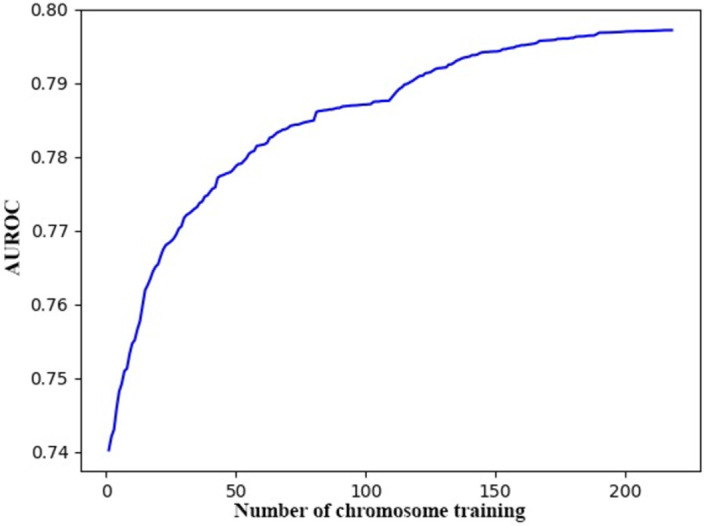
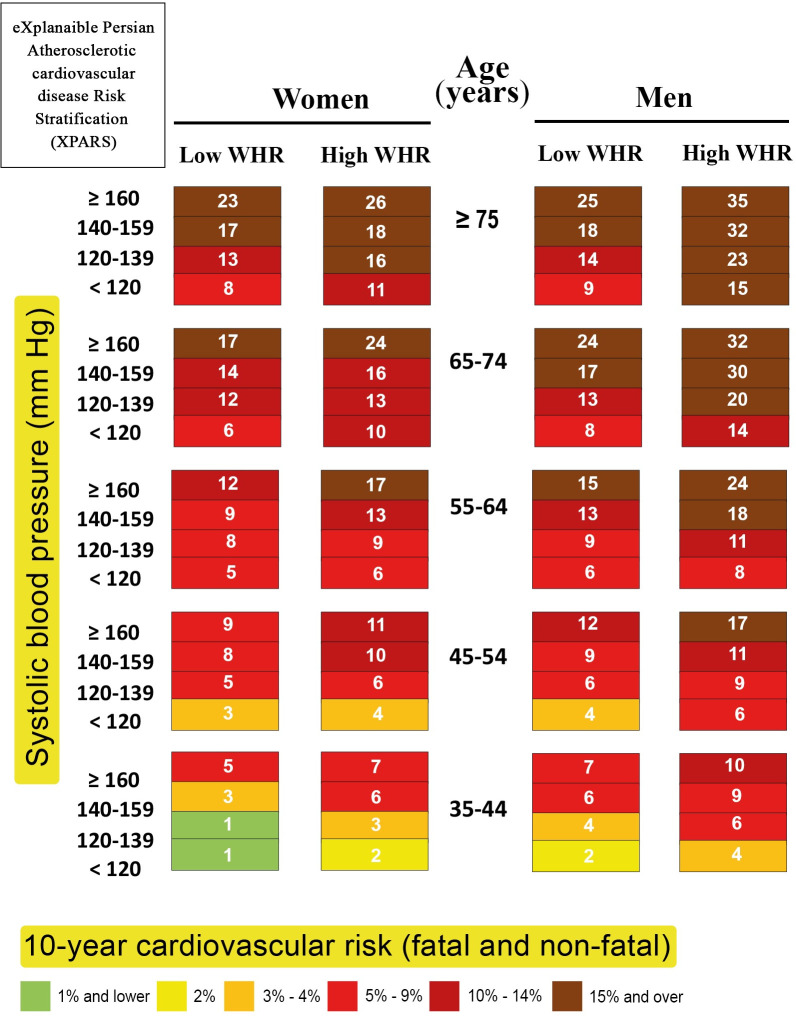
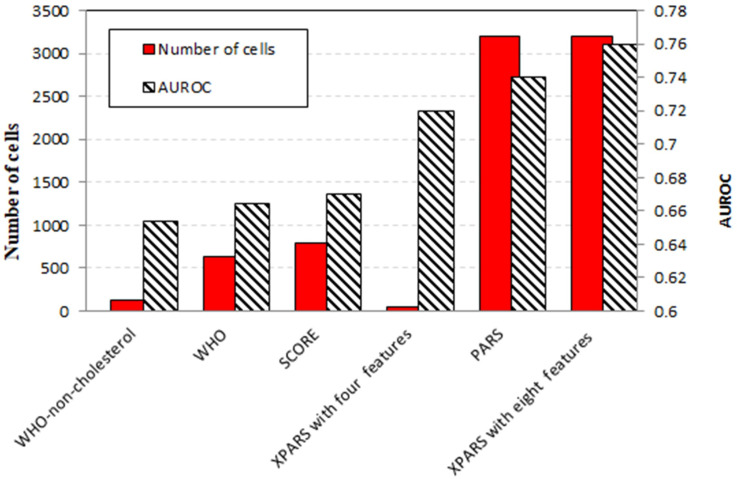
Results: A number of risk scores such as the WHO, and PARS models were utilized as the baseline for comparison due to their similar chart-based models. The Framingham and PROCAM models were also applied to the dataset, with the area under a Receiver Operating Characteristic curve (AUROC) equal to 0.633 and 0.683, respectively. However, the more complex Deep Learning model using a three-layered Convolutional Neural Network (CNN) performed best among the ML models, with an AUROC of 0.74, and the GA-based eXplanaible Persian Atherosclerotic CVD Risk Stratification (XPARS) showed higher performance compared to the statistical methods. XPARS with eight features showed an AUROC of 0.76, and the XPARS with four features, showed an AUROC of 0.72.

Conclusion: A risk model that is extracted using GA substantially improves the prediction of CVD compared to conventional methods. It is clear, interpretable and can be a suitable replacement for conventional statistical methods.


Conflict of interest statement

The authors have declared that no competing interests exist.

Figures

Fig 1
Fig 1. Chart-base representation of CVD risk score.
(A) Two-dimensional (2D) representation, and (B) One-dimensional (1D) representation. Red question marks present CVD risk scores. In this example, the features were WHR (1), FH of CVD (2), sex (3), diabetic (4), and smoker (5). The row in each block shows the BP, which was grouped into four classes. (A) It is composed of 2D blocks, where each column represents cholesterol categories. Age was categorized into five groups.
Fig 2
Fig 2
Chromosome representation in (A) two-dimensional (2D) representation, and (B) one-dimensional (1D) representation. A chromosome is a 4×5 matrix in 2D representation. Each value on the matrix is called a gene; genes increase from left to right and decrease from top to bottom. (B) A chromosome is a 4×1 matrix in 1D representation. The genes decrease from top to bottom.
Fig 3
Fig 3
Crossover operations (A) 2D crossover, and (B) 1D crossover. Step 1: Combine parents’ chromosomes. Step 2: Check the validity of the resulting combination. Step 3: Obtain the pool of unique offspring. Step 4: Select two children by the Roulette Wheel selection.
Fig 4
Fig 4
Mutation operation (A) 2D mutation, (B) 1D mutation. Step 1: Randomly select a gene. Step 2: Either increase or decrease the selected gene with the same probability. Step 3: Check the validity of the chromosome, and if invalid, send it to the modifier function. Step 4: The modifier function fixes the chromosome.
Fig 5
Fig 5. XPARS with eight features: Charts for prediction of 10-year risk of fatal and non-fatal CVD in the ICS population by sex, age, BP, smoker, diabetic, and cholesterol.
(A) Low WHR and no FH of CVD, (B) High WHR and no FH of CVD, (C) Low WHR and FH of CVD, (D) High WHR and no FH of CVD.
Fig 6
Fig 6. AUROC improvement with training (XPARS with eight features).
The figure shows the improvement in training AUROC as it is trained with two complete rounds of non-empty chromosomes. The model used is XPARS with eight features, and the number of chromosomes with available data is 107 out of a total of 160 chromosomes. The process starts with an AUROC of about 0.74, while at the end of the first round of GA application, it raised to 0.80. After the second round, of training each of 107 chromosomes AUROC converged to 0.80.
Fig 7
Fig 7. XPARS with four features: Charts for prediction of 10-year risk of fatal and non-fatal CVD in the ICS population by sex, age, BP, and WHR.
Fig 8
Fig 8. Comparison of interpretability and predictive accuracy of chart-based models.
XPARS provides improvement to chart-based models in terms of both interpretability and prediction accuracy. The interpretability of models is measured based on the number of cells in the chart, while predictive accuracy is based on AUROC. XPARS, with four features, is the most interpretable without sacrificing accuracy by much. It improves the most interpretable previous model, non-cholesterol WHO, in terms of both interpretability (80 vs. 128) and AUROC (0.72 vs. 0.65). XPARS with eight features has a 2% higher AUROC compared to the PARS model, the most accurate previous model, given the same chart size.

References

    1. Goff DC, Lloyd-Jones DM, Bennett G, Coady S, D’agostino RB, Gibbons R, et al.. 2013 ACC/AHA guideline on the assessment of cardiovascular risk: a report of the American College of Cardiology/American Heart Association Task Force on Practice Guidelines. Journal of the American College of Cardiology. 2014;63(25 Part B):2935–59. doi: 10.1161/01.cir.0000437741.48606.98 - DOI - PMC - PubMed
    1. Guo Y, Miao C, Bao M, Xing A, Chen S, Wu Y, et al.. Cardiovascular Health Score and the Risk of Cardiovascular Diseases. Plos One. 2015;10(7). doi: 10.1371/journal.pone.0131537 - DOI - PMC - PubMed
    1. Malcolm S, Dorvil M, Zou B, DeGennaro V. Estimating 10-year cardiovascular disease risk in urban and rural populations in Haiti. Clinical Epidemiology and Global Health. 2020;8(4):1134–9. doi: 10.1016/j.cegh.2020.04.004 - DOI
    1. Bajpai V. The Challenges Confronting Public Hospitals in India, Their Origins, and Possible Solutions. Advances in Public Health. 2014;2014:898502. doi: 10.1155/2014/898502 - DOI
    1. Lagerweij GR, Moons KGM, de Wit GA, Koffijberg H. Interpretation of CVD risk predictions in clinical practice: Mission impossible? PLoS One. 2019. Jan 9;14(1):e0209314. doi: 10.1371/journal.pone.0209314 ; PMCID: PMC6326414. - DOI - PMC - PubMed