. 2022 Aug 17;13(16):2449-2463.
doi: 10.1021/acschemneuro.2c00208. Epub 2022 Jul 28.

Furanoditerpenes from Spongia (Spongia) tubulifera Display Mitochondrial-Mediated Neuroprotective Effects by Targeting Cyclophilin D

Affiliations

Furanoditerpenes from Spongia (Spongia) tubulifera Display Mitochondrial-Mediated Neuroprotective Effects by Targeting Cyclophilin D

Rebeca Alvariño et al. ACS Chem Neurosci. .

Abstract

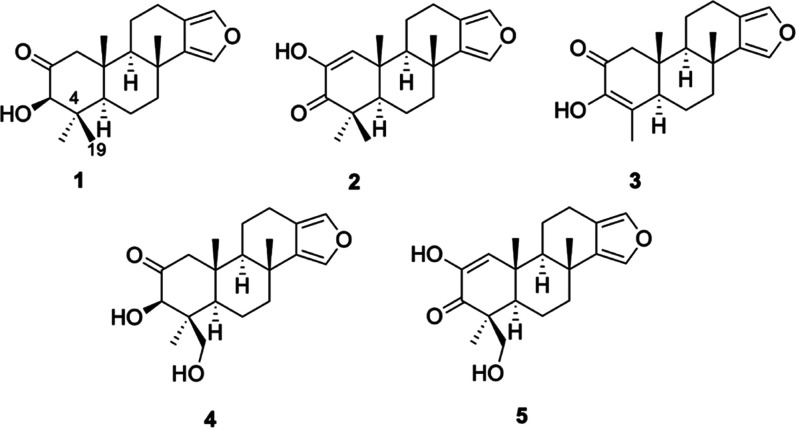
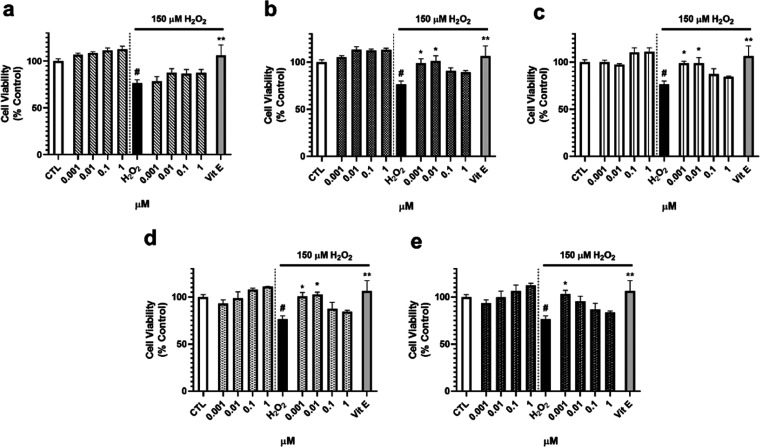
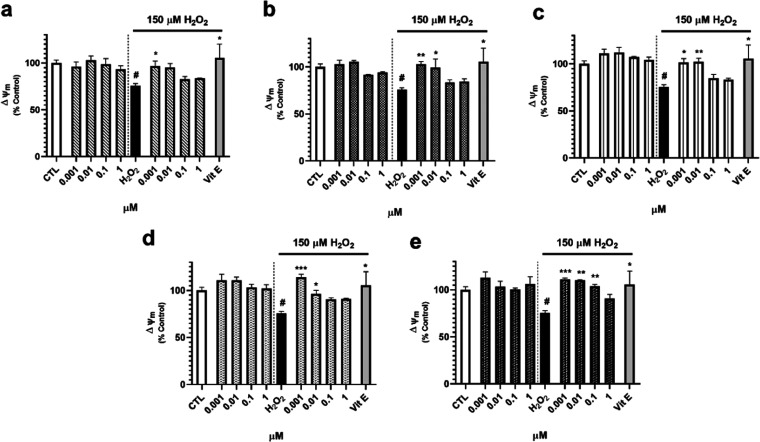
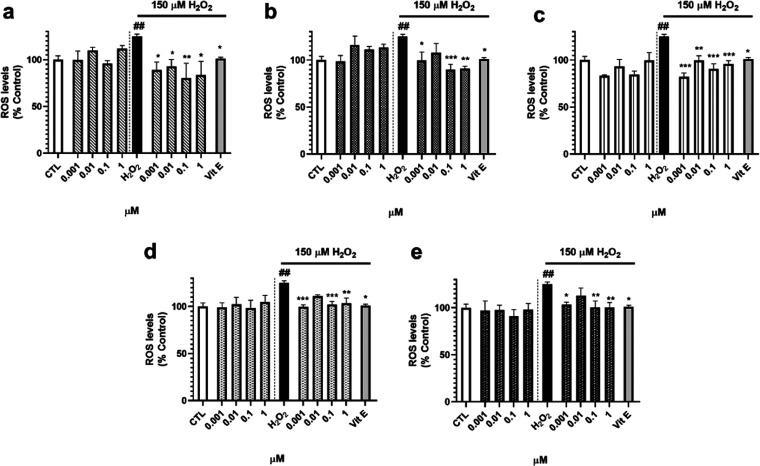
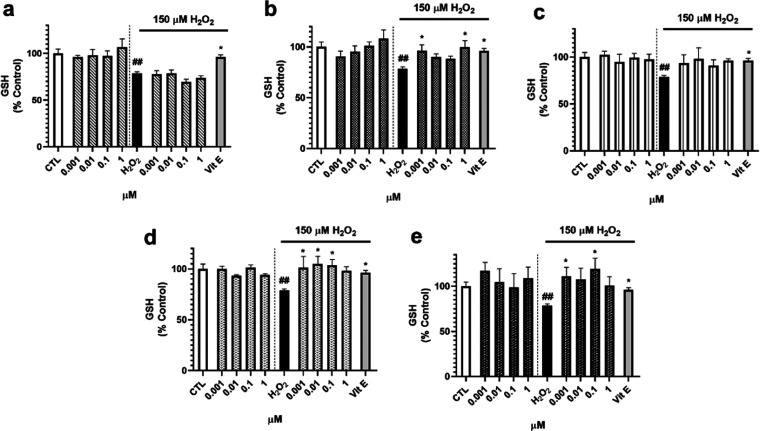
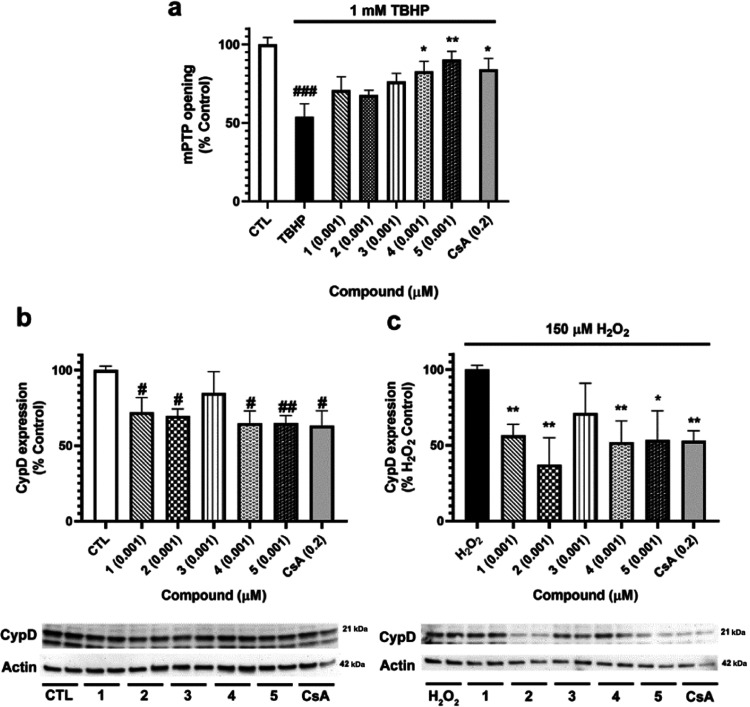
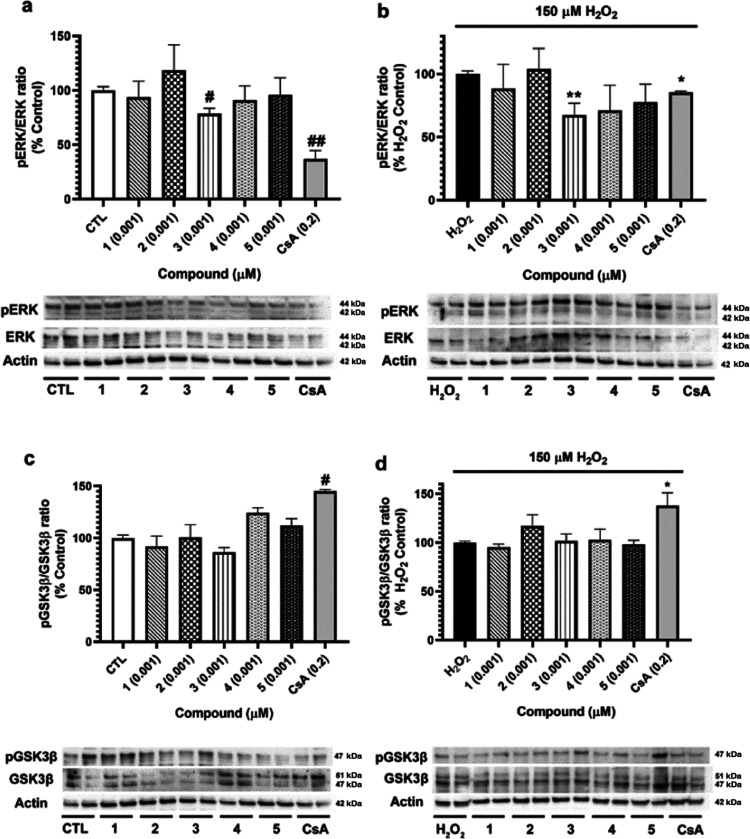
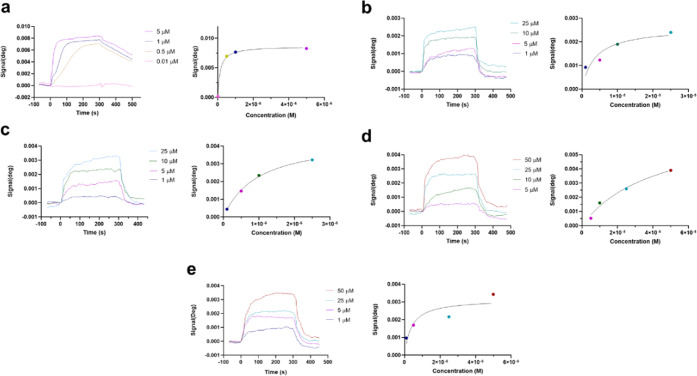
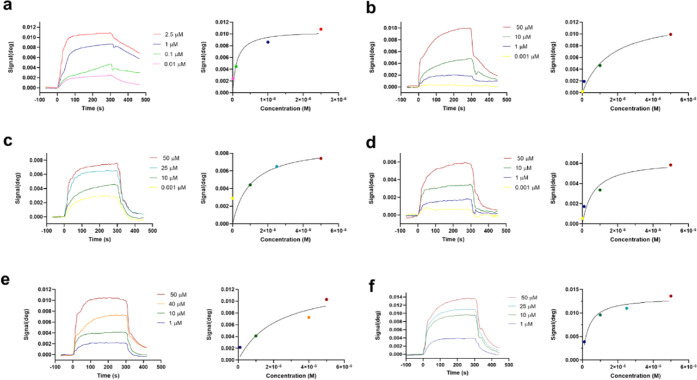
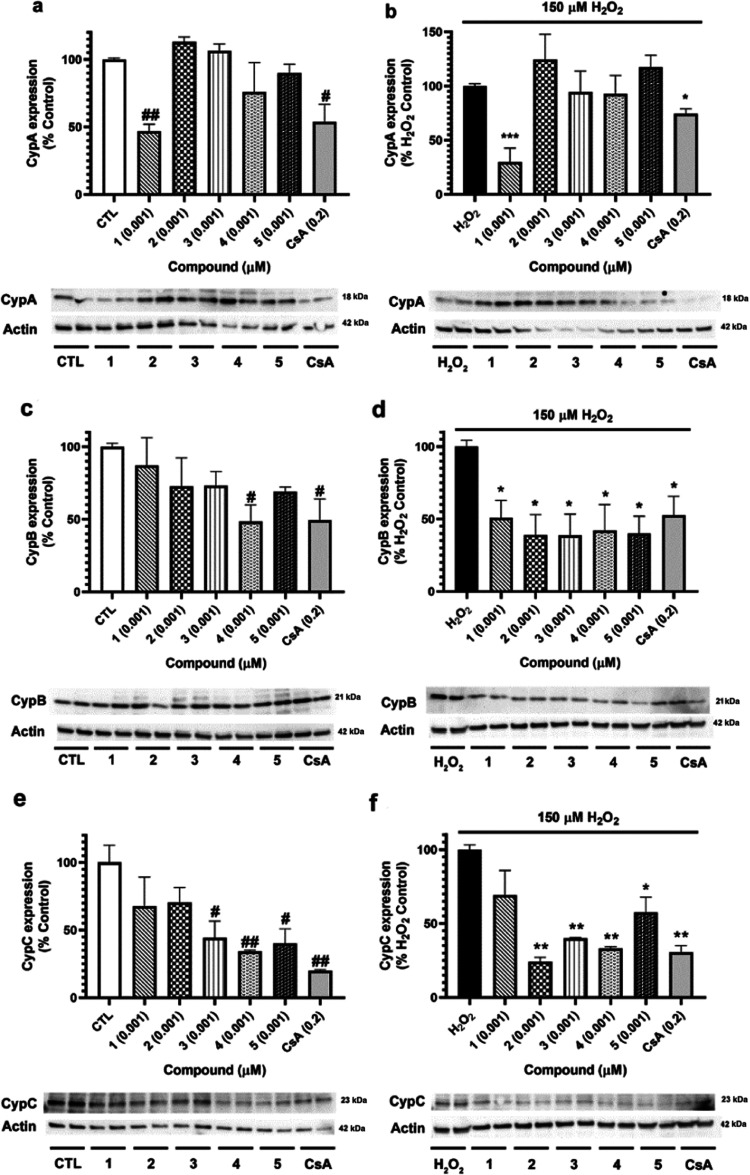
Neuroprotective properties of five previously described furanoditerpenes 1-5, isolated from Spongia (Spongia) tubulifera, were evaluated in an in vitro oxidative stress model in SH-SY5Y cells. Dose-response treatments revealed that 1-5 improved cell survival at nanomolar concentrations through the restoration of mitochondrial membrane potential and the reduction of reactive oxygen species. Their ability to prevent the mitochondrial permeability transition pore opening was also assessed, finding that 4 and 5 inhibited the channel at 0.001 μM. This inhibition was accompanied by a decrease in the expression of cyclophilin D, the main regulator of the pore, which was also reduced by 1 and 2. However, the activation of ERK and GSK3β, upstream modulators of the channel, was not affected by compounds. Therefore, their ability to bind cyclophilin D was evaluated by surface plasmon resonance, observing that 2-5 presented equilibrium dissociation constants in the micromolar range. All compounds also showed affinity for cyclophilin A, being 1 selective toward this isoform, while 2 and 5 exhibited selectivity for cyclophilin D. When the effects on the intracellular expression of cyclophilins A-C were determined, it was found that only 1 decreased cyclophilin A, while cyclophilins B and C were diminished by most compounds, displaying enhanced effects under oxidative stress conditions. Results indicate that furanoditerpenes 1-5 have mitochondrial-mediated neuroprotective properties through direct interaction with cyclophilin D. Due to the important role of this protein in oxidative stress and inflammation, compounds are promising drugs for new therapeutic strategies against neurodegeneration.

Keywords: Spongia (Spongia) tubulifera; cyclophilin; furanoditerpenes; mitochondria; neuroprotection; oxidative stress.


Conflict of interest statement

The authors declare no competing financial interest.

Figures

Figure 1
Figure 1
Chemical structures of furanoditerpenes 15.
Figure 2
Figure 2
Effect of compounds on the cell viability of SH-SY5Y cells. Compounds were added to human neuroblastoma cells for 6 h with and without 150 μM H2O2, and cell viability was evaluated with the MTT assay. Results of (a) compound 1, (b) compound 2, (c) compound 3, (d) compound 4, and (e) compound 5. Vitamin E (Vit E) at 25 μM was used as a positive control in oxidative stress assays. Mean ± standard error of the mean (SEM) of three experiments performed in triplicate. Data expressed as the percentage of control cells, compared by one-way analysis of variance (ANOVA) and Dunnett’s tests. #p < 0.05 compared to untreated control cells. *p < 0.05 and **p < 0.01 compared to cells treated with H2O2 alone.
Figure 3
Figure 3
Effect of furanoditerpenes on ΔΨm of human neuroblastoma cells. Cells were treated for 6 h with S. tubulifera metabolites with and without 150 μM H2O2, and ΔΨm was determined with the TMRM dye. (a) Compound 1, (b) compound 2, (c) compound 3, (d) compound 4, and (e) compound 5 effects. Vitamin E (Vit E) at 25 μM was used as a positive control in oxidative stress assays. Data expressed as the percentage of control cells. Mean ± SEM of three experiments performed in triplicate. Statistical differences determined by one-way ANOVA and Dunnett’s tests. #p < 0.05 compared to untreated control cells. *p < 0.05, **p < 0.01, and ***p < 0.01 compared to cells treated with H2O2 alone.
Figure 4
Figure 4
ROS intracellular levels after treatment with compounds. Furanoditerpenes were added for 6 h in the absence and presence of 150 μM H2O2. Then, the ROS content was measured with the fluorescent dye 5-(and-6)-carboxy-2′,7′-dichlorodihydrofluorescein diacetate (carboxy-H2DCFDA). Results from (a) 1, (b) 2, (c) 3, (d) 4, and (e) 5. Vitamin E (Vit E) at 25 μM was used as a positive control. Data expressed as the percentage of untreated control cells. Mean ± SEM of three experiments performed in triplicate. Statistical differences determined by one-way ANOVA test followed by Dunnett’s post hoc test. ##p < 0.01 compared to control cells. *p < 0.05, **p < 0.01, and ***p < 0.01 compared to H2O2 control.
Figure 5
Figure 5
Effect of S. tubulifera metabolites in the GSH content of human neuroblastoma cells. SH-SY5Y cells were treated with compounds for 6 h with and without 150 μM H2O2. GSH levels were monitored with Thiol Tracker Violet dye. (a) Compound 1, (b) compound 2, (c) compound 3, (d) compound 4, and (e) compound 5 results. Vitamin E (Vit E) at 25 μM was used as a positive control. Mean ± SEM of three experiments performed in triplicate. Data presented as the percentage of untreated control cells and compared by one-way ANOVA and Dunnett’s tests. ##p < 0.01 compared to control cells. *p < 0.05 compared to cells treated with H2O2 alone.
Figure 6
Figure 6
Evaluation of mPTP in SH-SY5Y cells treated with furanoditerpenes. (a) Analysis of mPTP opening. Cells were treated with compounds at 0.001 μM for 15 min, and pore opening was induced with 1 mM TBHP. Calcein-AM and CoCl2 were used to measure mPTP aperture by flow cytometry. Cyclosporine A (CsA) at 0.2 μM was used as a positive control. Values are presented as the percentage of control cells. Data are mean ± SEM of three independent experiments. Statistical differences determined by one-way ANOVA and Dunnett’s tests. ###p < 0.001 compared to control cells. *p < 0.05 and **p < 0.01 compared to cells treated only with TBHP. (b) CypD expression after treatment with S. tubulifera metabolites. (c) Effect of compounds on the CypD expression under oxidative stress conditions. SH-SY5Y cells were treated for 6 h with 15 with and without 150 μM H2O2, and the expression of the protein was determined by Western blot. CsA at 0.2 μM was used as a positive control. Protein band expression was normalized by actin levels. Results are mean ± SEM of three replicates carried out in duplicate. Data expressed as the percentage of untreated control cells and H2O2 control. Values compared by one-way ANOVA and Dunnett’s tests. #p < 0.05 and ##p < 0.01 compared to control cells. *p < 0.05 and **p < 0.01 compared to cells treated with H2O2 alone.
Figure 7
Figure 7
Analysis of compound effects on CypD upstream regulators. SH-SY5Y cells were treated with 15 at 0.001 μM for 6 h, and their effects on kinase activation were evaluated. (a) ERK activation after the addition of furanoditerpenes, (b) effect of compounds on ERK expression in oxidative stress conditions. (c) GSK3β expression after treatment with metabolites and (d) cotreatment with compounds and 150 μM H2O2. CsA at 0.2 μM was used as a positive control. Kinase expression was calculated as the ratio between phosphorylated and total levels. Protein band expression was normalized by actin levels. Results are mean ± SEM of three replicates carried out in duplicate. Data expressed as the percentage of untreated control cells and H2O2 control. Values compared by one-way ANOVA and Dunnett’s tests. #p < 0.05 and ##p < 0.01 compared to control cells. *p < 0.05 and **p < 0.01 compared to cells treated with H2O2 alone.
Figure 8
Figure 8
Binding of compounds to CypD measured by surface plasmon resonance. The left panels present association curves obtained by the addition of compounds over immobilized CypD and subtraction of their respective solvent control. The right panels show fitting curves for equilibrium binding. Representative graphs of one independent replicate. (a) Association of CsA, used as a positive control, and CypD, (b) compound 2, (c) compound 3, (d) compound 4, and (e) compound 5 associations with the immobilized CypD. All injections were performed using PBS, 0.05% Tween (pH 7.2) as the running buffer. Kinetic equilibrium dissociation constants (KD) and fitting curves were obtained with TraceDrawer software.
Figure 9
Figure 9
Binding of compounds to CypA measured by surface plasmon resonance. The left panels present association curves obtained by the addition of compounds over immobilized CypA and subtraction of their respective vehicle signal. The right panels show fitting curves for equilibrium binding. Representative graphs of one independent replicate. (a) Association between the positive control CsA and CypA. Association of (b) compound 1, (c) compound 2, (d) compound 3, (e) compound 4, and (f) compound 5 to immobilized CypA. Experiments were performed using PBS, 0.05% Tween (pH 7.2) as the running buffer. Kinetic equilibrium dissociation constants (KD) and fitting curves were obtained with TraceDrawer software.
Figure 10
Figure 10
Cyps expression after the addition of furanoditerpenes. SH-SY5Y cells were treated with 15 at 0.001 μM for 6 h, and their effects on Cyps expression were determined by Western blot. (a) CypA cytosolic levels and (b) effect of compounds on CypA expression after oxidative damage. (c) CypB expression after treatment with metabolites, (d) CypB intracellular levels under oxidative stress conditions, (e) expression of CypC after the addition of S. tubulifera furanoditerpenes, and (f) CypC expression after cotreatment with metabolites and H2O2. CsA at 0.2 μM was used as the positive control. Protein band expression was normalized by actin levels. Results expressed as the percentage of untreated control cells or as the percentage of H2O2 control. Mean ± SEM of three replicates carried out in duplicate. Statistical differences determined by one-way ANOVA and Dunnett’s tests. #p < 0.05 and ##p < 0.01 compared to control cells. *p < 0.05, **p < 0.01, and ***p < 0.01 compared to cells treated with H2O2 alone.

Similar articles

Cited by

References

    1. Máximo P.; Ferreira L. M.; Branco P.; Lima P.; Lourenço A. The Role of Spongia sp. in the Discovery of Marine Lead Compounds. Mar. Drugs 2016, 14, 13910.3390/md14080139. - DOI - PMC - PubMed
    1. Pech-Puch D.; Rodríguez J.; Cautain B.; Sandoval-Castro C. A.; Jiménez C. Cytotoxic Furanoditerpenes from the Sponge Spongia tubulifera Collected in the Mexican Caribbean. Mar. Drugs 2019, 17, 41610.3390/md17070416. - DOI - PMC - PubMed
    1. Pagano G.; Pallardó F. V.; Lyakhovich A.; Tiano L.; Fittipaldi M. R.; Toscanesi M.; Trifuoggi M. Aging-Related Disorders and Mitochondrial Dysfunction: A Critical Review for Prospect Mitoprotective Strategies Based on Mitochondrial Nutrient Mixtures. Int. J. Mol. Sci. 2020, 21, 706010.3390/ijms21197060. - DOI - PMC - PubMed
    1. Tomita K.; Kuwahara Y.; Igarashi K.; Roudkenar M. H.; Roushandeh A. M.; Kurimasa A.; Sato T. Mitochondrial Dysfunction in Diseases, Longevity, and Treatment Resistance: Tuning Mitochondria Function as a Therapeutic Strategy. Genes 2021, 12, 134810.3390/genes12091348. - DOI - PMC - PubMed
    1. Panel M.; Ghaleh B.; Morin D. Mitochondria and aging: A role for the mitochondrial transition pore?. Aging Cell 2018, 17, e1279310.1111/acel.12793. - DOI - PMC - PubMed

Publication types