. 2022 Sep;609(7928):801-807.
doi: 10.1038/s41586-022-05128-8. Epub 2022 Jul 28.

Impaired ketogenesis ties metabolism to T cell dysfunction in COVID-19

Collaborators, Affiliations

Impaired ketogenesis ties metabolism to T cell dysfunction in COVID-19

Fotios Karagiannis et al. Nature. 2022 Sep.

Abstract

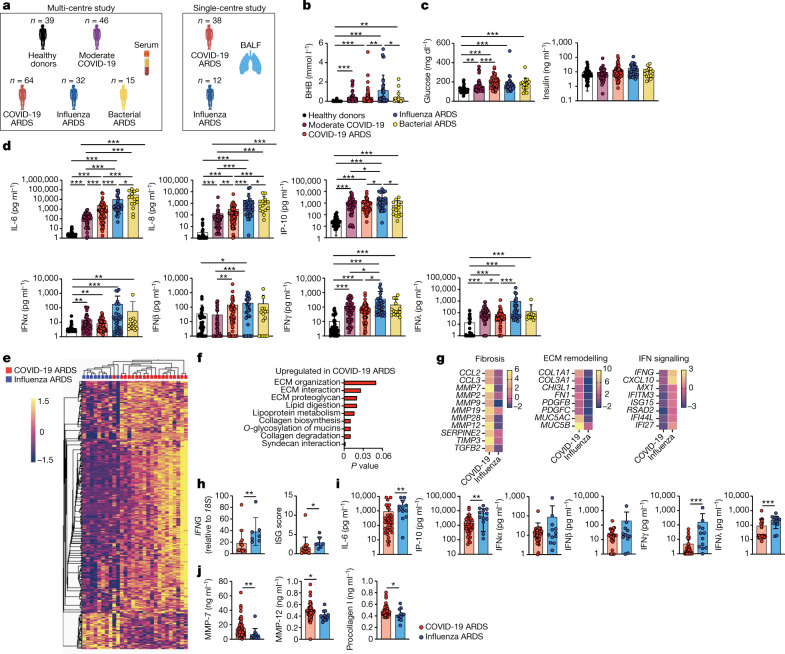
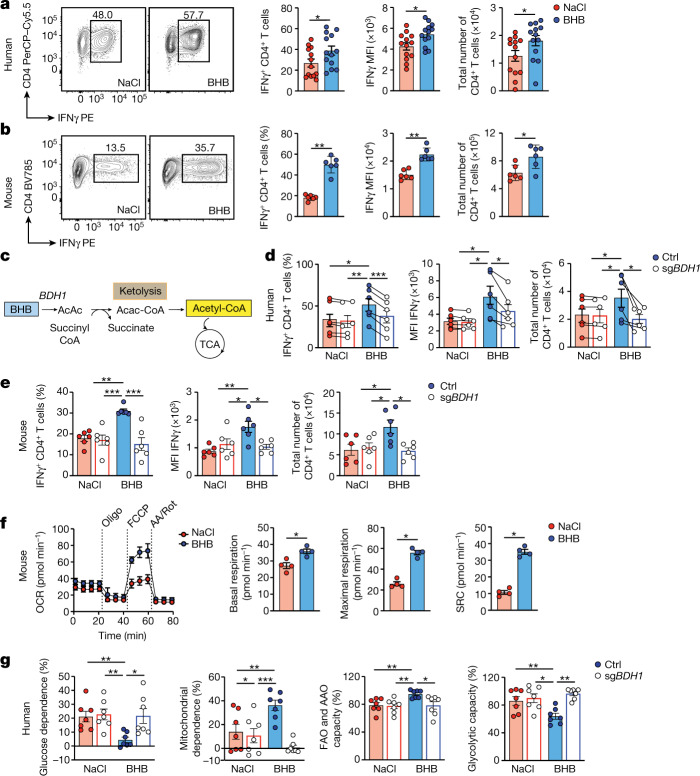
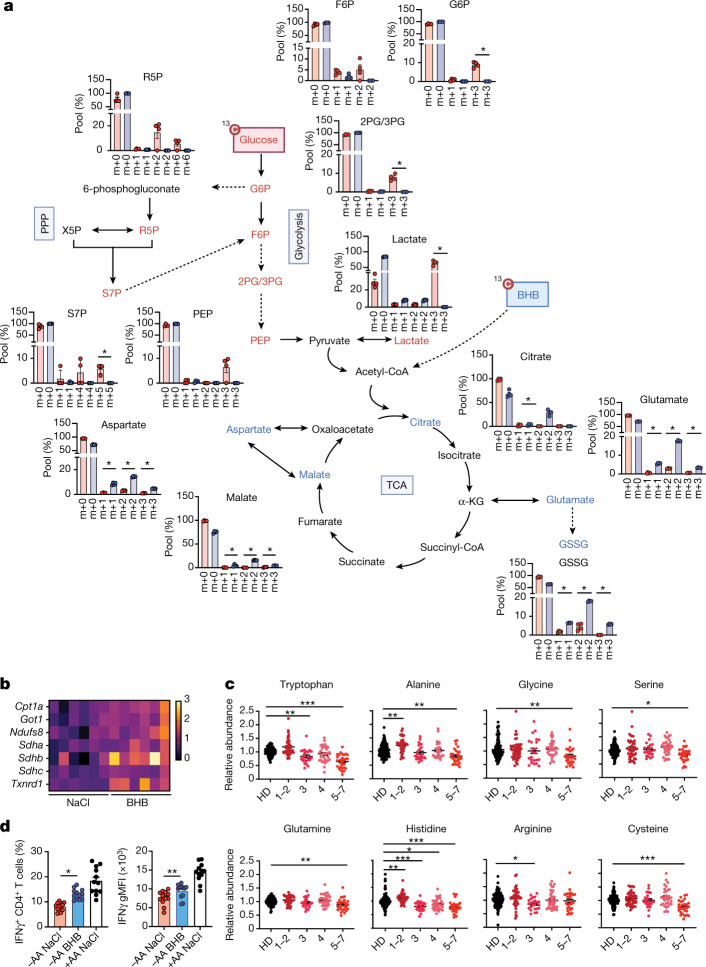
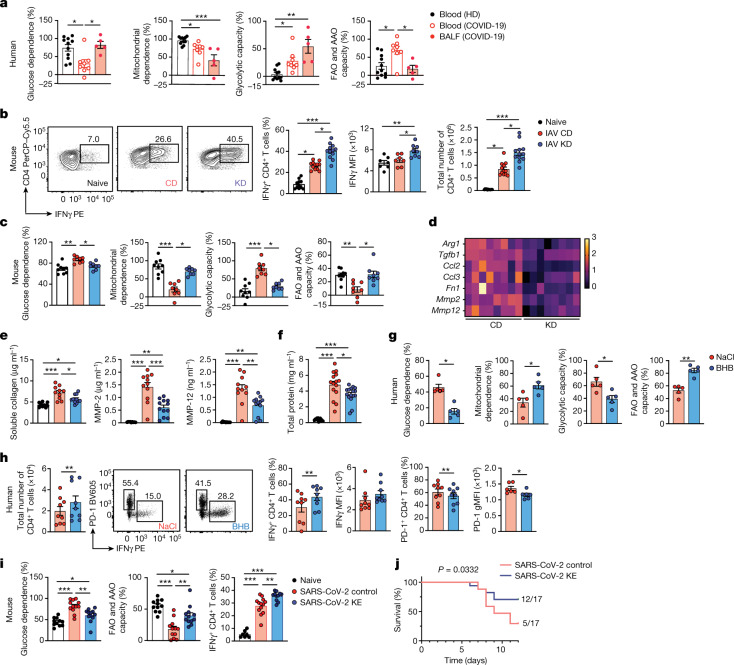
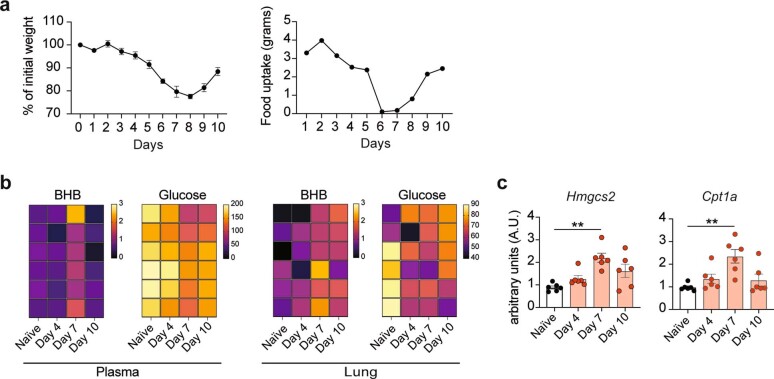
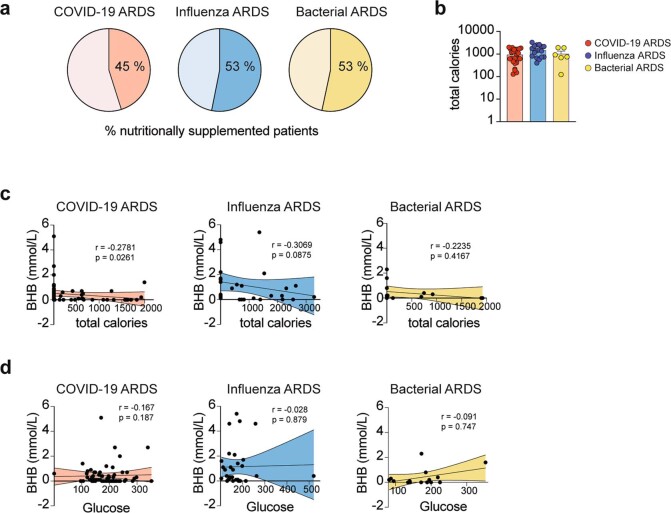
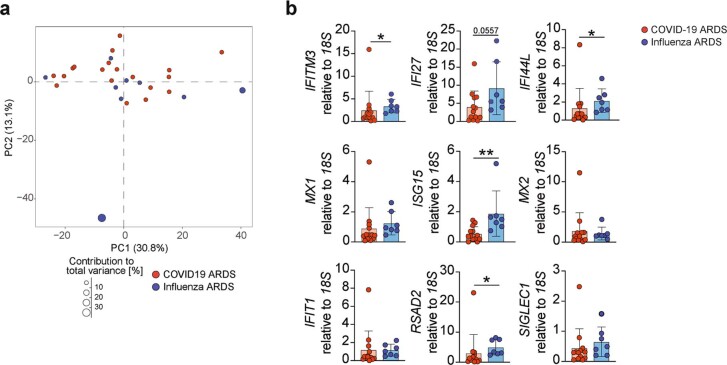
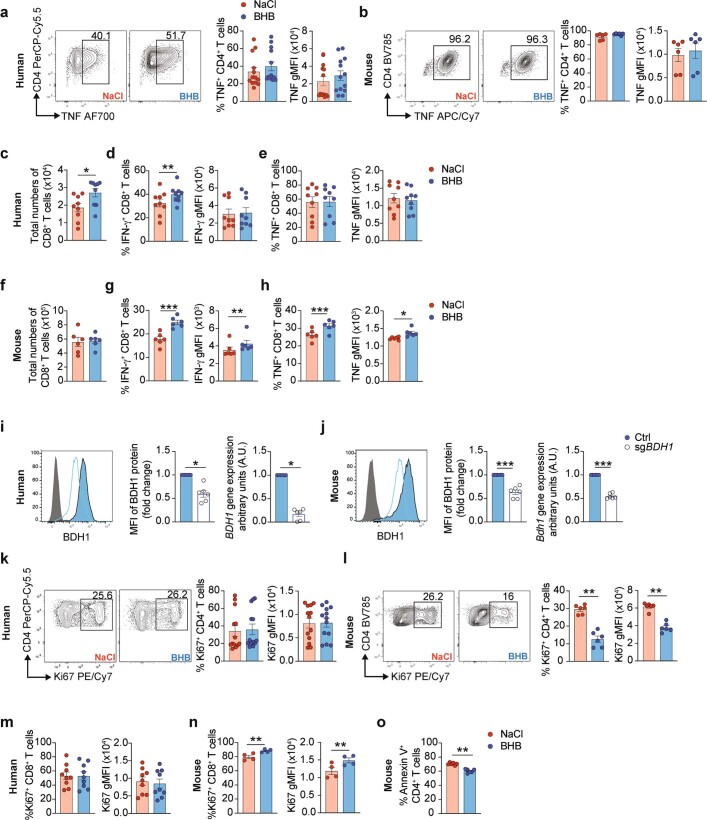
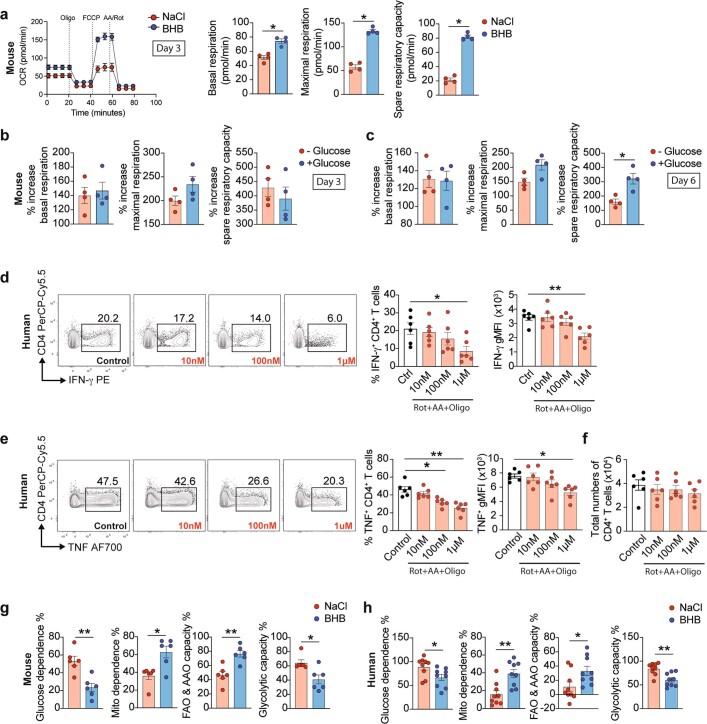
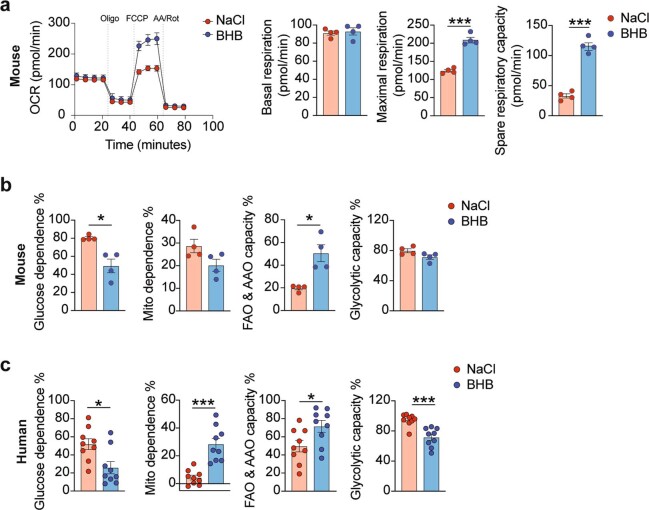
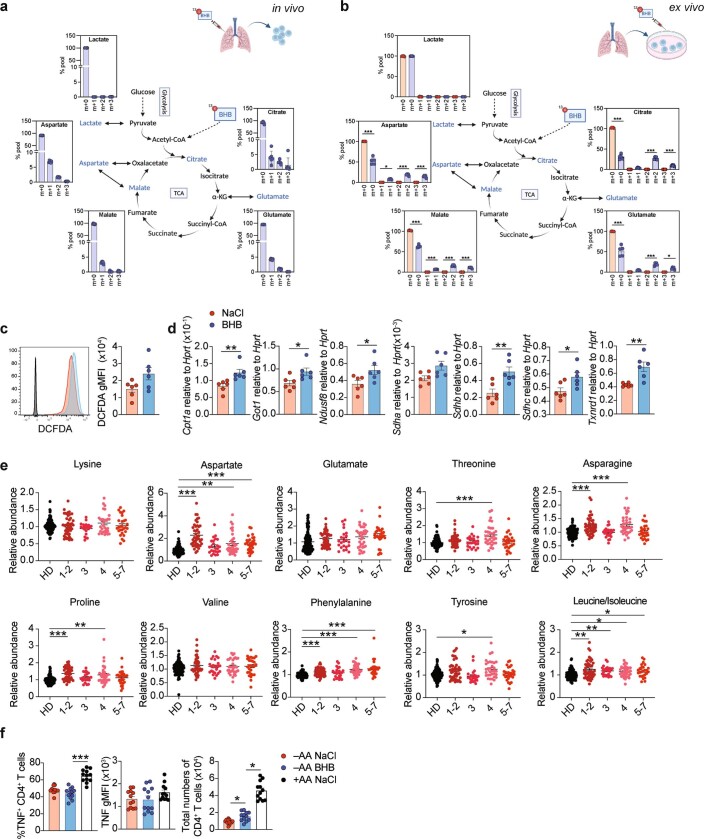
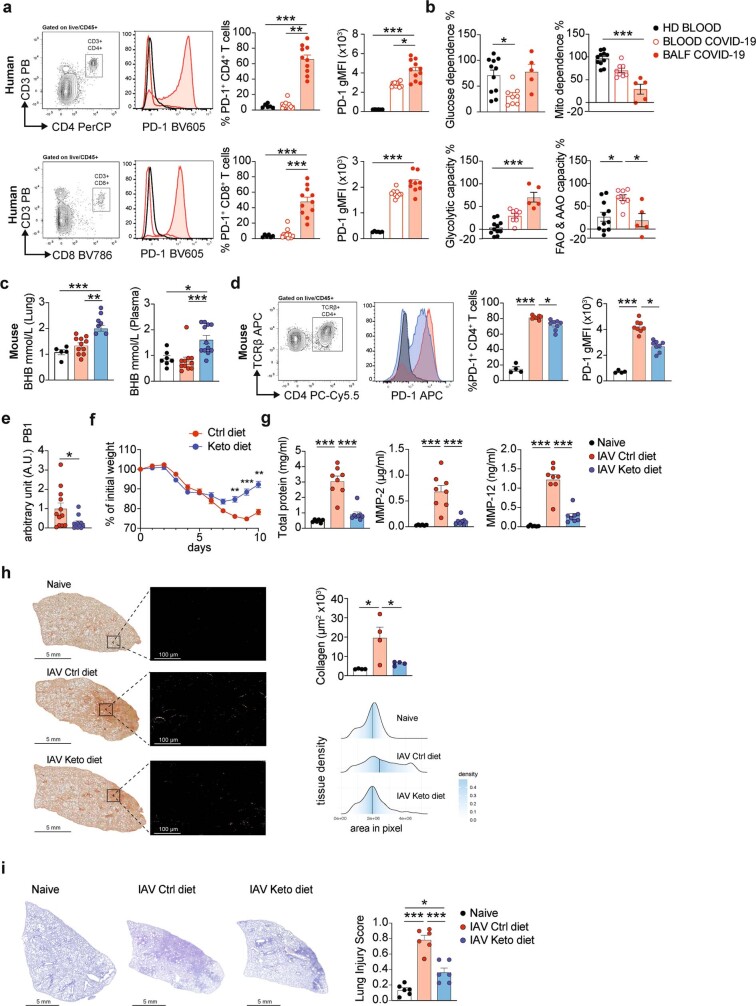
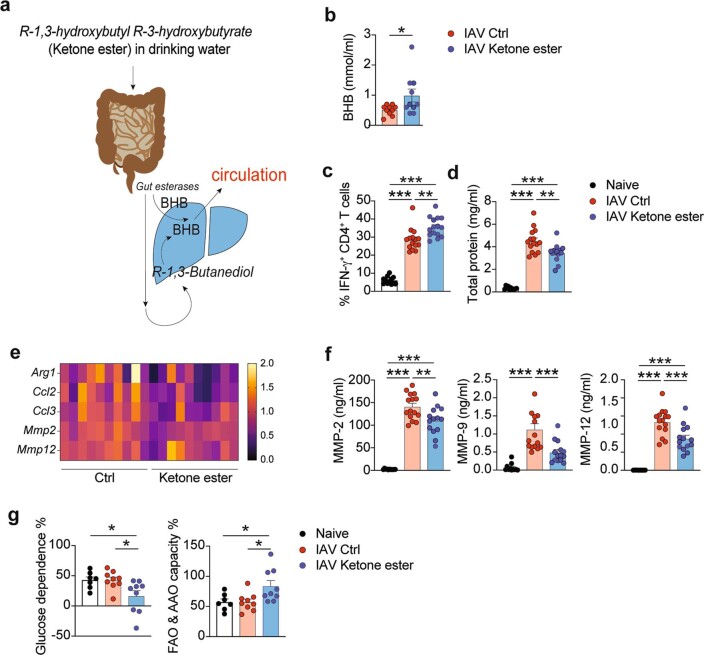
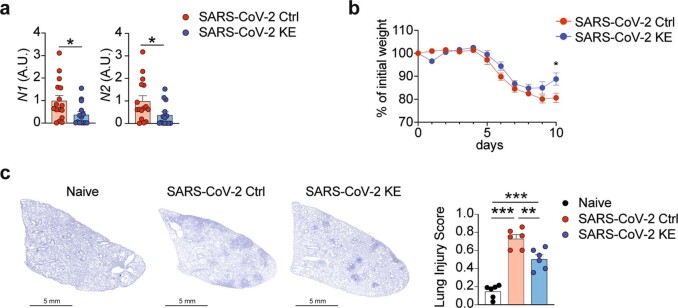
Anorexia and fasting are host adaptations to acute infection, and induce a metabolic switch towards ketogenesis and the production of ketone bodies, including β-hydroxybutyrate (BHB)1-6. However, whether ketogenesis metabolically influences the immune response in pulmonary infections remains unclear. Here we show that the production of BHB is impaired in individuals with SARS-CoV-2-induced acute respiratory distress syndrome (ARDS) but not in those with influenza-induced ARDS. We found that BHB promotes both the survival of and the production of interferon-γ by CD4+ T cells. Applying a metabolic-tracing analysis, we established that BHB provides an alternative carbon source to fuel oxidative phosphorylation (OXPHOS) and the production of bioenergetic amino acids and glutathione, which is important for maintaining the redox balance. T cells from patients with SARS-CoV-2-induced ARDS were exhausted and skewed towards glycolysis, but could be metabolically reprogrammed by BHB to perform OXPHOS, thereby increasing their functionality. Finally, we show in mice that a ketogenic diet and the delivery of BHB as a ketone ester drink restores CD4+ T cell metabolism and function in severe respiratory infections, ultimately reducing the mortality of mice infected with SARS-CoV-2. Altogether, our data reveal that BHB is an alternative source of carbon that promotes T cell responses in pulmonary viral infections, and highlight impaired ketogenesis as a potential confounding factor in severe COVID-19.


Conflict of interest statement

The authors declare no competing interests.

Figures

Fig. 1
Fig. 1. Impaired production of BHB and IFNγ in severe COVID-19.
a, Overview of the cohorts and the samples included in the study. Figure created using BioRender.com. b, Serum concentration of BHB in healthy donors (n = 39; black), patients with moderate COVID-19 (n = 46; purple) and patients with ARDS due to COVID-19 (n = 64; red), influenza (n = 32; blue) or bacterial pneumonia (n = 15; yellow). c,d, Serum concentration of glucose and insulin in the indicated cohorts (c) and quantification of pro-inflammatory cytokines in the serum (d). eg, RNA-seq analysis of cells from the BALF from patients with COVID-19 ARDS (n = 19; red) and influenza ARDS (n = 9; blue). e, Heat map of differentially expressed genes (P < 0.05) (around 700 differentially expressed genes in total). f, Pathway analysis. g, Heat maps showing the fold change of genes associated with fibrosis, extracellular matrix (ECM) remodelling and interferon signalling. h, Relative expression of IFNG and ISG score (as a mean of interferon-stimulated gene (ISG) expression; IFITM3, IFI27, IFI44L, IFIT1, MX1, ISG15, MX2, RSAD2 and SIGLEC1) in the BALF of patients with COVID-19 ARDS (n = 13) and influenza ARDS (n = 7). i,j, Quantification of the indicated cytokines (i) and fibrotic biomarkers (j) in the BALF of patients with COVID-19 ARDS (n = 38) and influenza ARDS (n = 12) ARDS. In bd,hj, each dot represents a donor. Data are mean ± s.d. Statistics were assessed by non-parametric one-way ANOVA (Kruskal–Wallis test) corrected for multiple comparisons by two-stage linear step-up procedure of Benjamini, Krieger and Yekutieli (bd), or by two-tailed Student’s t-test (hj); not significant .(not indicated), P > 0.05; *P < 0.05; **P < 0.01; ***P < 0.001. Source data
Fig. 2
Fig. 2. BHB promotes the production of IFNγ and OXPHOS in CD4+ T cells.
a,b,dg, Human CD4+ T cells isolated from the blood of healthy donors (a,d,g) or splenic mouse CD4+ T cells (b,e,f) were cultured in TH1 polarizing conditions in the presence or absence of 5 mM BHB. a,b, Representative flow plots and percentage of IFNγ+ CD4+ T cells, IFNγ geometric mean fluorescence intensity (gMFI) and total number of live cells (human CD4+ T cells, n = 13; mouse CD4+ T cells, n = 6). c, Schematic representation of ketolysis. AcAc, acetoacetate; AcAc-CoA, acetoacetyl-CoA. dg, Human CD4+ T cells or splenic mouse naive CD4+ T cells (n = 6) were mock treated or nucleofected with BDH1-targeting (sgBDH1) sgRNA–Cas9 RNPs and cultured in TH1 conditions in the presence or absence of 5 mM BHB. d,e, Percentage of IFNγ+ CD4+ T cells, IFNγ gMFI and live cell count analysed by flow cytometry (n = 6). f, Energy metabolism analysed by extracellular flux analysis on day 6 (n = 4). Oligo, oligomycin; AA/Rot, antimycin A and rotenone; OCR, oxygen consumption rate; SRC, spare respiratory capacity. g, Bioenergetic characterization by SCENITH (n = 7). FAO, fatty acid oxidation; AAO, amino acid oxidation. In a,d,g, each dot represents a donor. Data in b,e,f are representative of three independent experiments with n = 6 (b,e) and n = 4 (f) biological replicates in each experimental group. Data are mean ± s.e.m. Statistics were assessed by two-tailed Student’s t-test (paired (a), or not paired (b,f)) or by non-parametric one-way ANOVA (Kruskal–Wallis test) (d,e,g); not significant (not indicated), P > 0.05; *P < 0.05; **P < 0.01; ***P < 0.001. Source data
Fig. 3
Fig. 3. BHB is a carbon source for the TCA cycle and amino acid metabolism in T cells.
a, Splenic mouse CD4+ T cells were cultured in TH1 polarizing conditions for three days, in the presence or absence of 5 mM BHB, and incubated in 13C-glucose medium for the last 3 h, or in 13C-BΗB medium for the last 12 h. Pentose phosphate pathway (PPP) and glycolytic or Krebs cycle metabolites were analysed by mass spectrometry. m+0, unlabelled mass of isotope; m+n, native metabolite mass + number of isotopically labelled carbons. F6P, fructose 6-phosphate;G6P, glucose 6-phosphate;R5P, ribose 5-phosphate;X5P, xylulose 5-phosphate;S7P, sedoheptulose 7-phosphate;2PG/3PG, glyceraldehyde 2- or 3-phosphate; PEP, phosphoenolpyruvate;α-KG, α-ketoglutarate. b, Heat map showing the fold change of gene expression for enzymes that regulate cellular metabolic pathways. c, Relative abundance of the indicated amino acids in the serum of patients with COVID-19. HD, healthy donors; 1–7, World Health Organization disease severity score. Data are from a published metabolomic dataset. d, Human CD4+ T cells were isolated from the blood of healthy donors (n = 12) and cultured for one week in TH1 polarizing conditions, with or without amino acid (AA) and 5 mM BHB. Percentage of IFNγ+ CD4+ T cells and IFNγ gMFI analysed by flow cytometry. Results in a are from n = 5 pooled mice for each data point (n = 4). Data in b are representative of three independent experiments with n= 6 biological replicates in each experimental group. (c,d). Each dot represents a donor. Data are mean ± s.e.m. Statistics were assessed by two-tailed Student’s t-test (a) or by non-parametric one-way ANOVA (Kruskal–Wallis test) (c,d); not significant (not indicated), P > 0.05; *P < 0.05; **P < 0.01; ***P < 0.001. Source data
Fig. 4
Fig. 4. BHB rescues the metabolism and function of T cells in severe viral infections.
a, Analysis of CD4+ T cells by SCENITH in the blood of healthy donors (HD; n = 11) and in the blood (n = 8) or BALF (n = 5) of patients with COVID-19 ARDS. bf, C57BL/6 mice were fed a control diet (CD) or a ketogenic diet (KD) for seven days, infected with IAV, euthanized and analysed on day 10. b, Representative flow plots, percentage and total number of IFNγ+ CD4 T cells (n = 12 in each group; naive n = 11), IFNγ gMFI (n = 7 naive and CD; n = 8 KD), c, Analysis by SCENITH of lung CD4+ T cells (n = 9 naive; n = 8 CD and KD). d, Expression of fibrotic genes from BALF cells (n = 8 in each group). e, Soluble collagen (n = 9 naive, n = 10 CD, n = 11 KD) and MMPs (n = 9 naive, n = 10 CD and n = 11 KD). f, Total protein (n = 13 naive, n = 15 CD and n = 16 KD). g,h, CD4+ T cells were isolated from the blood of patients with COVID-19 ARDS and cultured under TH1 conditions, with or without 5 mM BHB. g, Analysis by SCENITH (n= 5). h, Total number of CD4+ T cells and percentage of IFNγ+ and PD-1+ CD4+ T cells (n = 9). IFNγ (n = 9) and PD-1 gMFI (n = 6) assessed by flow cytometry. i,j, K18-hACE2 mice were infected with SARS-CoV-2 and euthanized on day 8. Mice were supplied with drinking water (control) or water supplemented with ketone ester (KE). i, Analysis of CD4+ T cells by SCENITH (n = 11 naive; n = 12 Ctrl and KE) and percentage of IFNγ+ CD4+ T cells (n = 7 naive, n = 13 control and n = 11 KE). j, Per cent survival of SARS-CoV-2-infected mice (n = 17 in each group). In a,g,h, each dot represents one donor. Data are pooled from three (be), four (f,i) or five (j) independent experiments. Data are mean ± s.e.m. Statistics were assessed by non-parametric one-way ANOVA (Kruskal–Wallis test) (a), ordinary one-way ANOVA (Tukey´s correction) (bf,i), two-tailed Student’s t-test (g,h) or log-rank test (Mantel–Cox) (j); not significant (not indicated), *P < 0.05; **P < 0.01; ***P < 0.001. Source data
Extended Data Fig. 1
Extended Data Fig. 1. Influenza A infection in mice induces ketogenesis.
ac, Mice were infected with IAV and euthanized on d 4, 7 and 10 for analysis. (a) Body weight and food uptake were monitored every day. (b) Heat maps depicting the quantification of BHB and glucose levels in plasma and lung. (c) Fold change of gene transcripts regulating ketogenesis in the liver(Hmgcs2, Cpt1a). (ac), Data representative of three independent experiments with (a) n=4 (b, c) n=6 mice per experimental group. All graphs display mean ± s.e.m. Statistics were assessed by (d) ordinary one-away ANOVA (Tukey´s correction), not significant (not indicated) p > 0.05; **p < 0.01. Source data
Extended Data Fig. 2
Extended Data Fig. 2. Ketogenesis is not influenced by glucose or nutrient intake.
a, Percentage of the nutritionally supplemented patients in the indicated groups. b, Quantification of total calories of nutritionally supplemented patients in the indicated groups (COVID-19 n=27, Influenza n=17 and bacterial n=6). c,d, Plots correlating BHB levels and total calories (c) and glucose concentration (d) in patients with COVID-19 n=63, Influenza n=32 or bacterial n=15 ARDS. (bd) Each dot represents a donor. (b) non-parametric one-way ANOVA (Kruskal–Wallis test), not significant (not indicated) p > 0.05. (c,d) the non-parametric Spearman correlation coefficient and the p values are indicated respectively as r and p in the plots. Source data
Extended Data Fig. 3
Extended Data Fig. 3. Interferon response in patients with severe respiratory viral infections.
a, BALF RNA-seq from patients with severe COVID-19 (n=19, red) and Influenza (n=9, blue). PCA plot. b, Relative expression of interferon-stimulated genes (ISGs) in the BALF of patients with severe COVID-19 (n=13) and patients with influenza (n=7). (a, b) Each dot represents a donor. Graphs display mean ± s.d. Statistics were assessed by (b) two-tailed Student’s t-test, not significant (not indicated) p > 0.05; *p < 0.05; **p < 0.01. Source data
Extended Data Fig. 4
Extended Data Fig. 4. BHB promotes T cell function in a BDH1-dependent manner.
a, ce, k, m, Human CD4+ T and CD8+ T cells were isolated from the blood of healthy donors and culture for 1 week in TH1 polarizing conditions in the presence or absence of 5 mM BHB. b, fh, l, n, o, Splenic mouse CD4+ and CD8+ T cells were activated in culture for 1 week in TH1 polarizing conditions with or without 5 mM BHB. Representative flow plots and percentage of human (n=13) (a) and mouse (n=6) TNF+ CD4+ T cells and TNF gMFI (b). Total numbers of live human CD8+ T cells (c), percentage of IFNγ+, IFNγ gMFI (d) and TNF+ CD8+ T cells, TNF gMFI (e) (n=9) analysed by flow cytometry. Total number of live mouse CD8+ T cells (f) percentage of IFNγ+ CD8+ T cells, IFNγ gMFI (g) and percentage of TNF+ CD8+ T cells, TNF gMFI (h) analysed by flow cytometry (n=6). (i, j) Representative histograms and quantification of BDH1 protein by flow cytometry (MFI) and gene expression analysis (fold change) of BDH1 RNA in (i) human CD4+ T cells (n=6) or (j) mouse naïve splenic CD4+ T cells (n=6) mock treated or nucleofected with Bdh1-targeting (sgBdh1) sgRNA/Cas9 RNPs cultured for 2 days in TH1 polarizing conditions. Representative flow plots, percentages and gMFI of Ki-67 expression in human CD4+ T cells (n=13) (k), in mouse CD4+ T cells (n=6) (l), in human CD8+ T cells (n=9) (m), in mouse CD8+ T cells (n=4) (n) and the % of mouse Annexin V+ CD4+ T cells (n=6) (o) measured by flow cytometry. (a, c–e, i-k, m) Each dot represents a donor. (b, fh, l, n, o) Data representative of three independent experiments with (b, f–h, j, l, o) n=6 and (n) n=4 mice in each experimental group. All graphs display mean ± s.e.m. Statistics were assessed by (ao) by two-tailed Student’s t-test, not significant (not indicated) p > 0.05; *p < 0.05; **p < 0.01; ***p < 0.001. Source data
Extended Data Fig. 5
Extended Data Fig. 5. BHB supports OXPHOS in TH1 cells.
ac, Splenic mouse CD4+ T cells were activated in culture for 1 week (a, c) or 3 days (b) in TH1 polarizing conditions with or without 5 mM BHB. Energy metabolism was monitored by extracellular flux analysis (b, c) in the presence or absence of glucose. Basal respiration, maximal respiration and spare respiratory capacity are depicted as the percentage of increase between NaCl and BHB treated cells (n=4). df, Human CD4+ T cells were isolated from the blood of healthy donors (n=6) and activated in culture for 2 days in TH1 polarizing conditions, with or without OXPHOS inhibitors (rotenone, antimycin A and Oligomycin at the indicated concentrations). (df) Representative flow plots and (d) percentage of IFNγ+ CD4+ T cells and IFNγ gMFI. (e) TNF+ CD4+ T cells and TNF gMFI. (f) Total number of CD4+ T cells (n=6). g, h, Splenic mouse CD4+ T cells (n=6) (g) and human CD4+ T cells isolated from the blood of healthy donors (n=9) (h) were cultured for 1 week in TH1 polarizing conditions with or without 5 mM BHB. Analysis of the energy metabolism by SCENITH (n=9). (d, e, f, h) Each dot represents a donor. (ac, g) Data representative of two independent experiments with (a-c) n=4 or (g) n=6 mice in each experimental group. All graphs display mean ± s.e.m. Statistics were assessed by two-tailed Student’s t-test and (ac, gh) non-parametric one-way ANOVA (Kruskal–Wallis test) (df), not significant (not indicated) p > 0.05; *p < 0.05; **p < 0.01. Source data
Extended Data Fig. 6
Extended Data Fig. 6. BHB supports mitochondrial fitness and OXPHOS in CD8+ T cells.
a, b, Splenic mouse CD8+ T cells were activated in culture for 3 days in TH1 polarizing conditions with or without 5 mM BHB. Energy metabolism was monitored by extracellular flux analysis (a) and by SCENITH (b) (n=4). c, Human CD8+ T cells were isolated from the blood of healthy donors (n=9) and activated in culture for 1 week in TH1 polarizing conditions with or without 5 mM BHB. Energy metabolism was monitored by SCENITH. (c) Each dot represents a donor. (a, b) Data representative of two independent experiments with n=4 mice in each experimental group. All graphs display mean ± s.e.m. (a-c) Statistics were assessed by two-tailed Student’s t-test and, not significant (not indicated) p > 0.05; *p < 0.05; ***p < 0.001. Source data
Extended Data Fig. 7
Extended Data Fig. 7. BHB is a carbon source for CD4+ T cells in the infected lung.
a, C57BL/6 mice were infected with IAV for 7 days. 13C-BHB was injected i.p. 20 min before euthanizing the mice. Lung CD4+ T cells were isolated and analysed by MS. b, C57BL/6 mice were infected with IAV for 7 days. Lung CD4+ T cells were isolated and cultured for 2 h with 13C-BHB followed by mass spectrometric analysis. c, Splenic mouse CD4+ T cells were cultured in TH1 polarizing conditions with or without 5 mM BHB. Detection of cellular ROS (DCFDA gMFI) by FACS (n=6). d, Relative expression of metabolic gatekeeper enzymes (n=6). e, Relative abundance of indicated amino acid in serum of patients with COVID-19. Data extracted from published metabolomic dataset. f, Human CD4+ T cells were isolated from the blood of healthy donors (n=12) and cultured for 1 week in TH1 polarizing conditions with or without 5 mM BHB. Percentage of TNF+ CD4+ T cells, TNF gMFI and total numbers of live cells analysed by flow cytometry. (a-b) Results are from (n=3) pooled mice for each data point (a, n=6; b, n=5). Figure was created using BioRender.com. (c, d) Data representative of three independent experiments with n=6 mice in each experimental group. (e, f) Each dot represents a donor. All graphs display mean ± s.e.m. Statistics were assessed by (bd) by two-tailed Student’s t-test or (e, f) non-parametric one-way ANOVA (Kruskal–Wallis test), not significant (not indicated) p > 0.05; *p < 0.05; **p < 0.01; ***p < 0.001. Source data
Extended Data Fig. 8
Extended Data Fig. 8. A ketogenic diet promotes the resolution of inflammation.
a, b Analysis of CD4+ and CD8+ T cells in the blood of healthy donors (a, n=6; b, n=11, black) and the blood (a, n=11; b, n=8 open red) or BALF (a, n=11; b, n=5, filled red) of patients with severe COVID-19. (a) Gating strategy (left panel), representative histograms of PD-1 expression (right panel) and percentage of CD4+ and CD8+ PD-1+ cells and gMFI of PD-1 (n=9 open red and filled red) analysed by flow cytometry. (b) Metabolic characterization of CD8+ T cells by SCENITH. c-h, C57BL/6 mice were fed a control or ketogenic diet for 7 days followed by infection with IAV (d0). Mice were euthanized and analysed on d10. (c) Quantification of ketone bodies in the plasma and lung of mice (BHB lung: n=5 naïve, n=11 CD, n=7 KD; BHB Plasma: n=7 naïve, n=11 CD, n=12 KD). (d) Gating strategy (left panel), representative histograms of PD-1 expression (right panel) and percentage of CD4+ PD-1+ cells and gMFI of PD-1 (n=4 naïve, n=8 CD and KD) (e) Relative expression of viral PB1 RNA (viral load) on day 7 (n=12 CD and n=11 KD). (f) Relative weight loss of infected mice (n=4 CD and KD). (g) Quantification of total protein (BSA) and matrix metalloproteinases (MMPs) on day 14 (n=6 naïve, n=8 CD and KD. (h) Representative images stained with picrosirius red of lungs and quantified for tissue density (shown as pixel count per image) and collagen deposition (total green area per image) (n=4). (i) Representative image of lungs stained by haematoxylin and eosin (H&E) and lung injury score analysis (n=6). Each dot represents a mouse. (a-b) Each dot represents a donor. (cg) Pooled data from three independent experiments with n=4 mice per experimental group. (h, i) Representative of three independent experiments with n=6 in each experimental group. All graphs display mean ± s.e.m. Statistics were assessed by (a, b) non-parametric one-way ANOVA (Kruskal–Wallis test), (c, d, g–i) ordinary one-away ANOVA (Tukey´s correction) and (e, f) two-tailed Student’s t-test, not significant (not indicated) p > 0.05; *p < 0.05; **p < 0.01; ***p < 0.001. Source data
Extended Data Fig. 9
Extended Data Fig. 9. Treatment with ketone ester enhances T cell immunity and protects from IAV infection.
a, Representation of ketone ester metabolism in vivo. b-g, C57BL/6 were challenged with IAV on day 0. Ketone ester were added in the drinking water for the duration of the whole experiment. Mice were euthanized on day 10. (b) Quantification of BHB in the blood (n=10 for each experimental group). (c) Percentage of IFNγ+ CD4+ T cells (n=12 naïve, n=15 Ctrl and n=15 KE). (d) Total protein (BSA) measurements (n=11 naïve, n=15 Ctrl and n=14 KE). (e) Heat map depicting the relative expression of genes associated with fibrosis assessed by qRT–PCR (n=10 for each experimental group). (f) Quantification of proteins associated with fibrosis in the lung (n= 11 naïve, n=15 Ctrl and n=14 KE). (g) Metabolic analysis of CD4+ T cells by SCENITH (n=7 naïve, n=9 Ctrl and KE). (bg) Data pooled from three independent experiments with n = 5 mice per experimental group. All graphs display mean ± s.e.m. Statistics were assessed by (b) two-tailed Student’s t-test (c, d, f, g) ordinary one-away ANOVA (Tukey´s correction), not significant (not indicated) p > 0.05; *p < 0.05; **p < 0.01; ***p < 0.001. Source data
Extended Data Fig. 10
Extended Data Fig. 10. Treatment with ketone ester reduces pathology in SARS-CoV-2-infected mice.
ac, 8–12 weeks old male K18-hACE2 mice were infected with SARS-CoV-2. Mice were supplied with drinking water (Ctrl) or drinking water supplemented with ketone ester (KE) for the duration of the whole experiment. (a) Relative expression of viral N1 and N2 RNA quantified by qPCR on day 8 (n=16 Ctrl and n=14 KE) and (b) weight loss of infected mice (n=10 Ctrl and n=11 KE). (c) Representative haematoxylin and eosin (H&E)-stained images of lungs and lung injury score analysis on day 12 post infection (n = 6). Data pooled from (a) four or (b) three or (c) two independent experiments. All graphs display mean ± s.e.m. Statistics were assessed by (a, b) by two-tailed Student’s t-test and (c) ordinary one-away ANOVA (Tukey´s correction), not significant (not indicated) p > 0.05; *p < 0.05; **p < 0.01; ***p < 0.001. Source data

Comment in

Similar articles

Cited by

References

    1. Troha K, Ayres JS. Metabolic adaptations to infections at the organismal level. Trends Immunol. 2020;41:113–125. doi: 10.1016/j.it.2019.12.001. - DOI - PMC - PubMed
    1. Wilhelm C, Surendar J, Karagiannis F. Enemy or ally? Fasting as an essential regulator of immune responses. Trends Immunol. 2021;42:389–400. doi: 10.1016/j.it.2021.03.007. - DOI - PubMed
    1. Rao S, et al. Pathogen-mediated inhibition of anorexia promotes host survival and transmission. Cell. 2017;168:503–516. doi: 10.1016/j.cell.2017.01.006. - DOI - PMC - PubMed
    1. Puchalska P, Crawford PA. Multi-dimensional roles of ketone bodies in fuel metabolism, signaling, and therapeutics. Cell Metab. 2017;25:262–284. doi: 10.1016/j.cmet.2016.12.022. - DOI - PMC - PubMed
    1. Wang A, et al. Opposing effects of fasting metabolism on tissue tolerance in bacterial and viral inflammation. Cell. 2016;166:1512–1525. doi: 10.1016/j.cell.2016.07.026. - DOI - PMC - PubMed

MeSH terms