

Toxicity profiles and protective effects of antifreeze proteins from insect in mammalian models
- PMID: 35901986
- PMCID: PMC10174066
- DOI: 10.1016/j.toxlet.2022.07.009
Toxicity profiles and protective effects of antifreeze proteins from insect in mammalian models
Abstract
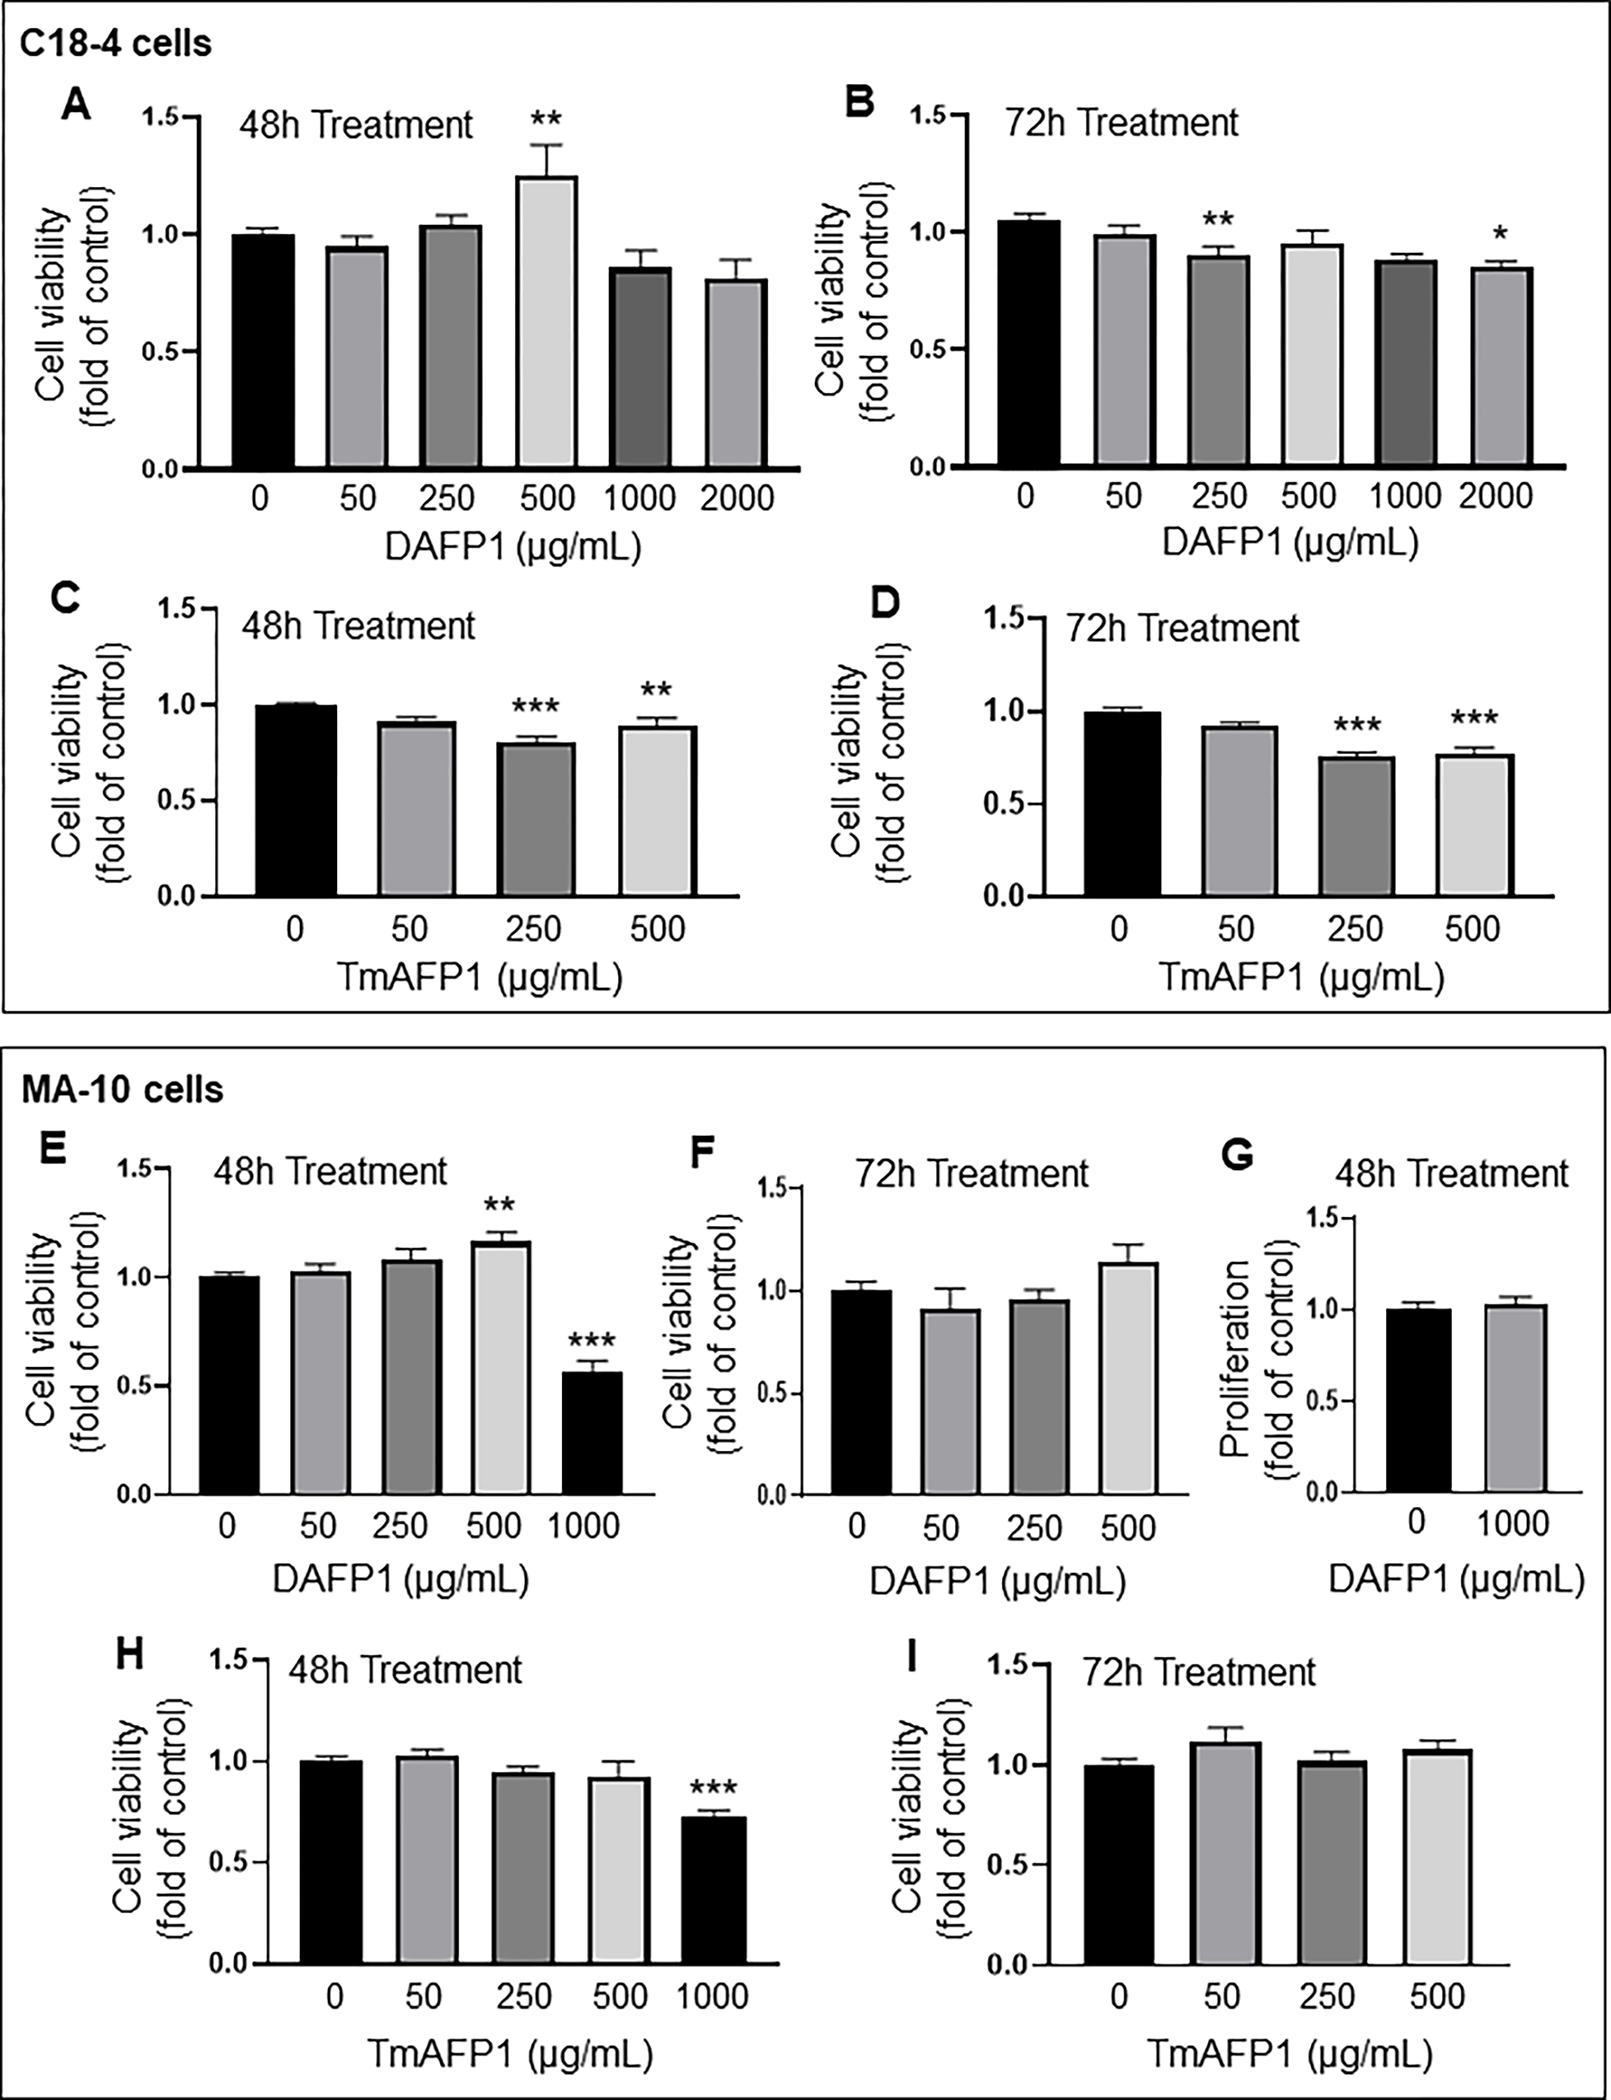
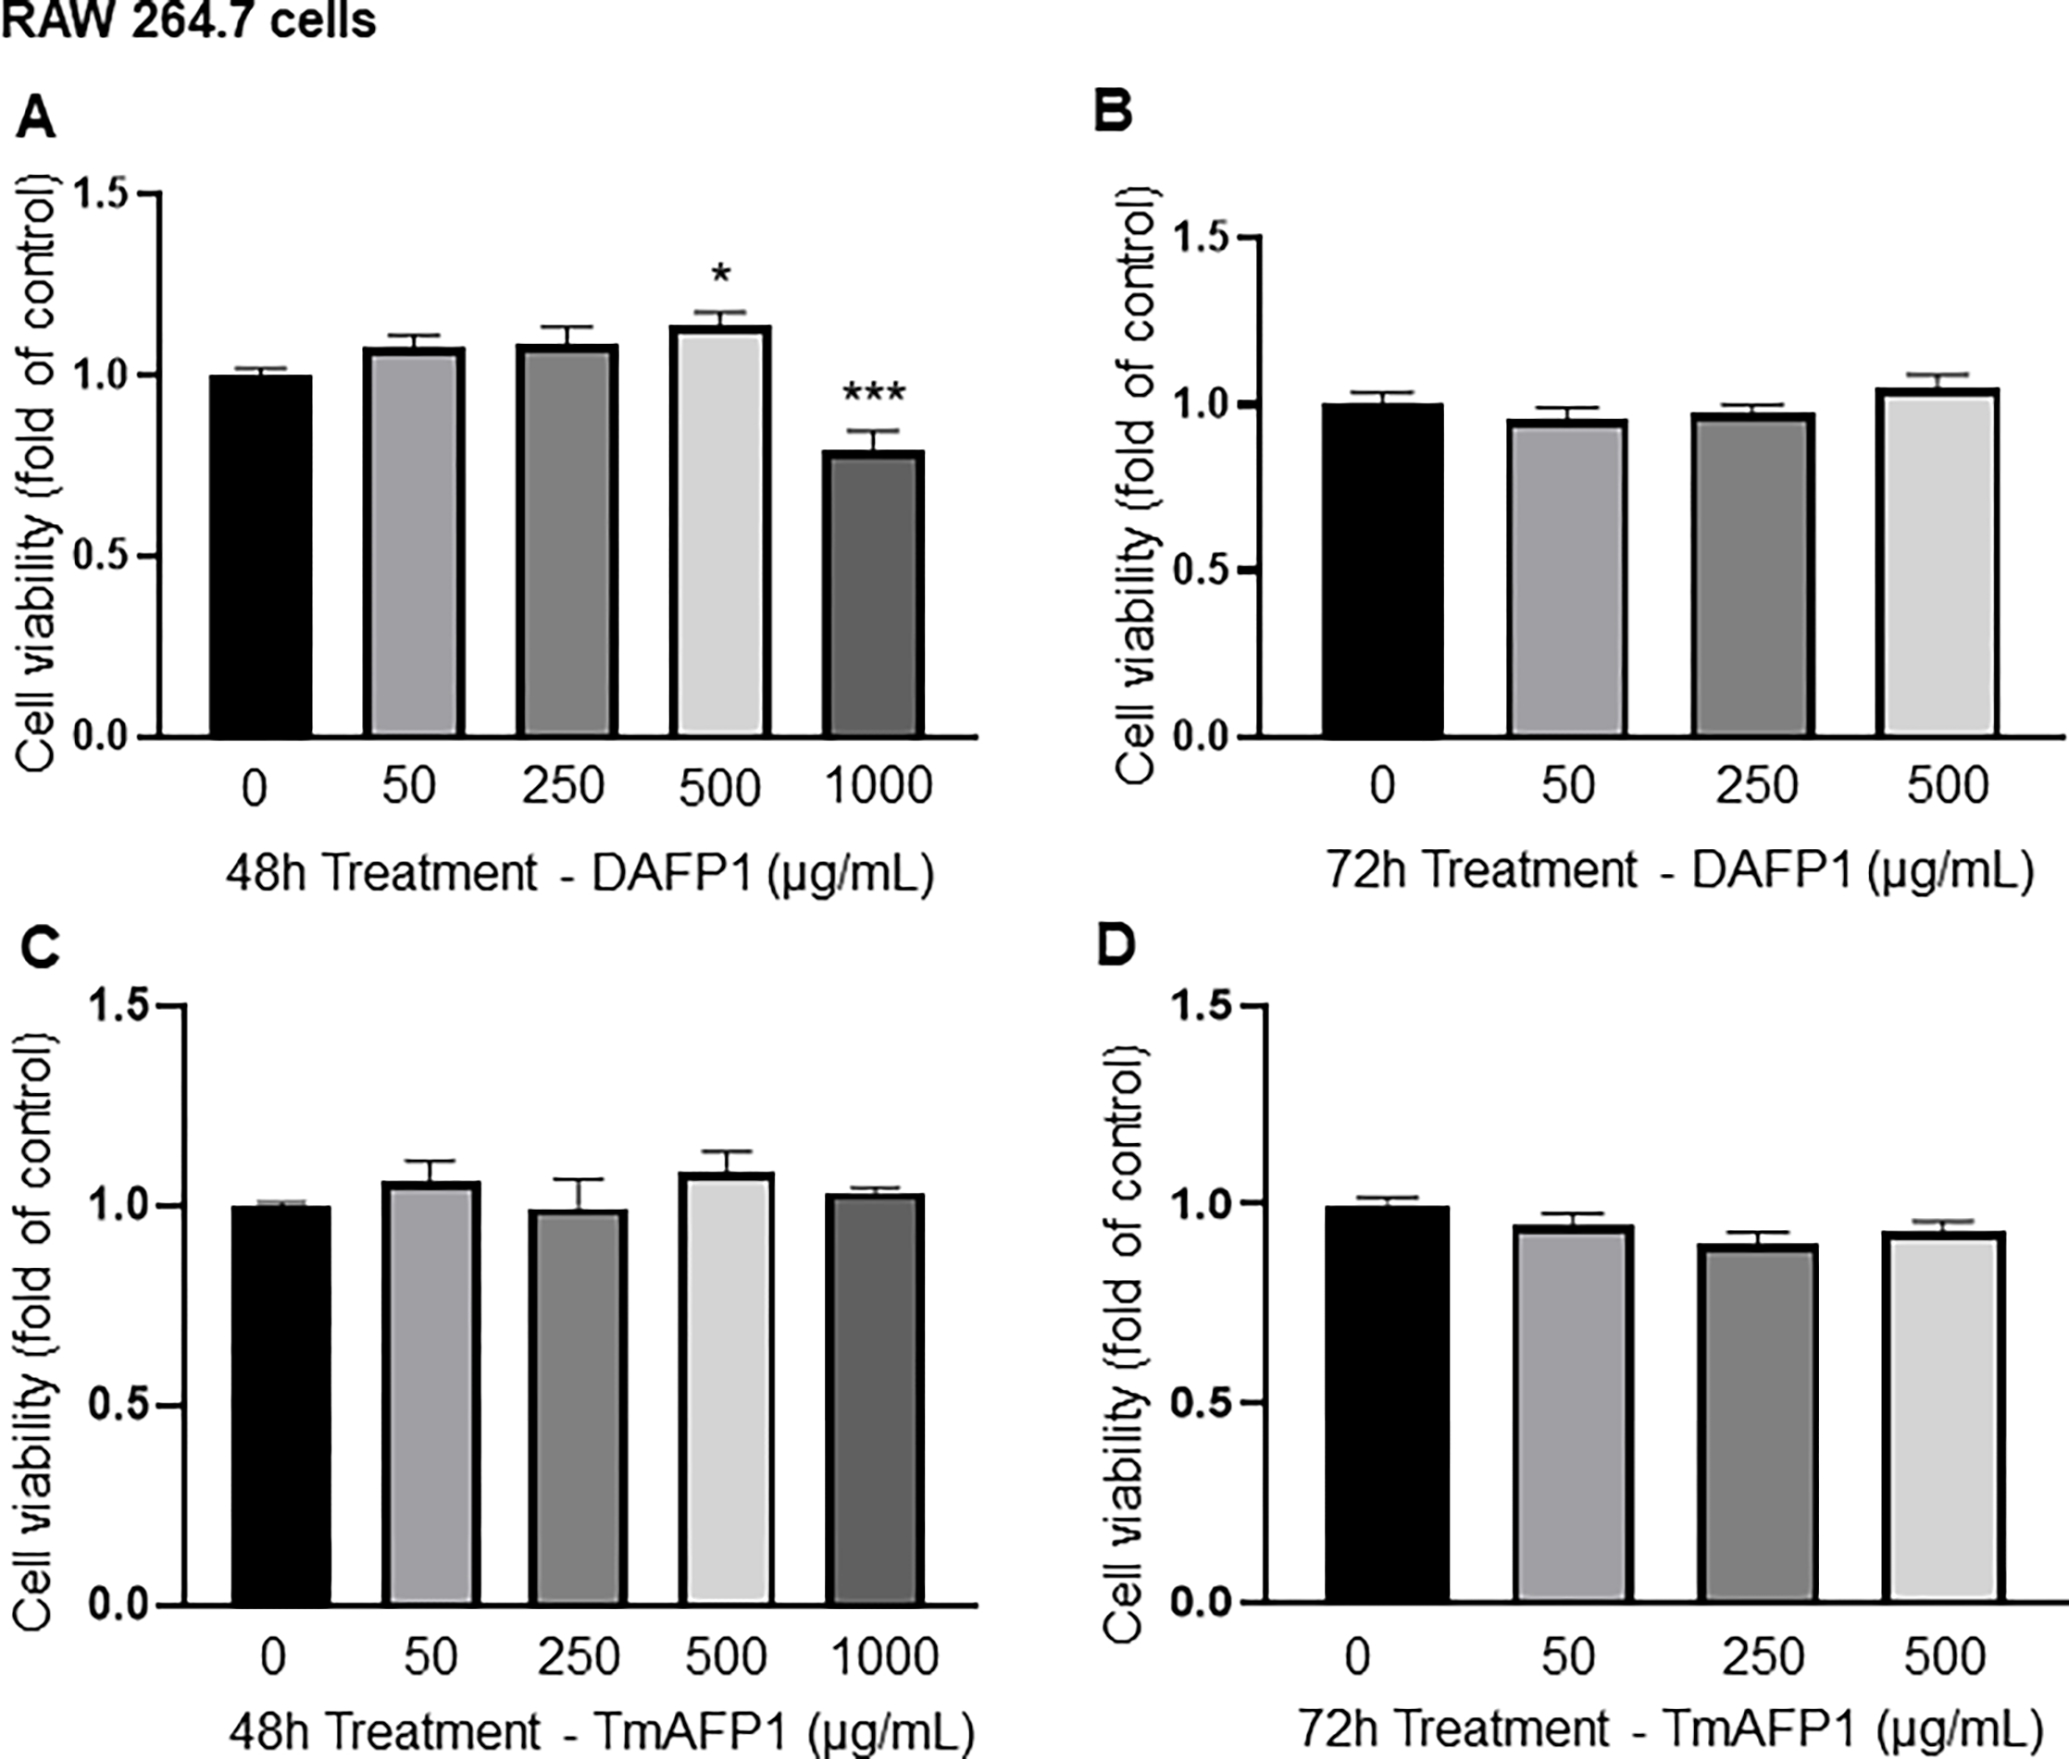
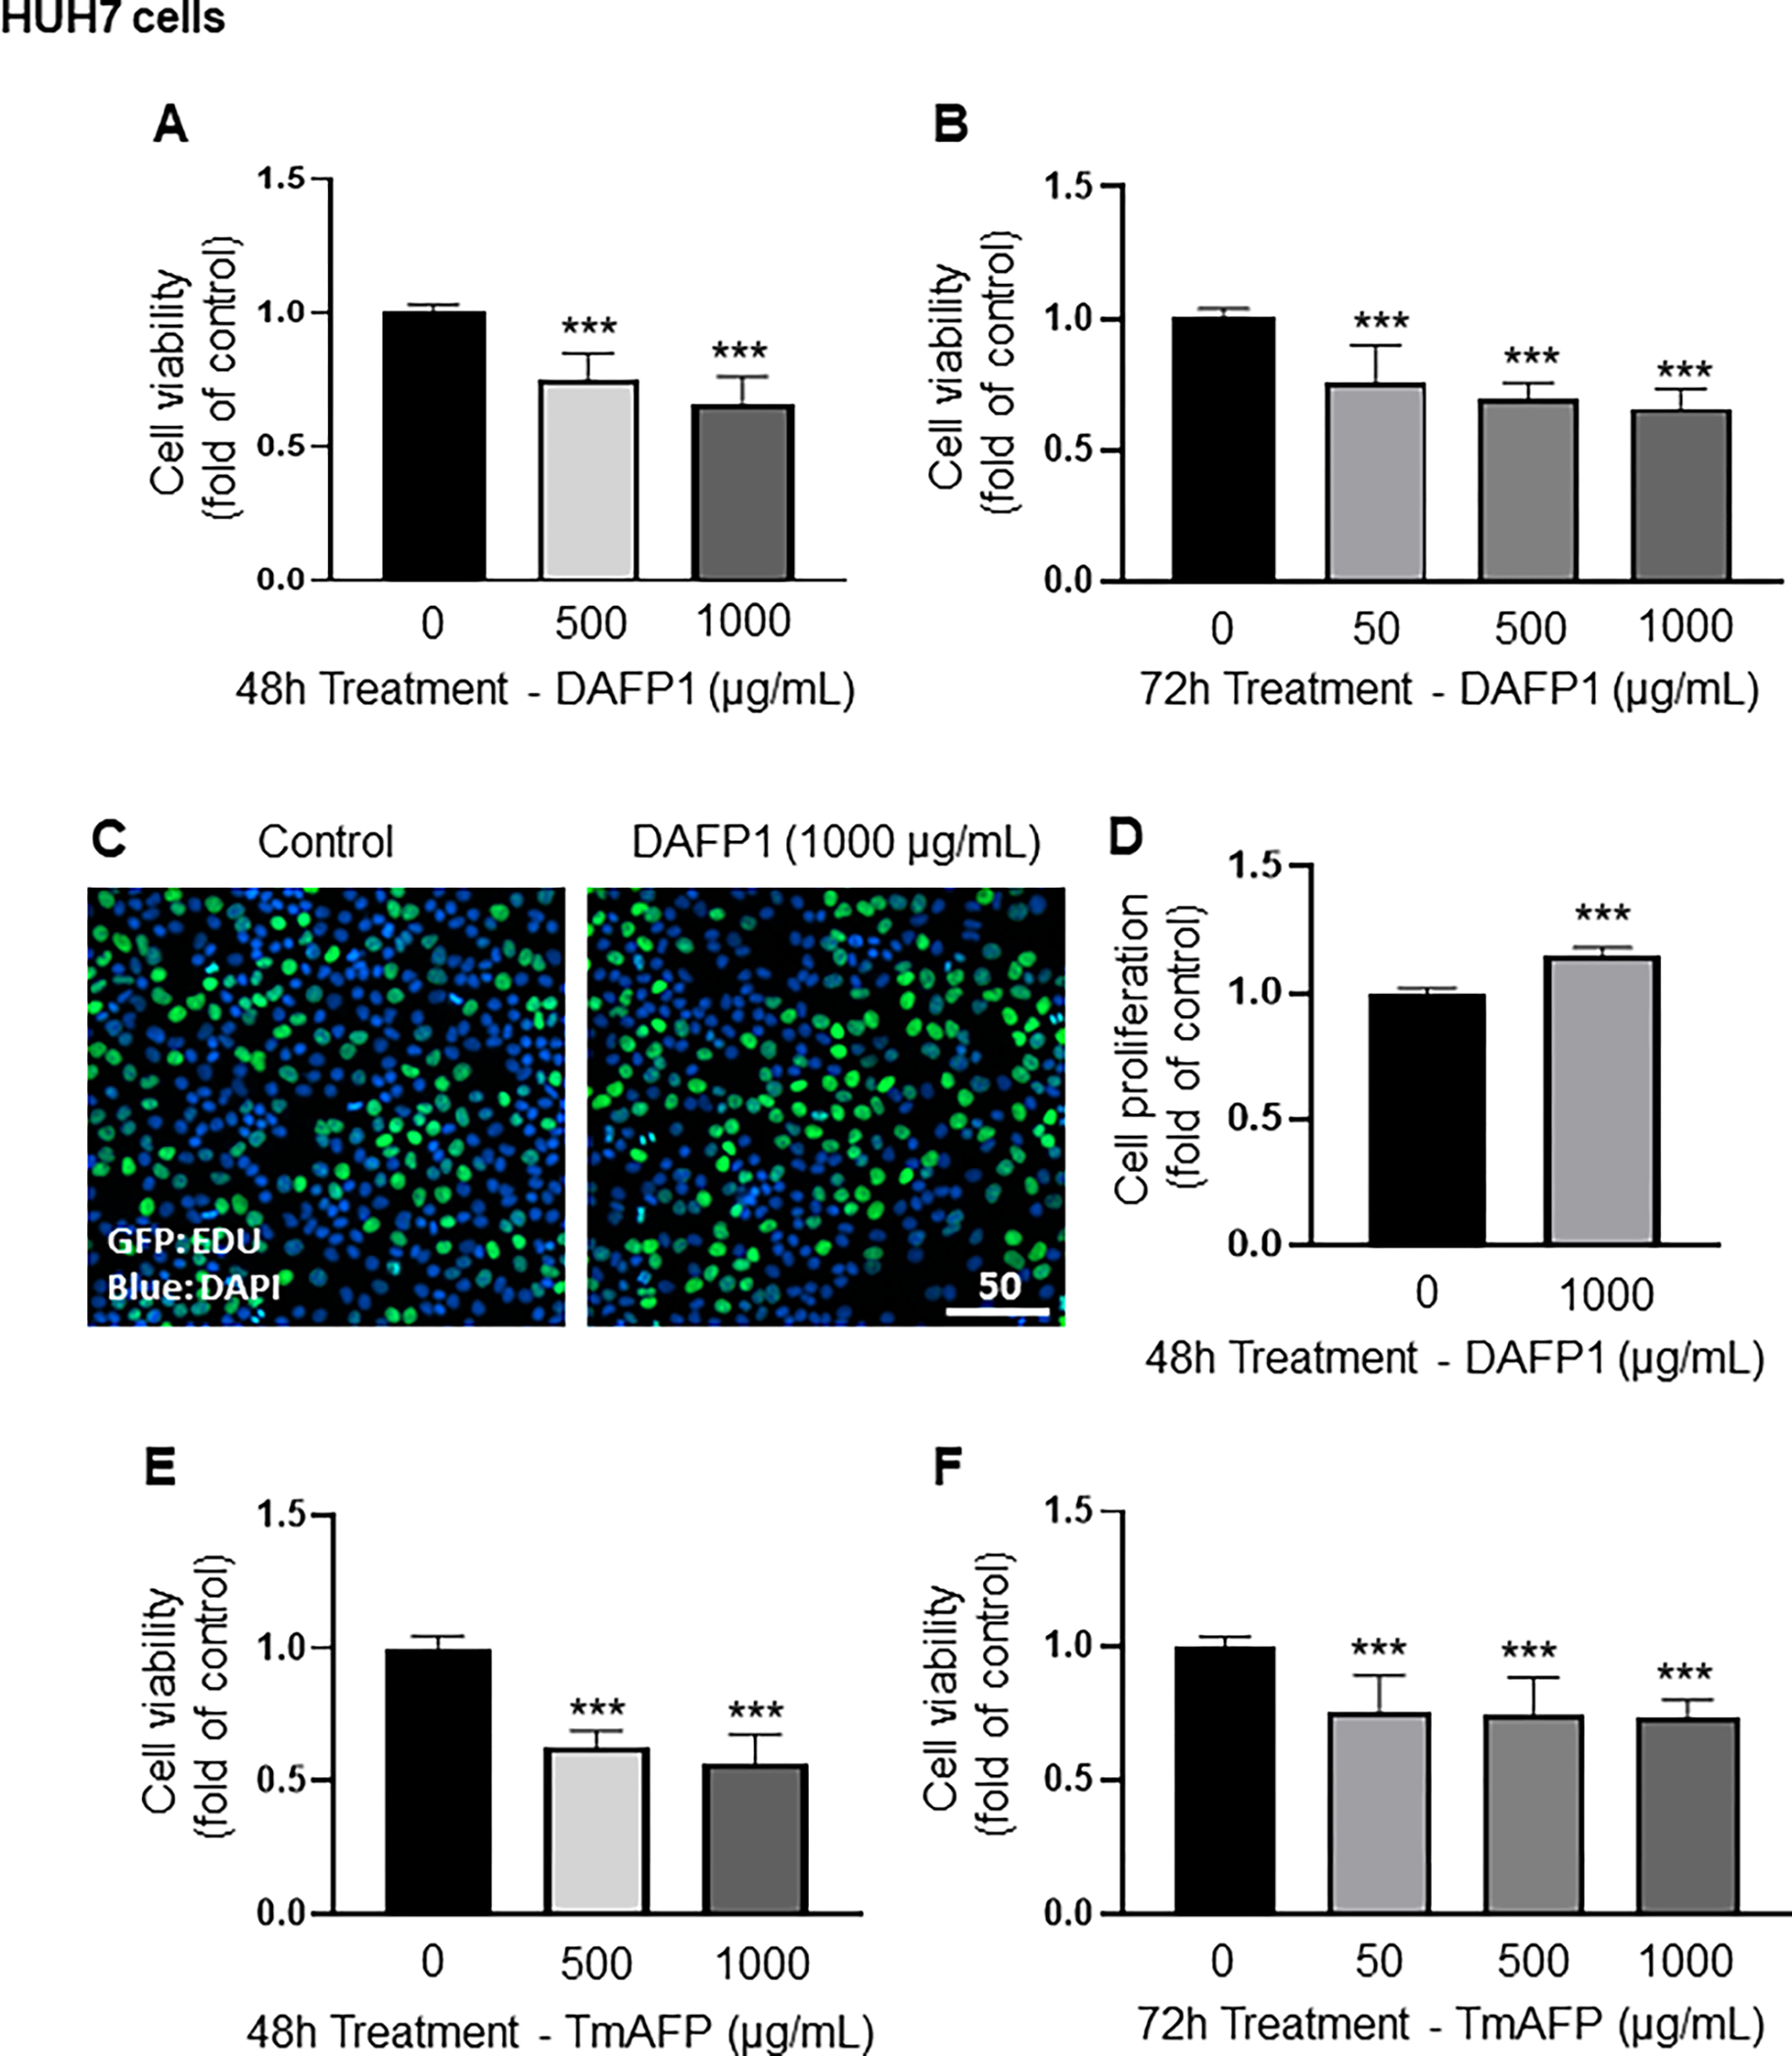
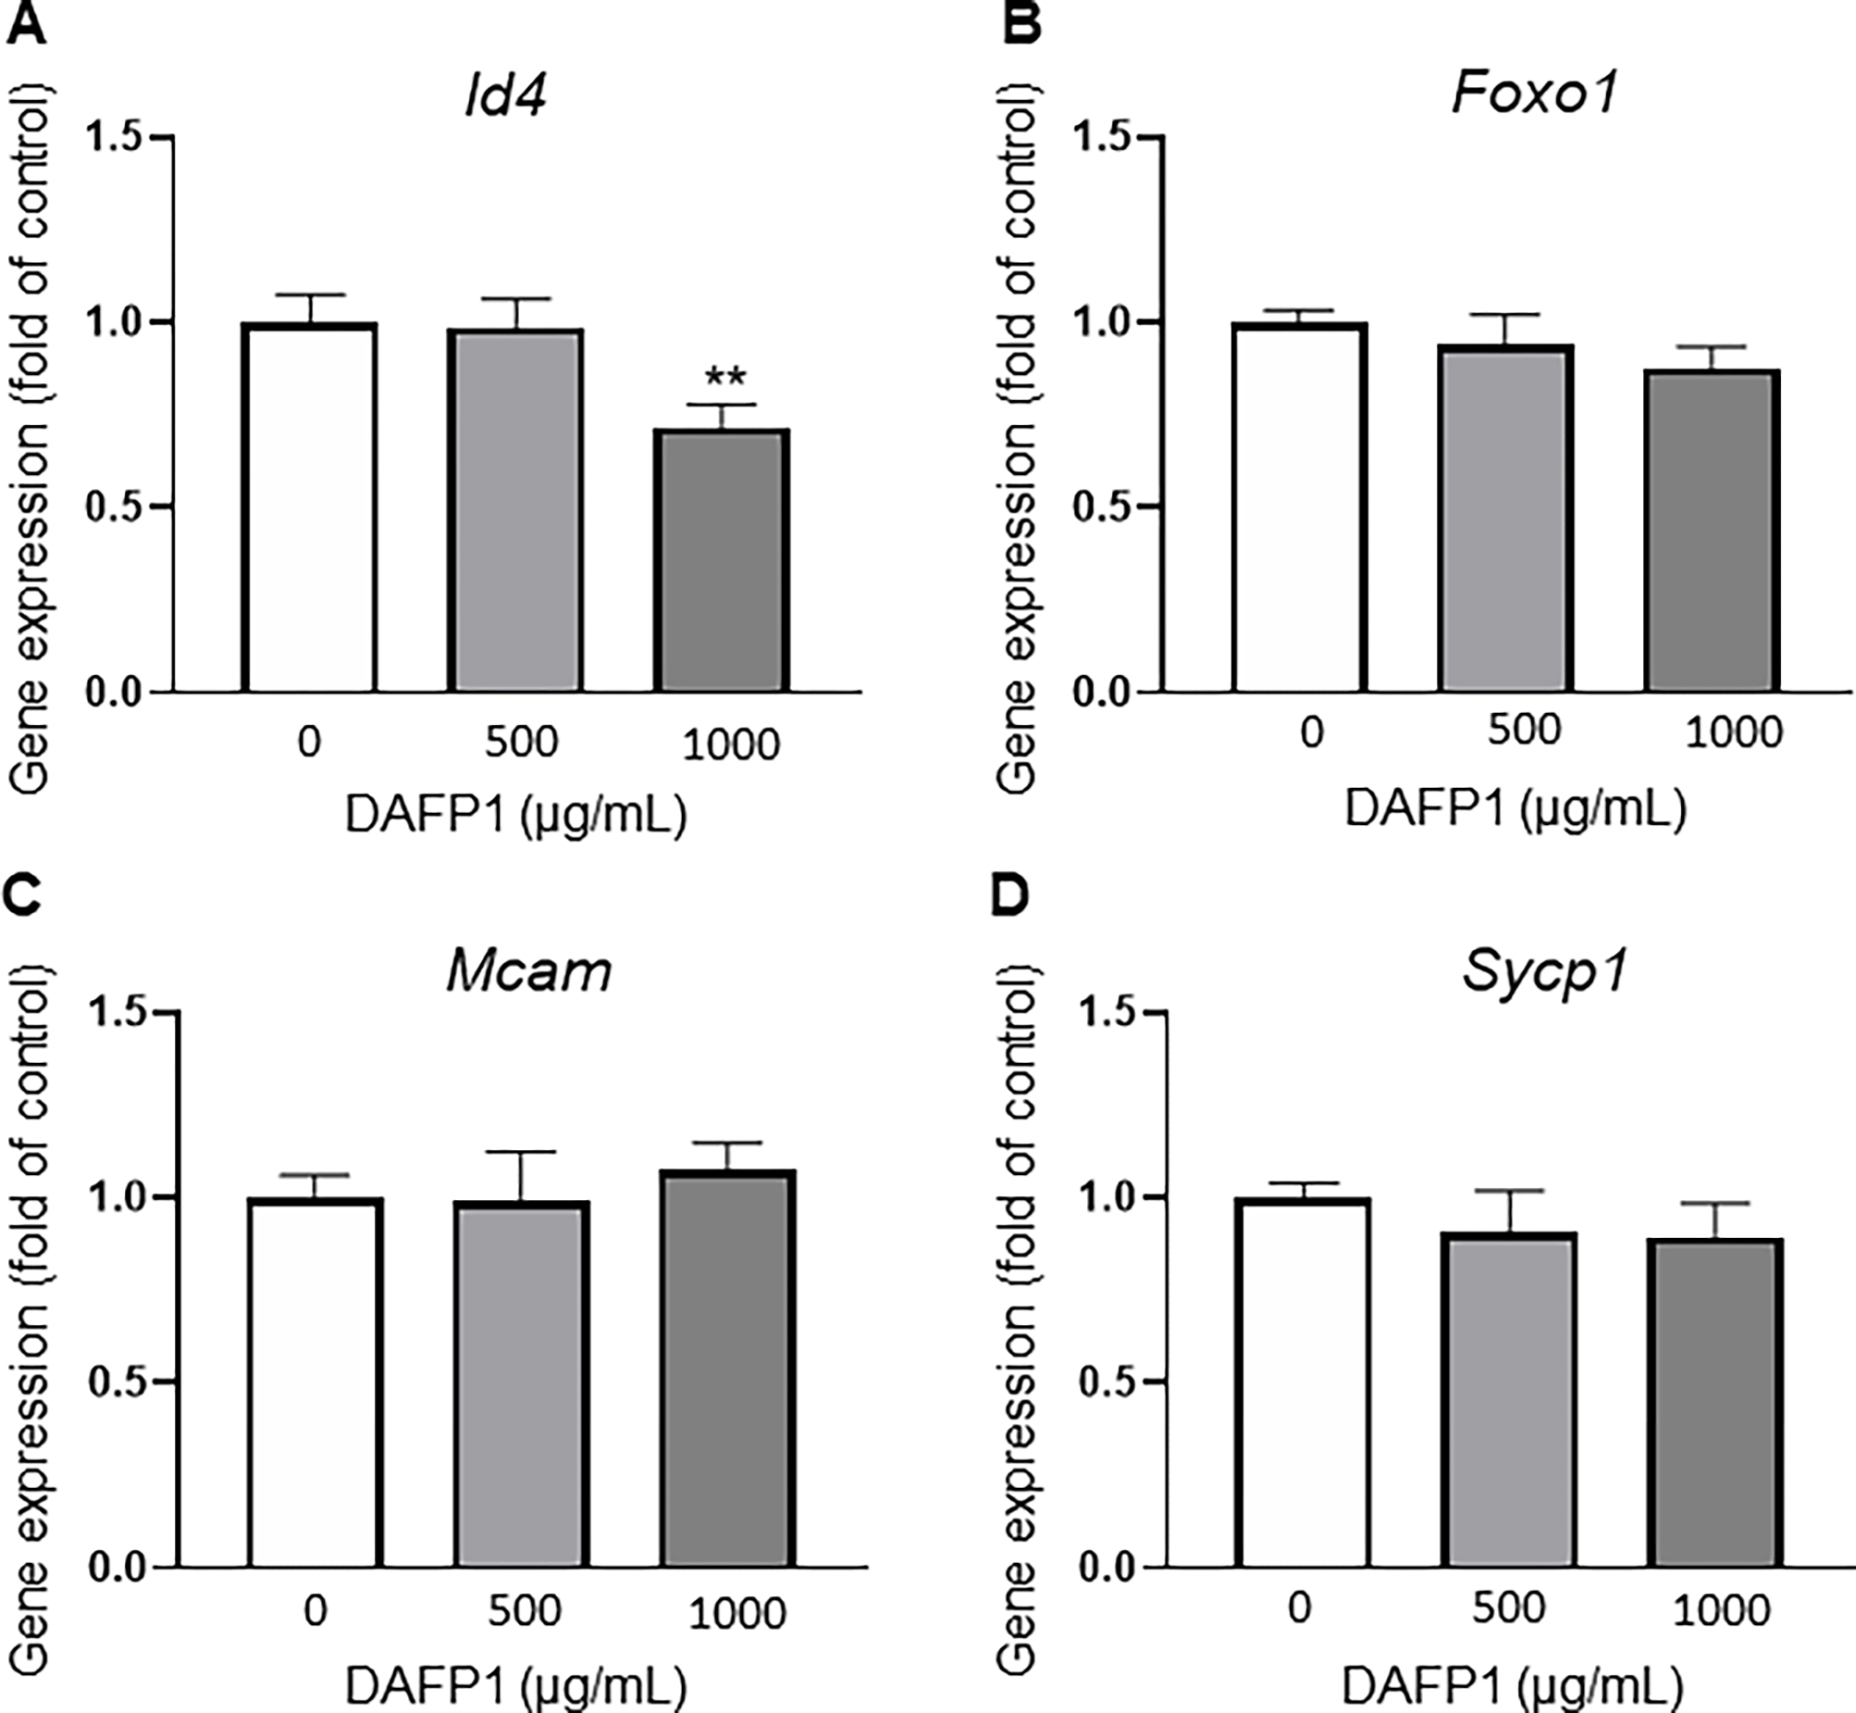
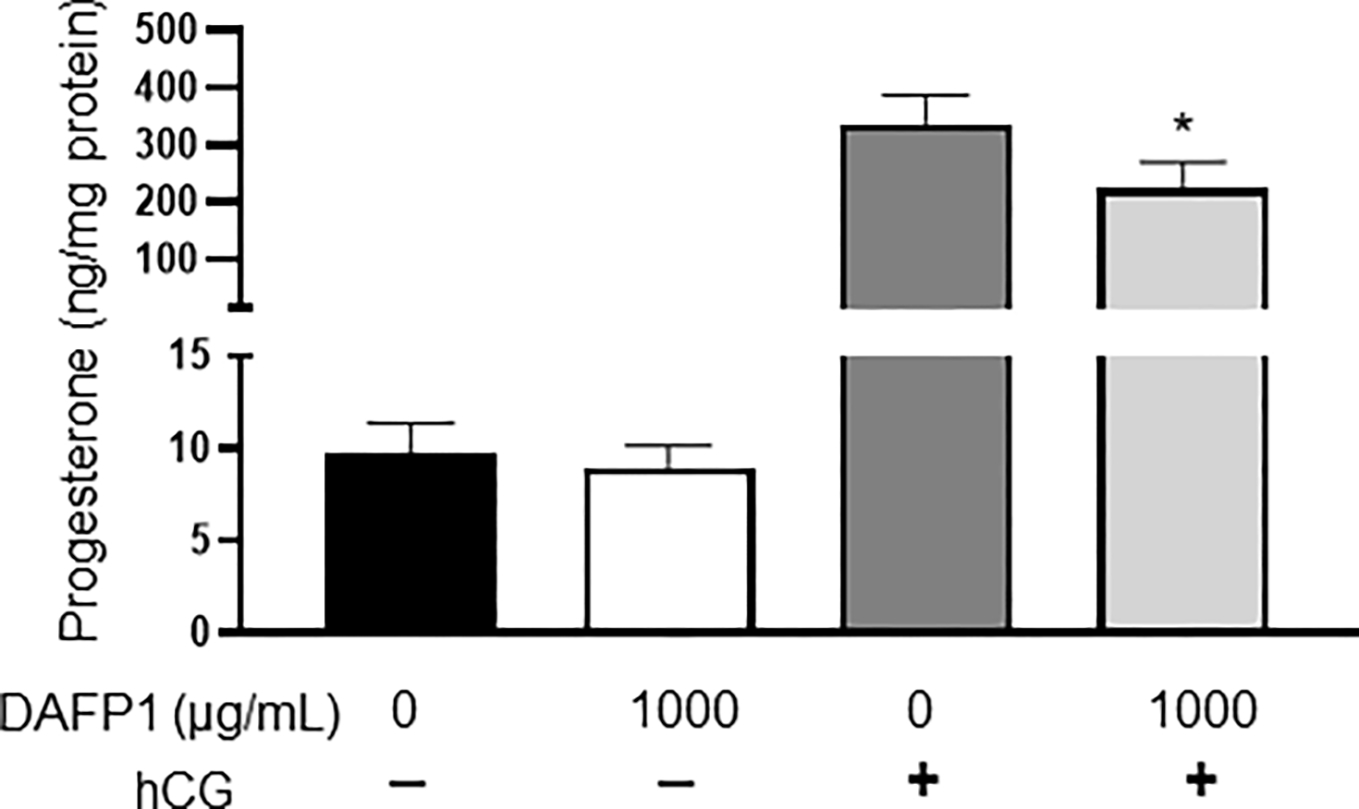
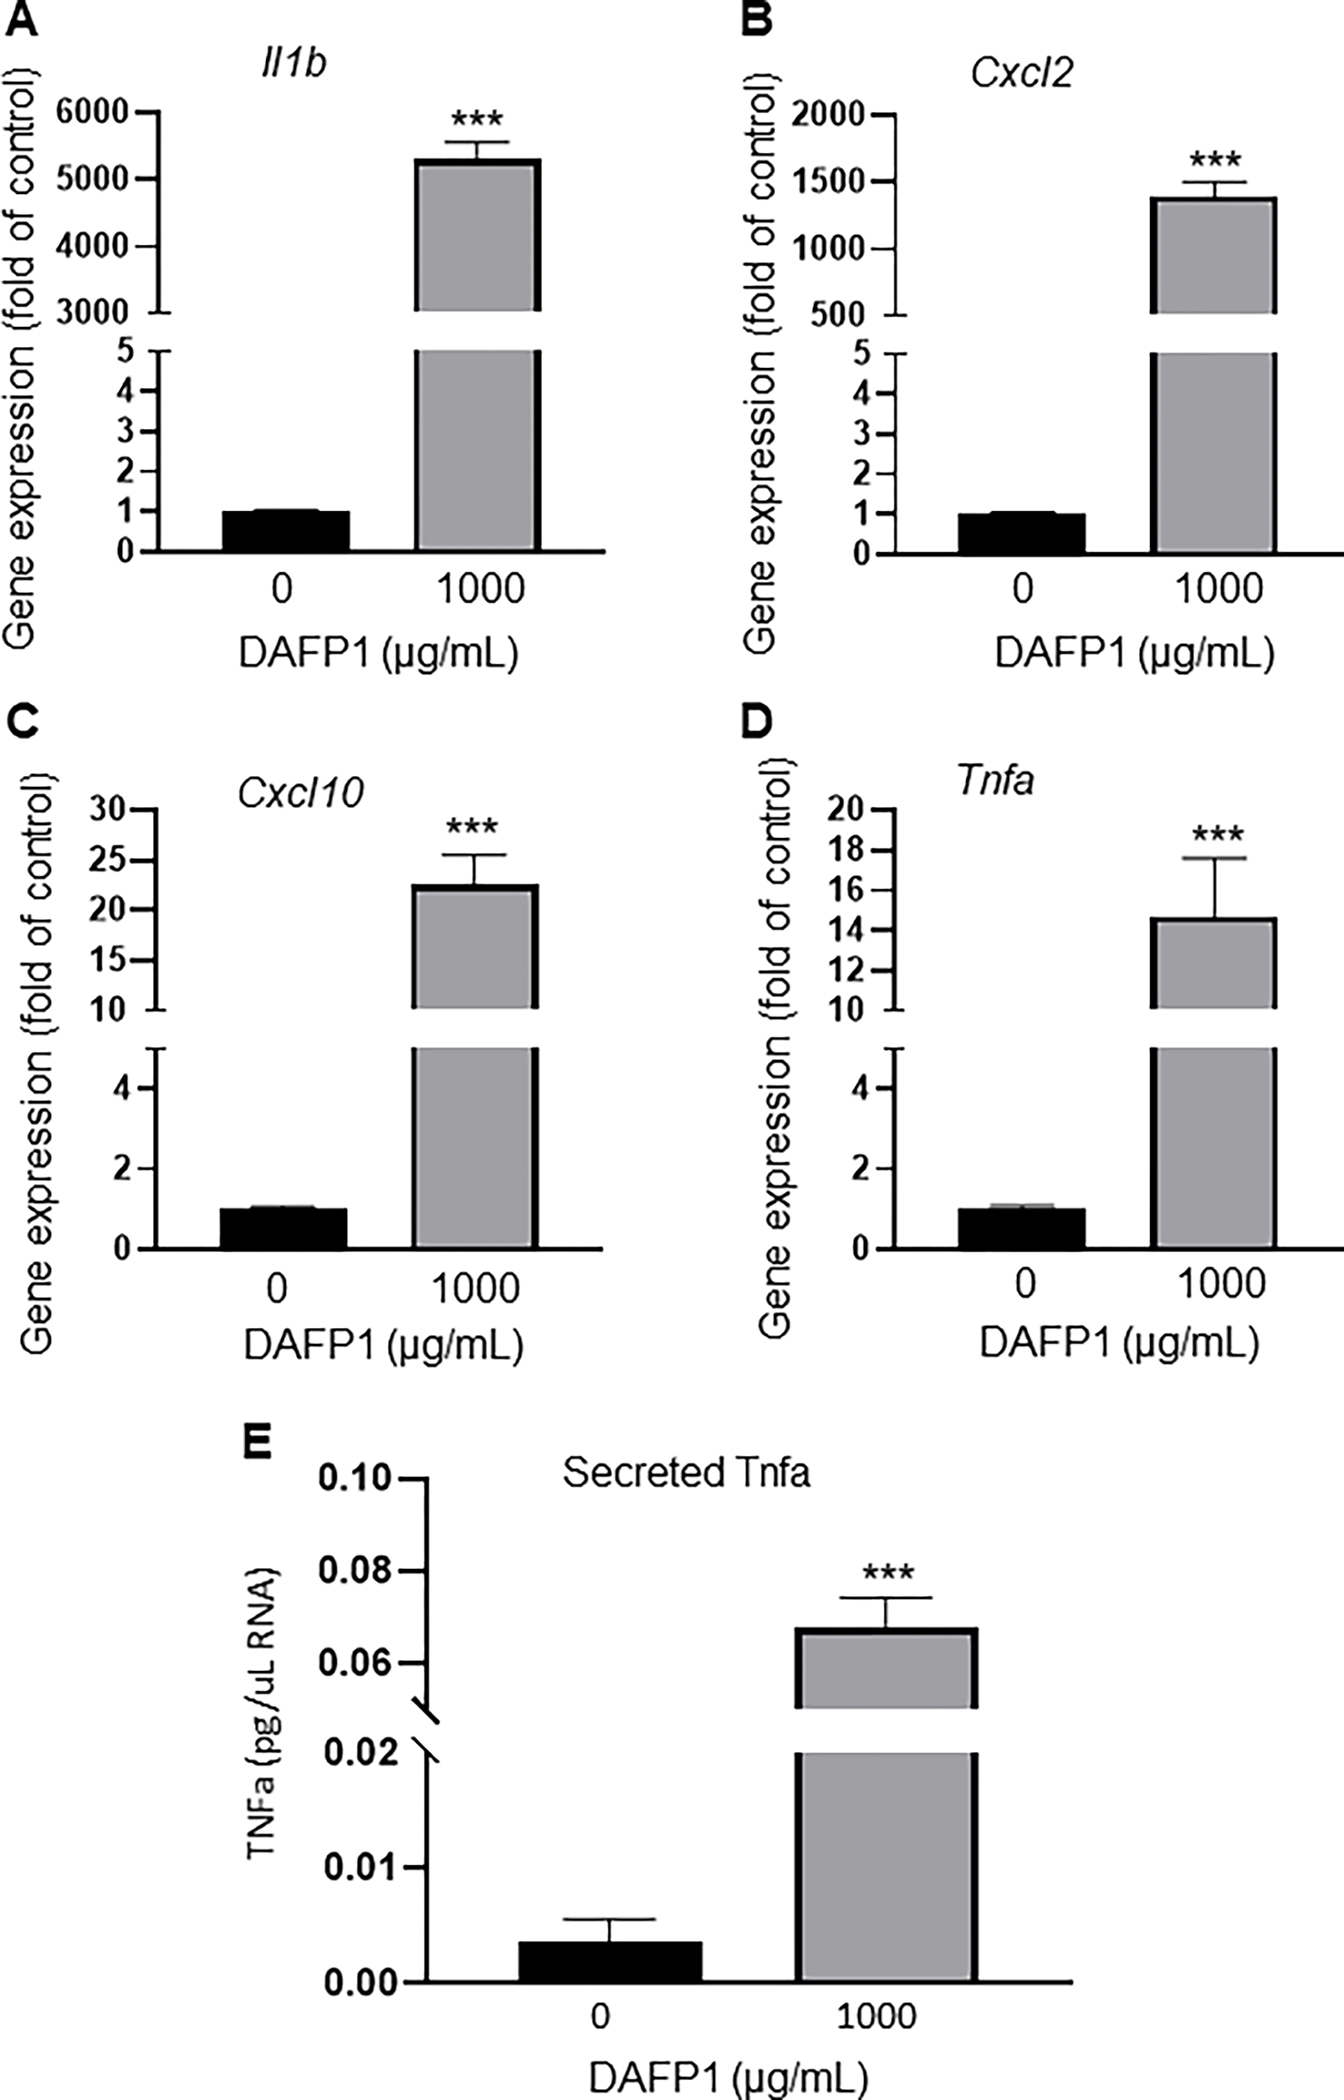
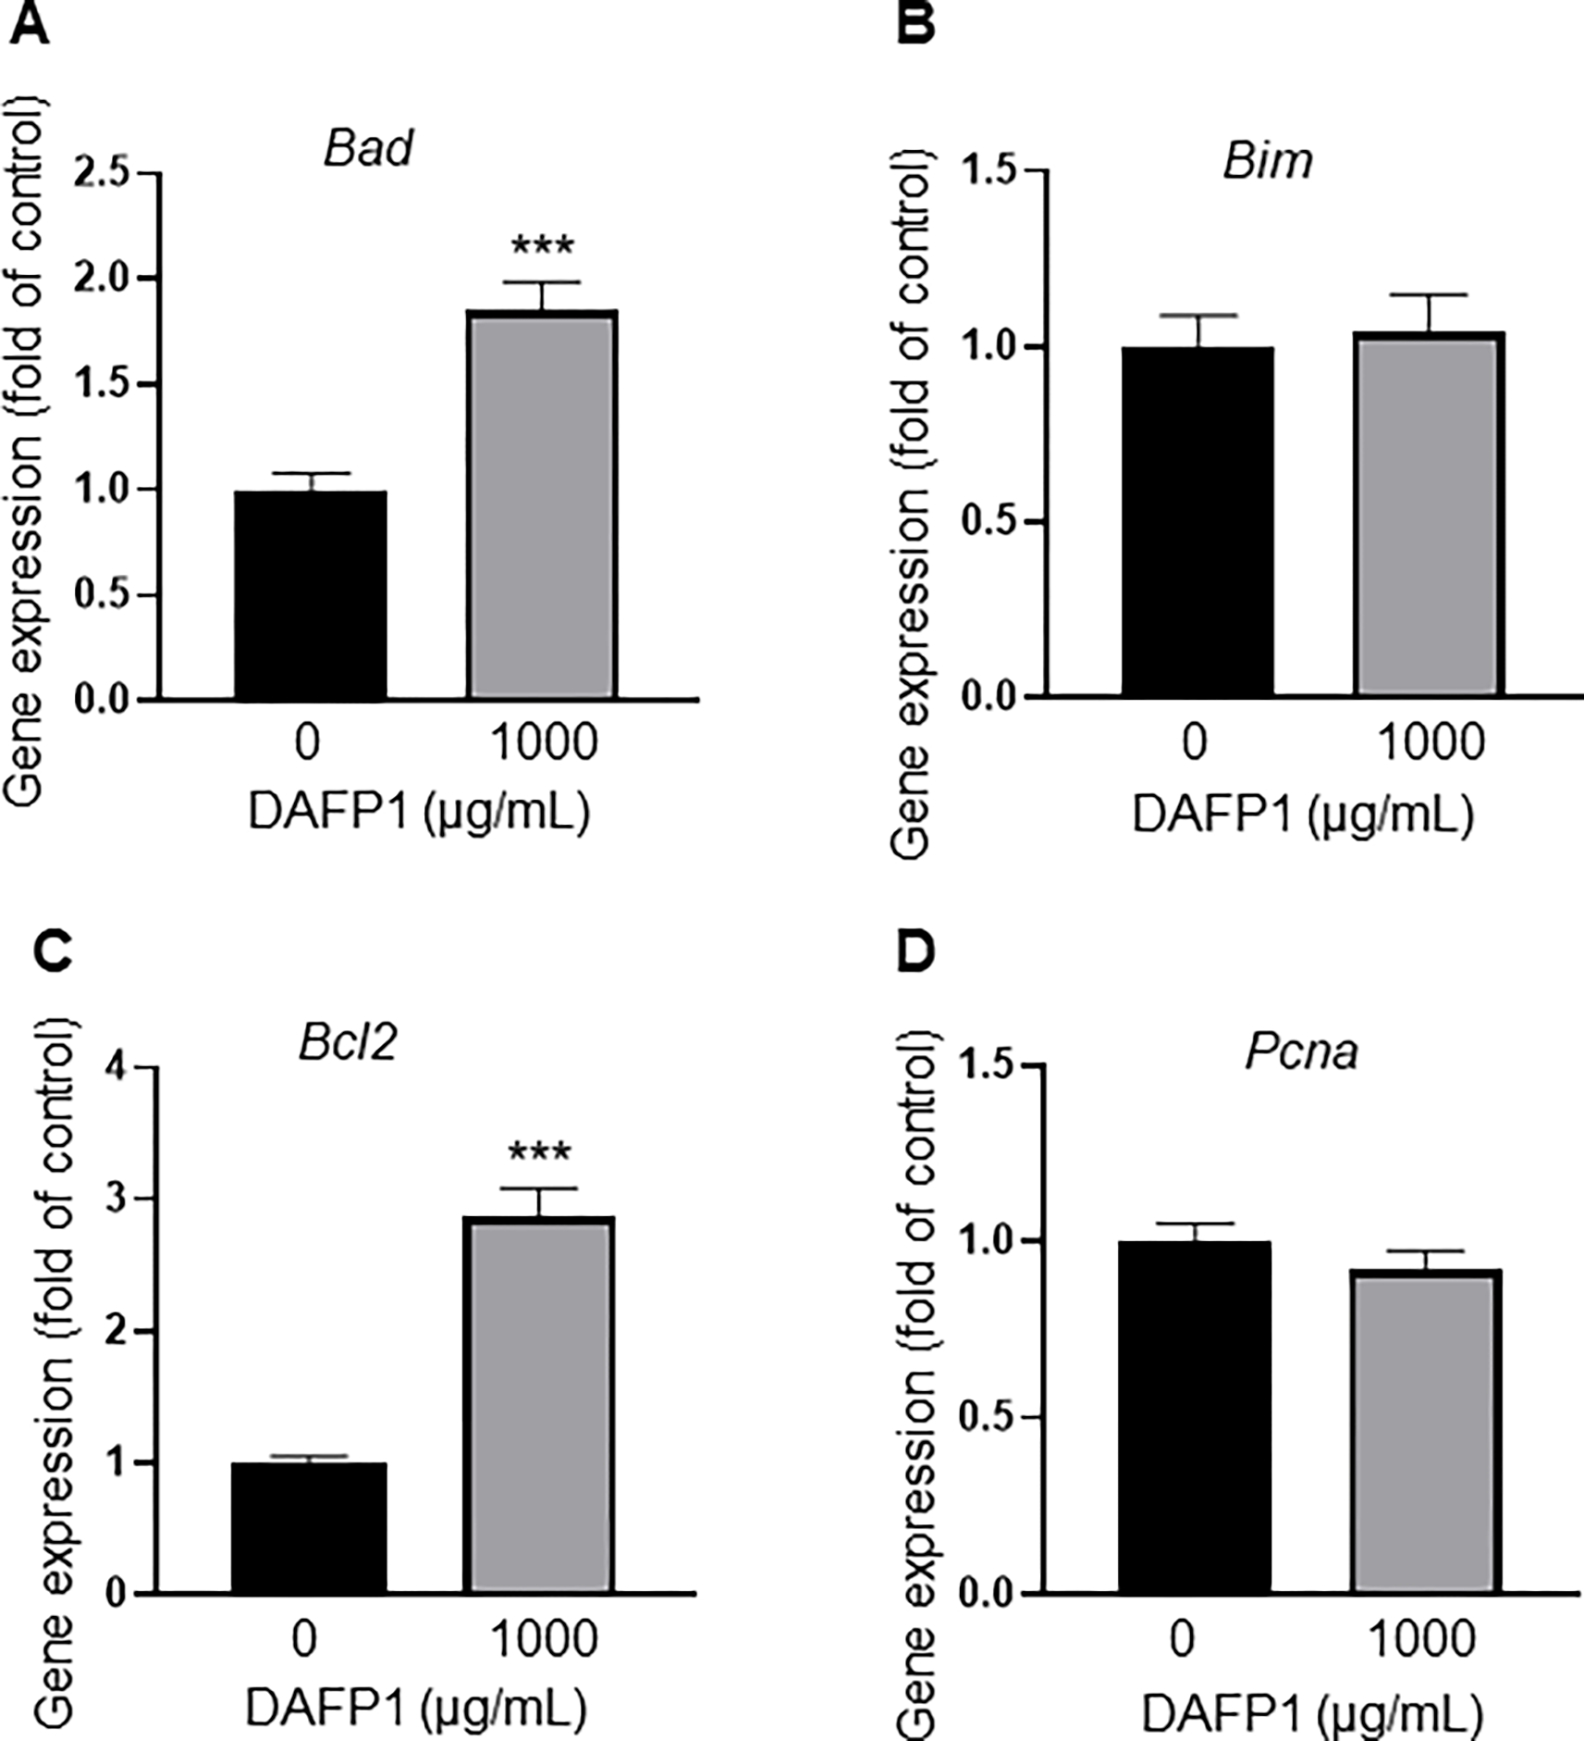
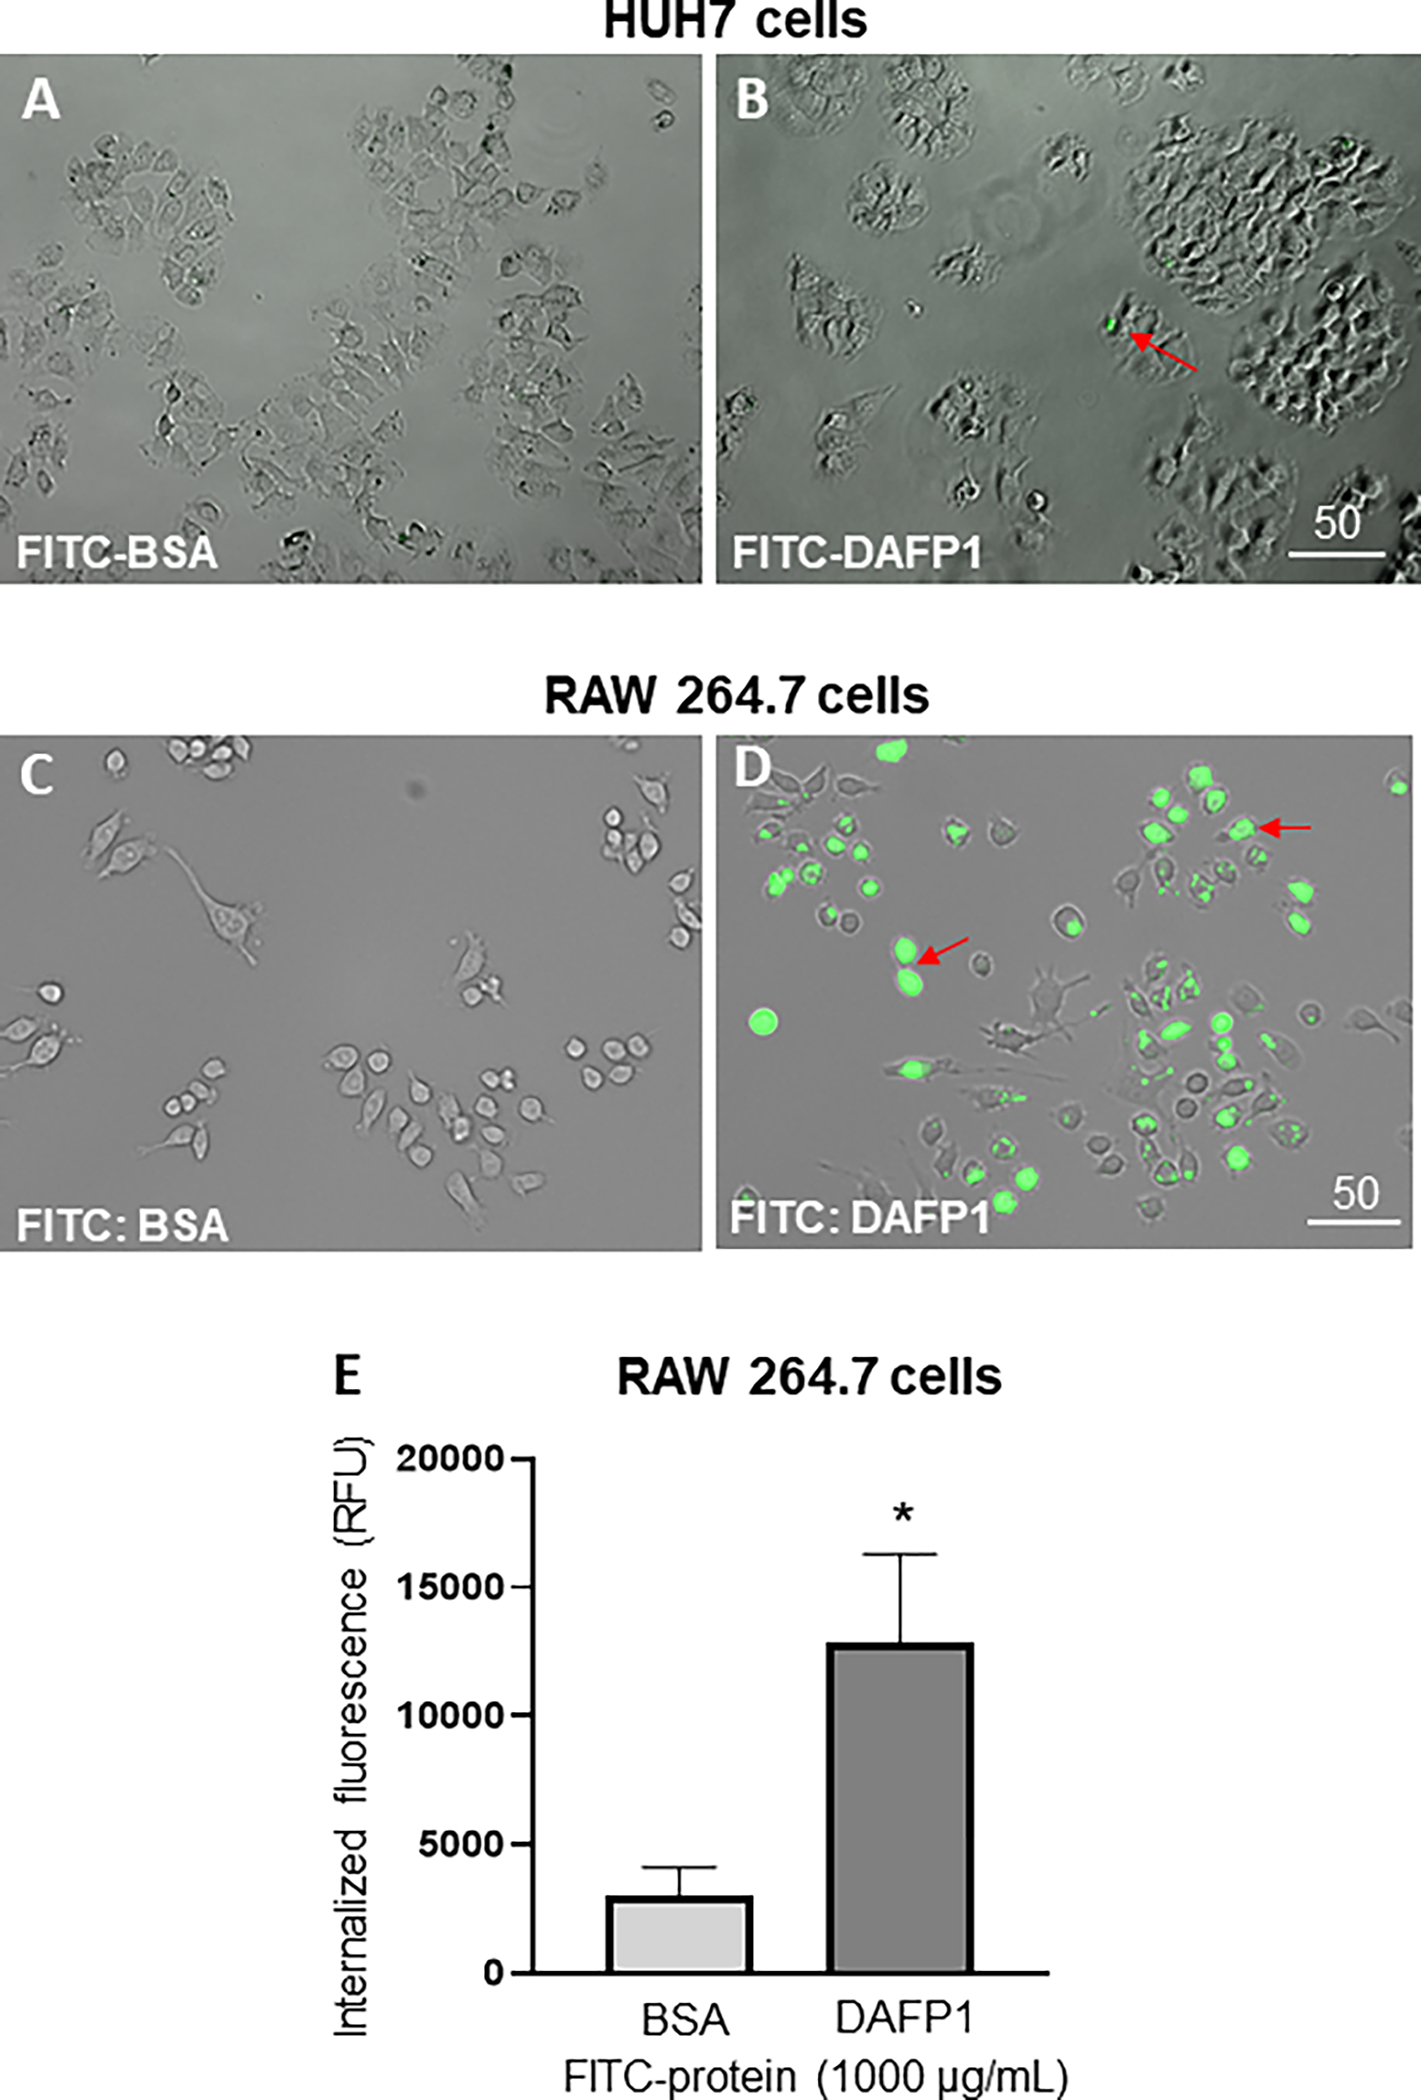
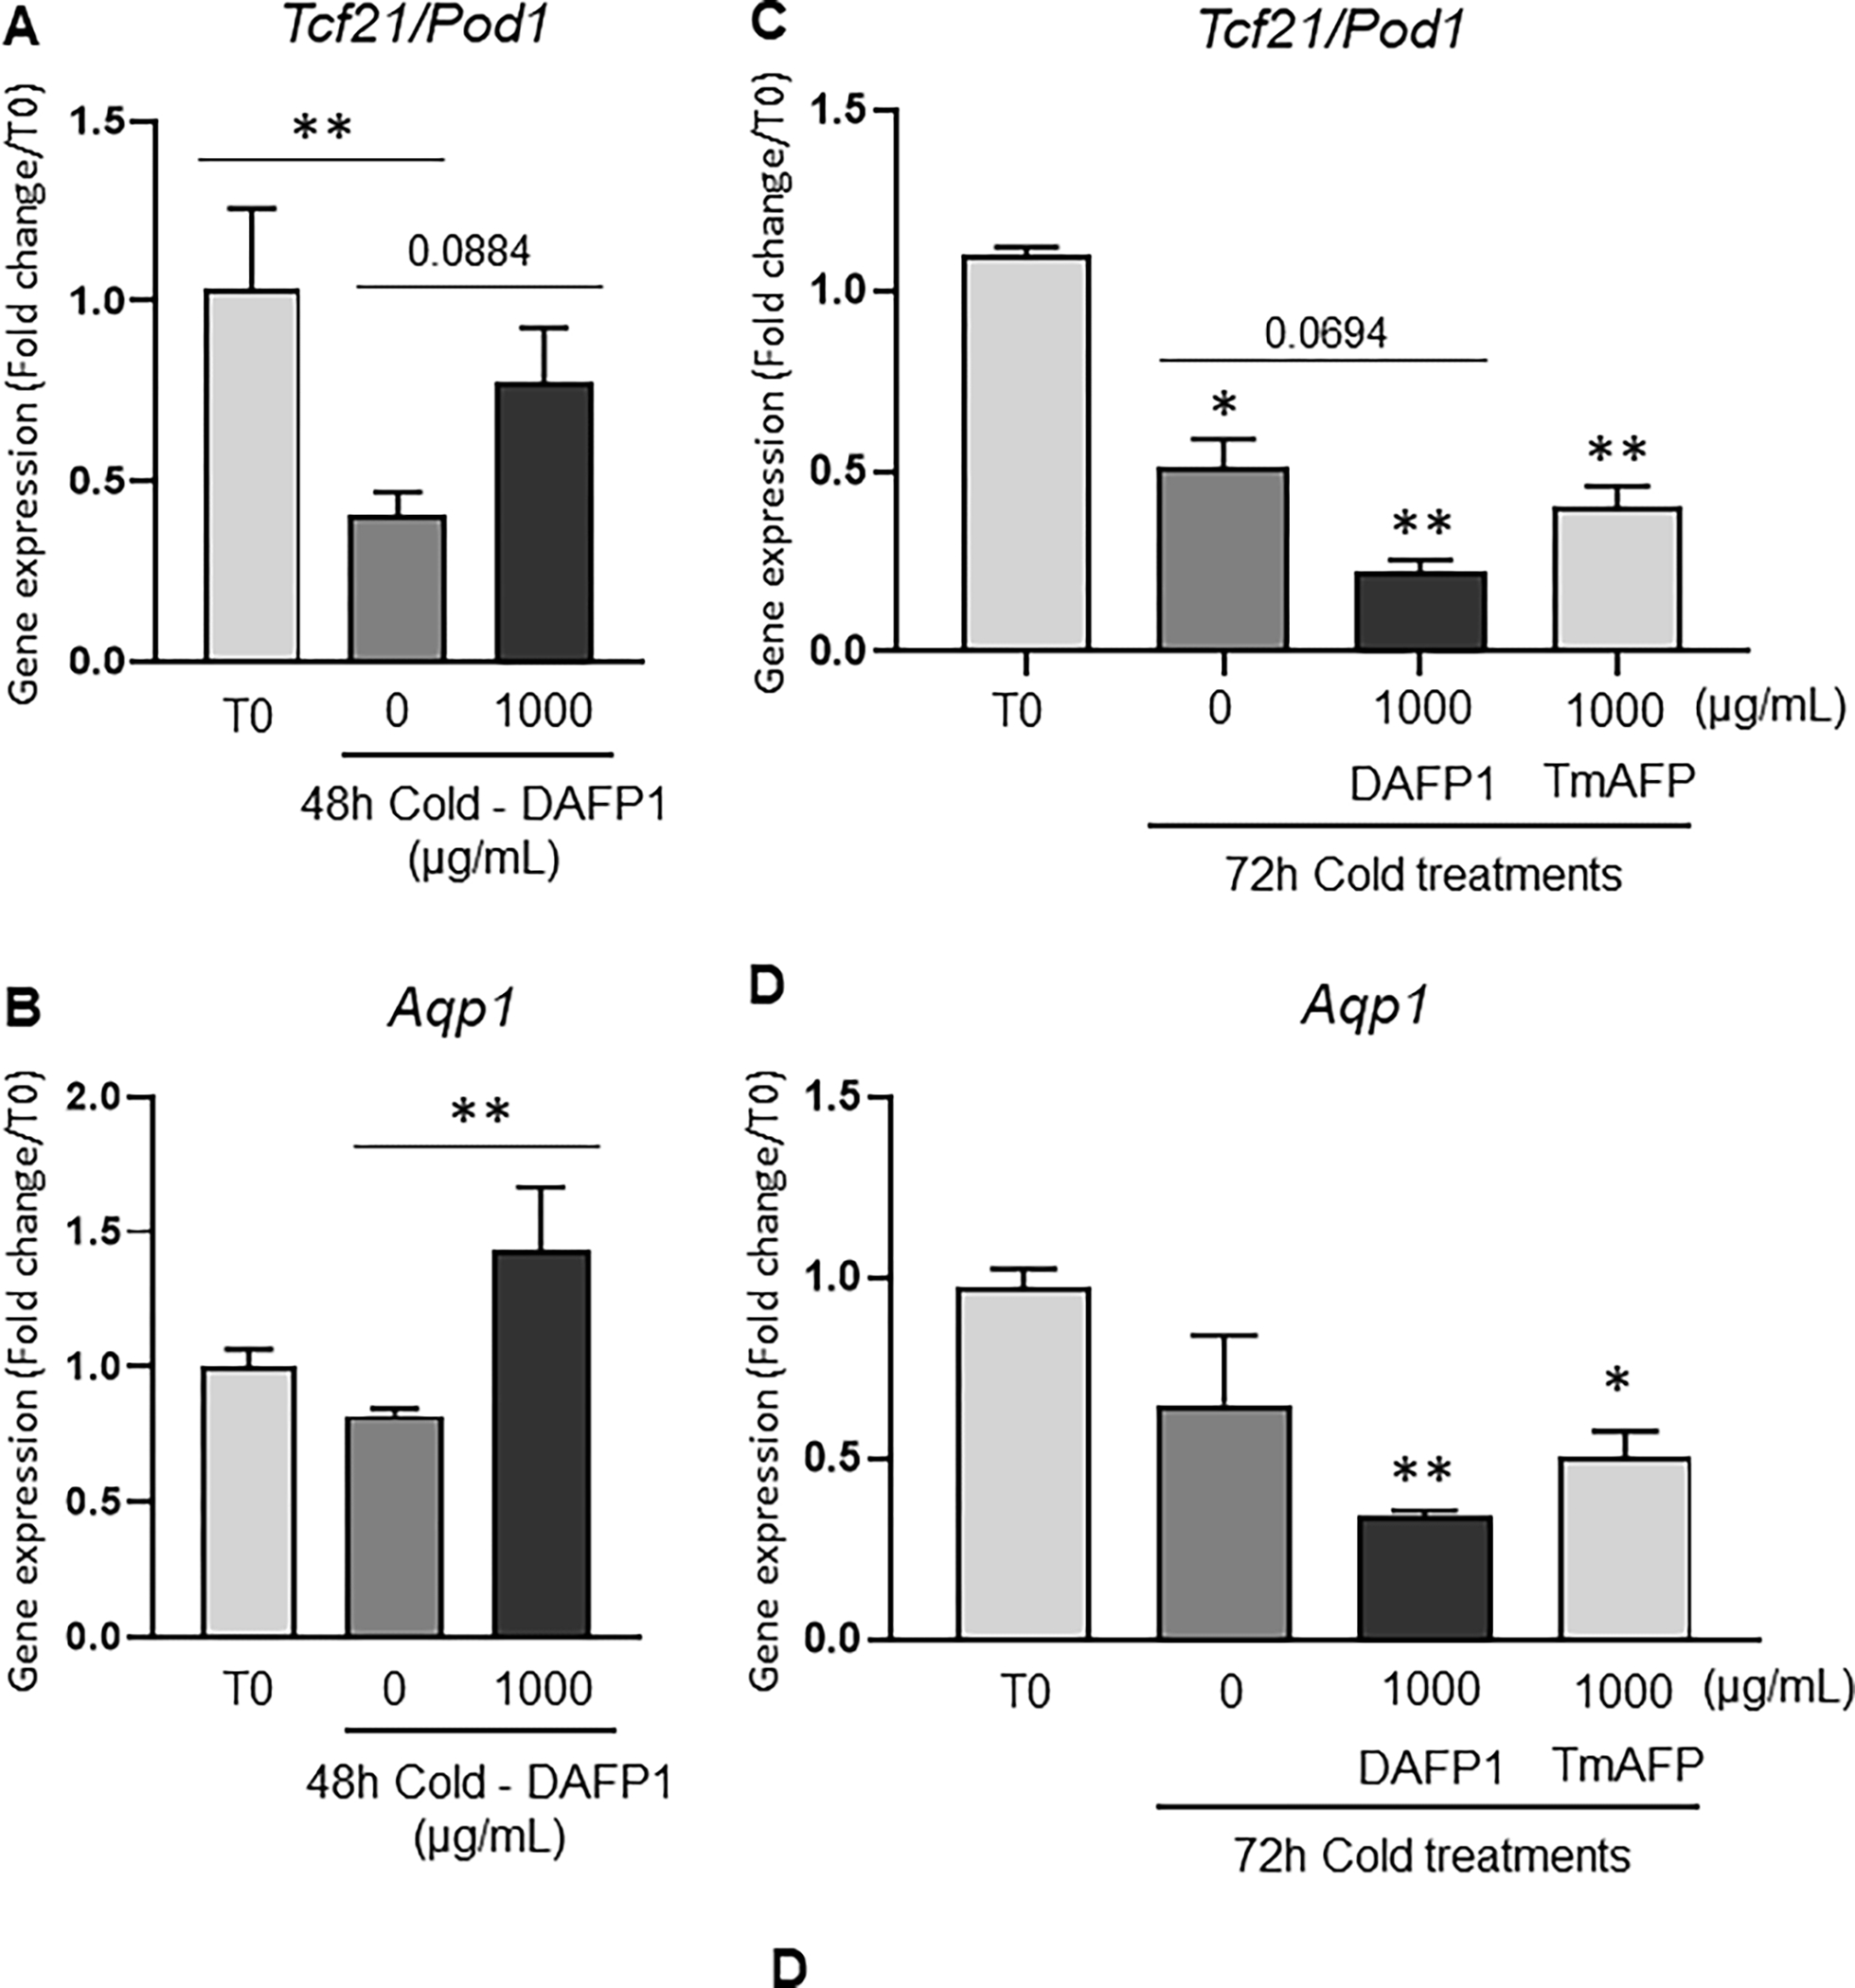
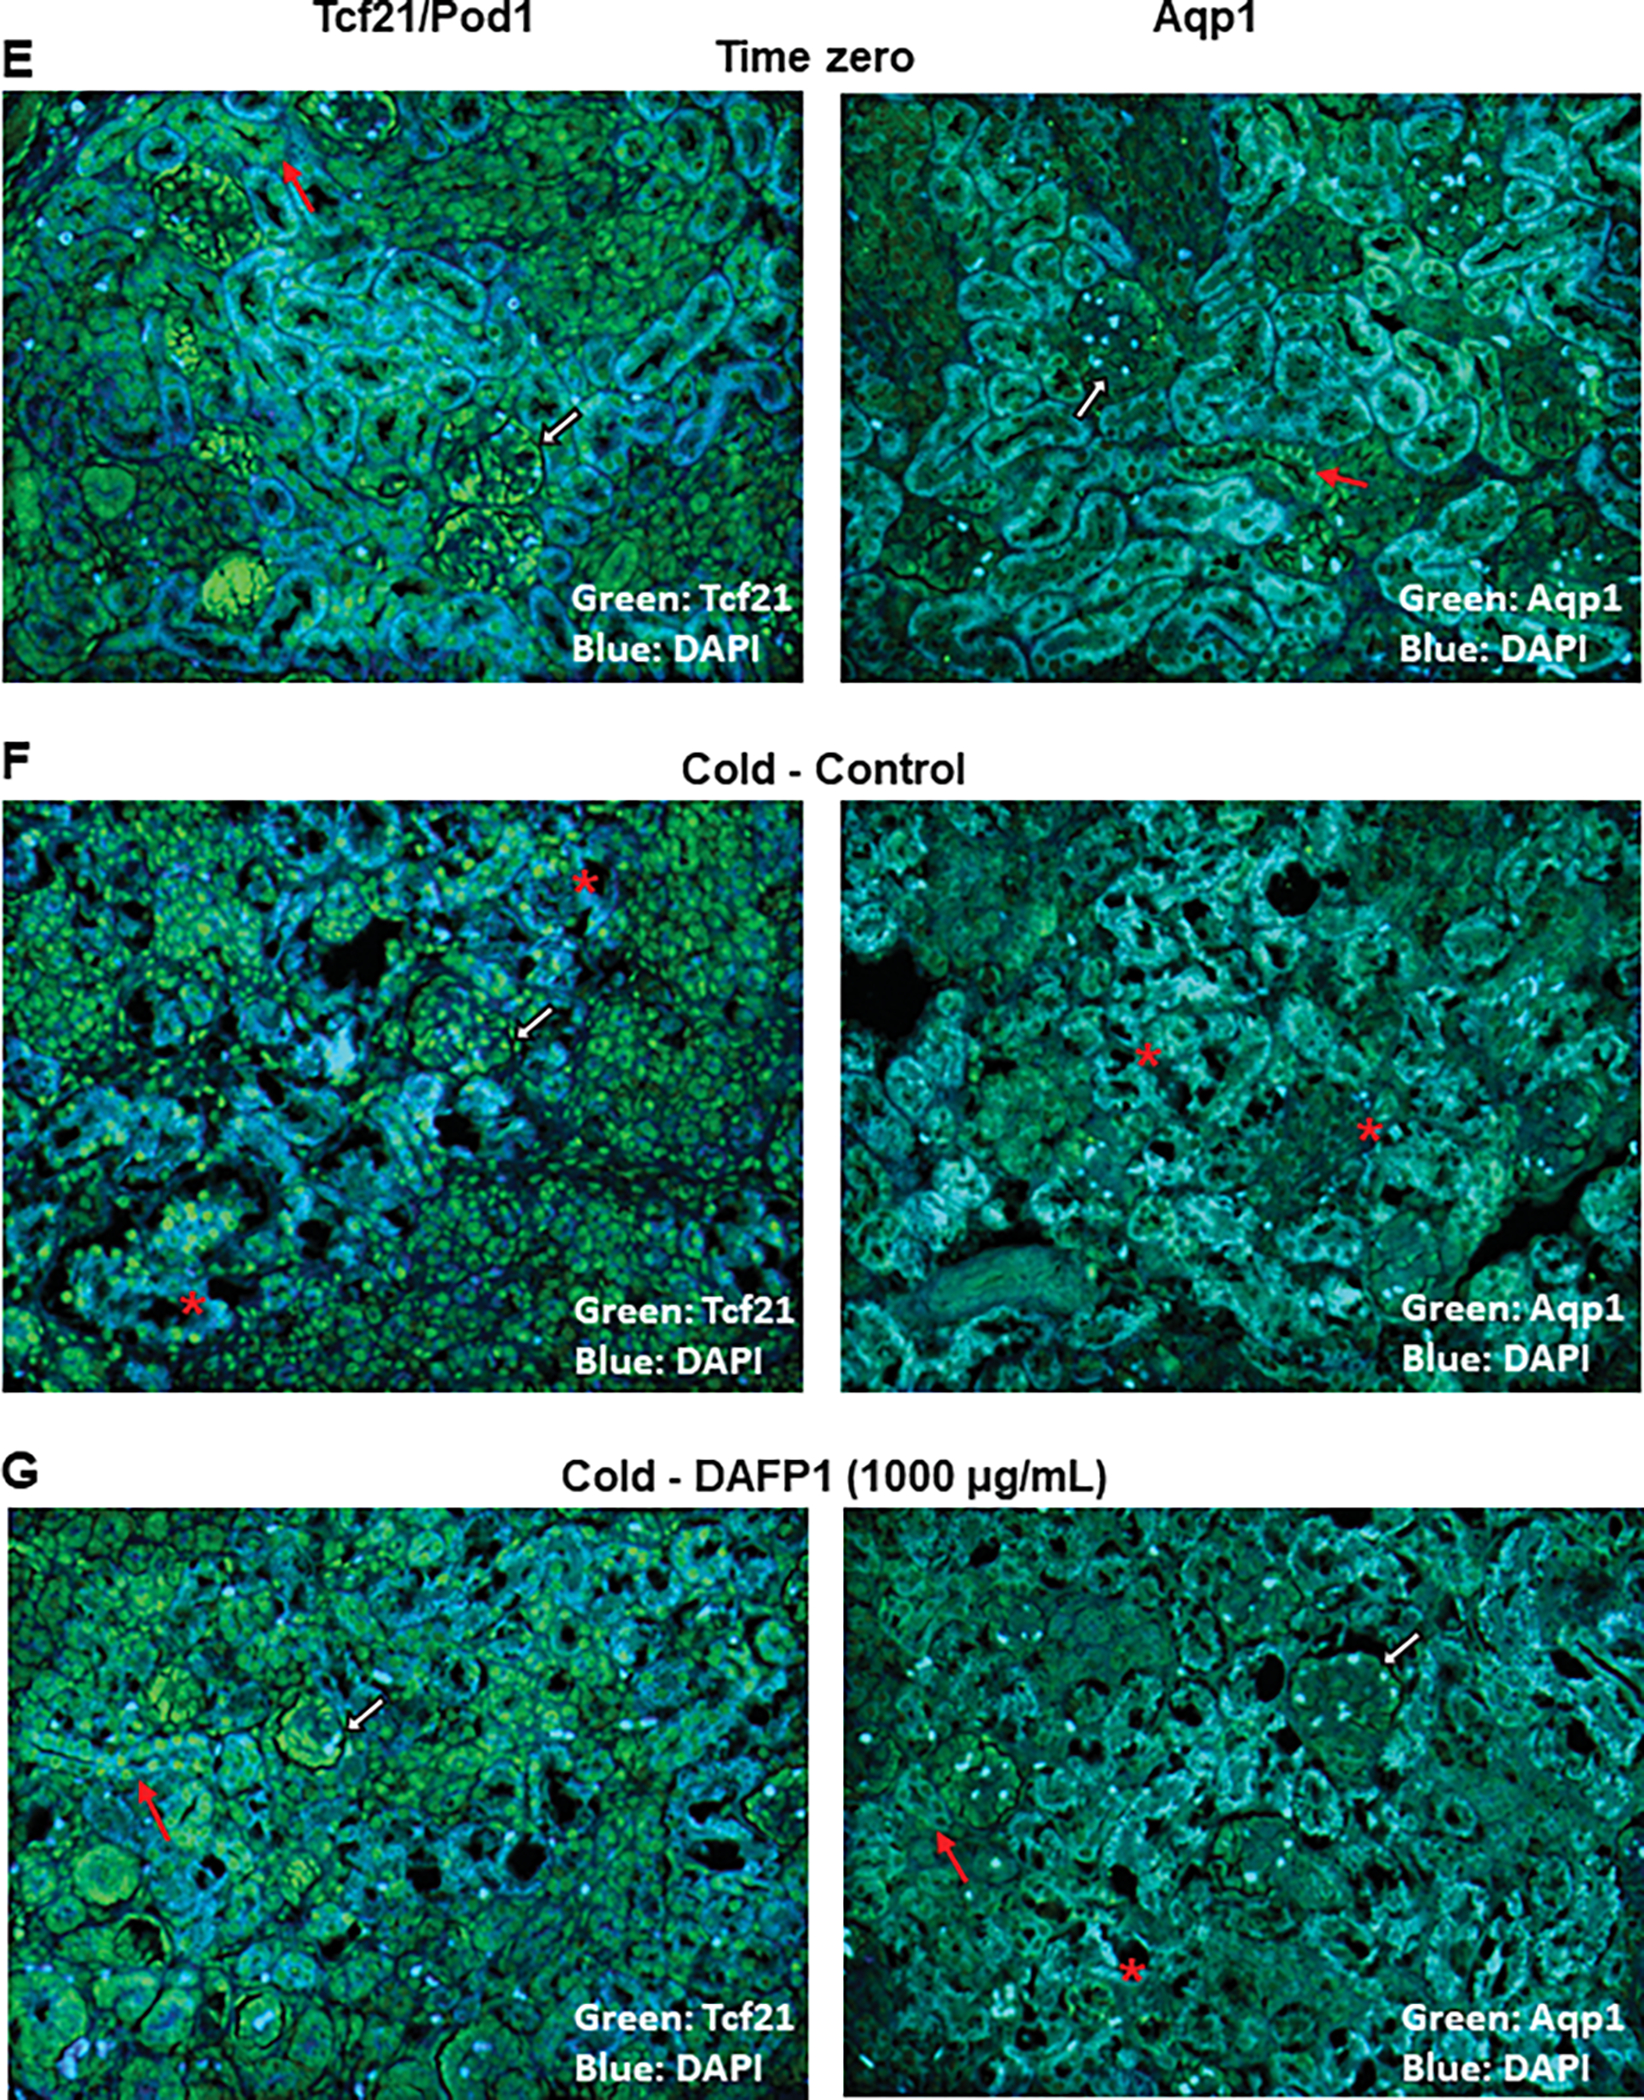
Antifreeze proteins (AFPs), found in many cold-adapted organisms, can protect them from cold and freezing damages and have thus been considered as additional protectants in current cold tissue preservation solutions that generally include electrolytes, osmotic agents, colloids and antioxidants, to reduce the loss of tissue viability associated with cold-preservation. Due to the lack of toxicity profile studies on AFPs, their inclusion in cold preservation solutions has been a trial-and-error process limiting the development of AFPs' application in cold preservation. To assess the feasibility of translating the technology of AFPs for mammalian cell cold or cryopreservation, we determined the toxicity profile of two highly active beetle AFPs, DAFP1 and TmAFP, from Dendroides canadensis and Tenebrio molitor in this study. Toxicity was examined on a panel of representative mammalian cell lines including testicular spermatogonial stem cells and Leydig cells, macrophages, and hepatocytes. Treatments with DAFP1 and TmAFP at up to 500 μg/mL for 48 and 72 h were safe in three of the cell lines, except for a 20% decrease in spermatogonia treated with TmAFP. However, both AFPs at 500 μg/mL or below reduced hepatocyte viability by 20-40% at 48 and 72 h. At 1000 μg/mL, DAFP1 and TmAFP reduced viability in most cell lines. While spermatogonia and Leydig cell functions were not affected by 1000 μg/mL DAFP1, this treatment induced inflammatory responses in macrophages. Adding 1000 μg/mL DAFP1 to rat kidneys stored at 4 °C for 48 h protected the tissues from cold-related damage, based on tissue morphology and gene and protein expression of two markers of kidney function. However, DAFP1 and TmAFP did not prevent the adverse effects of cold on kidneys over 72 h. Overall, DAFP1 is less toxic at high dose than TmAFP, and has potential for use in tissue preservation at doses up to 500 μg/mL. However, careful consideration must be taken due to the proinflammatory potential of DAFP1 on macrophages at higher doses and the heighten susceptibility of hepatocytes to both AFPs.
Keywords: Antifreeze proteins; Cell lines; Cold protection; DAFP1; Kidney; Toxicity.
Copyright © 2022 Elsevier B.V. All rights reserved.
Figures
Similar articles
-
Submilligram Level of Beetle Antifreeze Proteins Minimize Cold-Induced Cell Swelling and Promote Cell Survival.Biomolecules. 2022 Oct 28;12(11):1584. doi: 10.3390/biom12111584. Biomolecules. 2022. PMID: 36358934 Free PMC article.
-
HEAT INDUCIBLE EXPRESSION OF ANTIFREEZE PROTEIN GENES FROM THE BEETLES Tenebrio molitor AND Microdera punctipennis.Cryo Letters. 2016 Jan-Feb;37(1):10-8. Cryo Letters. 2016. PMID: 26964020
-
Recombinant Dendroides canadensis antifreeze proteins as potential ingredients in cryopreservation solutions.Cryobiology. 2014 Jun;68(3):411-8. doi: 10.1016/j.cryobiol.2014.03.006. Epub 2014 Mar 21. Cryobiology. 2014. PMID: 24662031 Free PMC article.
-
Antifreeze and ice nucleator proteins in terrestrial arthropods.Annu Rev Physiol. 2001;63:327-57. doi: 10.1146/annurev.physiol.63.1.327. Annu Rev Physiol. 2001. PMID: 11181959 Review.
-
Marine Antifreeze Proteins: Structure, Function, and Application to Cryopreservation as a Potential Cryoprotectant.Mar Drugs. 2017 Jan 27;15(2):27. doi: 10.3390/md15020027. Mar Drugs. 2017. PMID: 28134801 Free PMC article. Review.
Cited by
-
Submilligram Level of Beetle Antifreeze Proteins Minimize Cold-Induced Cell Swelling and Promote Cell Survival.Biomolecules. 2022 Oct 28;12(11):1584. doi: 10.3390/biom12111584. Biomolecules. 2022. PMID: 36358934 Free PMC article.
-
BERT-DomainAFP: Antifreeze protein recognition and classification model based on BERT and structural domain annotation.iScience. 2025 Mar 6;28(4):112077. doi: 10.1016/j.isci.2025.112077. eCollection 2025 Apr 18. iScience. 2025. PMID: 40241758 Free PMC article.
-
Effect of antifreeze proteins on the freeze-thaw cycle of foods: fundamentals, mechanisms of action, current challenges and recommendations for future work.Heliyon. 2022 Oct 7;8(10):e10973. doi: 10.1016/j.heliyon.2022.e10973. eCollection 2022 Oct. Heliyon. 2022. PMID: 36262292 Free PMC article. Review.
-
Preparation of Peptoid Antifreeze Agents and Their Structure-Property Relationship.Polymers (Basel). 2024 Apr 4;16(7):990. doi: 10.3390/polym16070990. Polymers (Basel). 2024. PMID: 38611248 Free PMC article.
-
Antifreeze proteins produced by Antarctic yeast from the genus Glaciozyma as cryoprotectants in food storage.PLoS One. 2025 Mar 6;20(3):e0318459. doi: 10.1371/journal.pone.0318459. eCollection 2025. PLoS One. 2025. PMID: 40048460 Free PMC article.
References
-
- Boisvert A, Jones S, Issop L, Erythropel HC, Papadopoulos V, Culty M, 2016. In vitro functional screening as a means to identify new plasticizers devoid of reproductive toxicity. Environ Res 150, 496–512. - PubMed
-
- Crevel R, Fedyk J, Spurgeon M, 2002. Antifreeze proteins: characteristics, occurrence and human exposure. Food and Chemical Toxicology 40, 899–903. - PubMed
-
- Cui S, Schwartz L, Quaggin SE, 2003. Pod1 is required in stromal cells for glomerulogenesis. Dev Dyn 226, 512–522. - PubMed
-
- Culty M, 2013. Gonocytes, from the fifties to the present: is there a reason to change the name? Biology of reproduction 89, 46, 41–46. - PubMed
MeSH terms
Substances
Grants and funding
LinkOut - more resources
Full Text Sources
