. 2022 Jul;10(7):e004935.
doi: 10.1136/jitc-2022-004935.

Reshaping the tumor microenvironment with oncolytic viruses, positive regulation of the immune synapse, and blockade of the immunosuppressive oncometabolic circuitry

Affiliations

Reshaping the tumor microenvironment with oncolytic viruses, positive regulation of the immune synapse, and blockade of the immunosuppressive oncometabolic circuitry

Teresa T Nguyen et al. J Immunother Cancer. 2022 Jul.

Abstract

Background: Oncolytic viruses are considered part of immunotherapy and have shown promise in preclinical experiments and clinical trials. Results from these studies have suggested that tumor microenvironment remodeling is required to achieve an effective response in solid tumors. Here, we assess the extent to which targeting specific mechanisms underlying the immunosuppressive tumor microenvironment optimizes viroimmunotherapy.

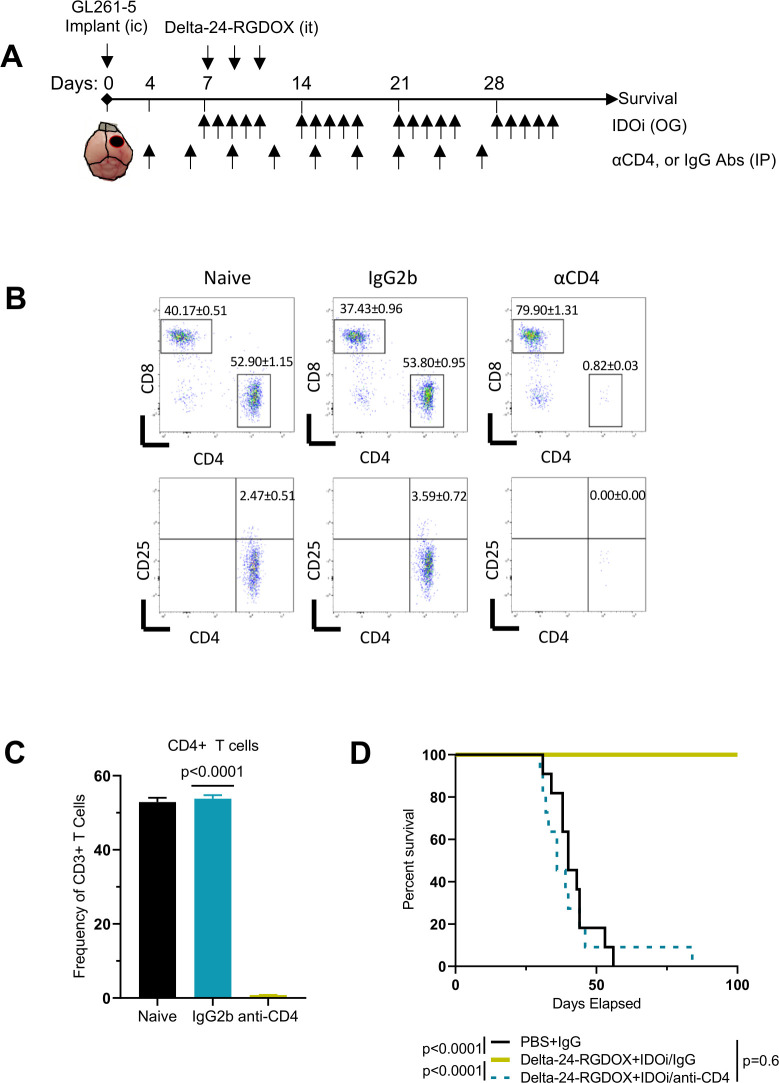
Methods: We used RNA-seq analyses to analyze the transcriptome, and validated the results using Q-PCR, flow cytometry, and immunofluorescence. Viral activity was analyzed by replication assays and viral titration. Kyn and Trp metabolite levels were quantified using liquid chromatography-mass spectrometry. Aryl hydrocarbon receptor (AhR) activation was analyzed by examination of promoter activity. Therapeutic efficacy was assessed by tumor histopathology and survival in syngeneic murine models of gliomas, including Indoleamine 2,3-dioxygenase (IDO)-/- mice. Flow cytometry was used for immunophenotyping and quantification of cell populations. Immune activation was examined in co-cultures of immune and cancer cells. T-cell depletion was used to identify the role played by specific cell populations. Rechallenge experiments were performed to identify the development of anti-tumor memory.

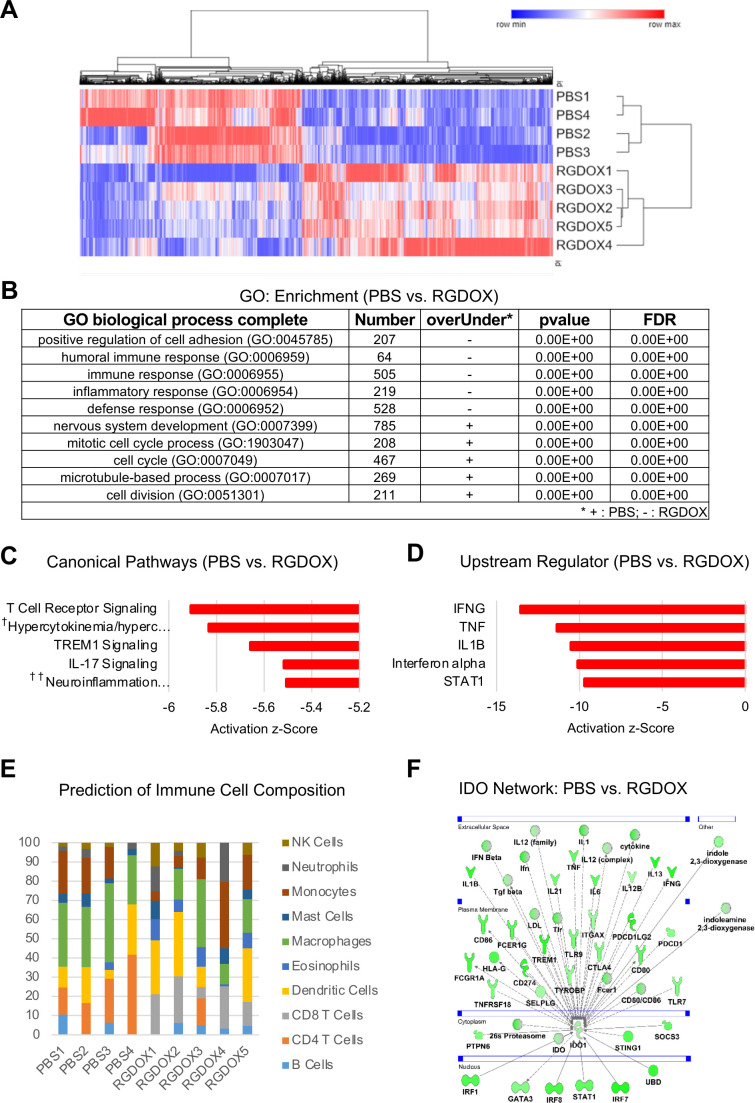
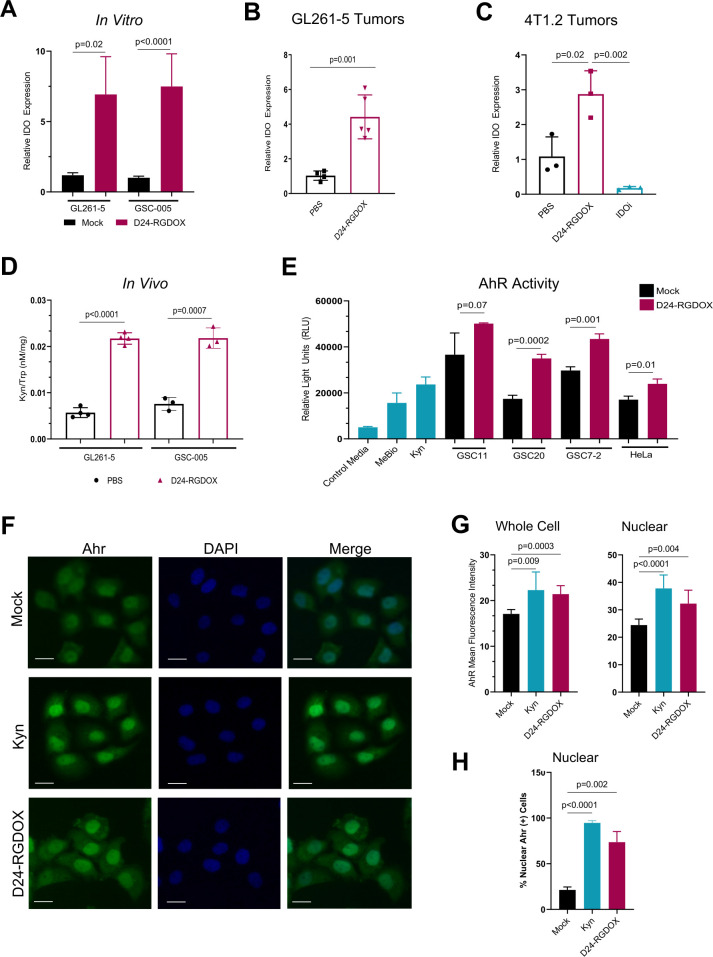
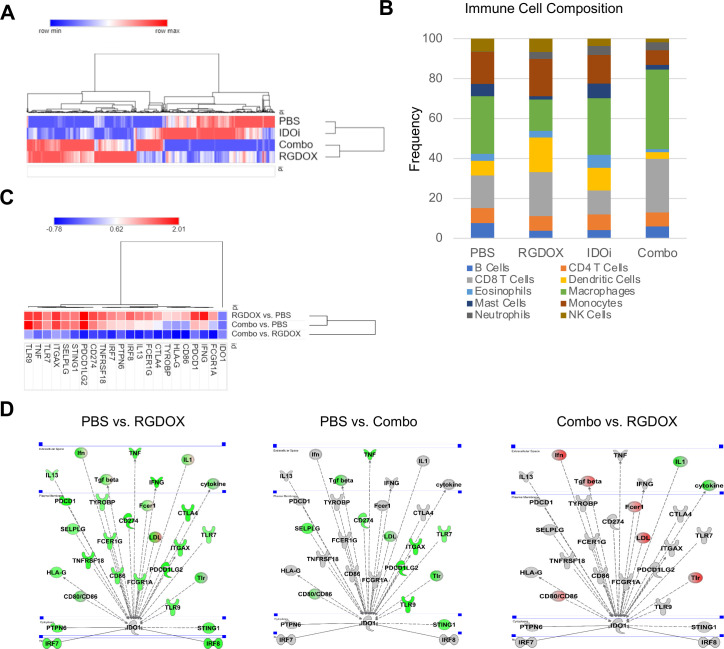
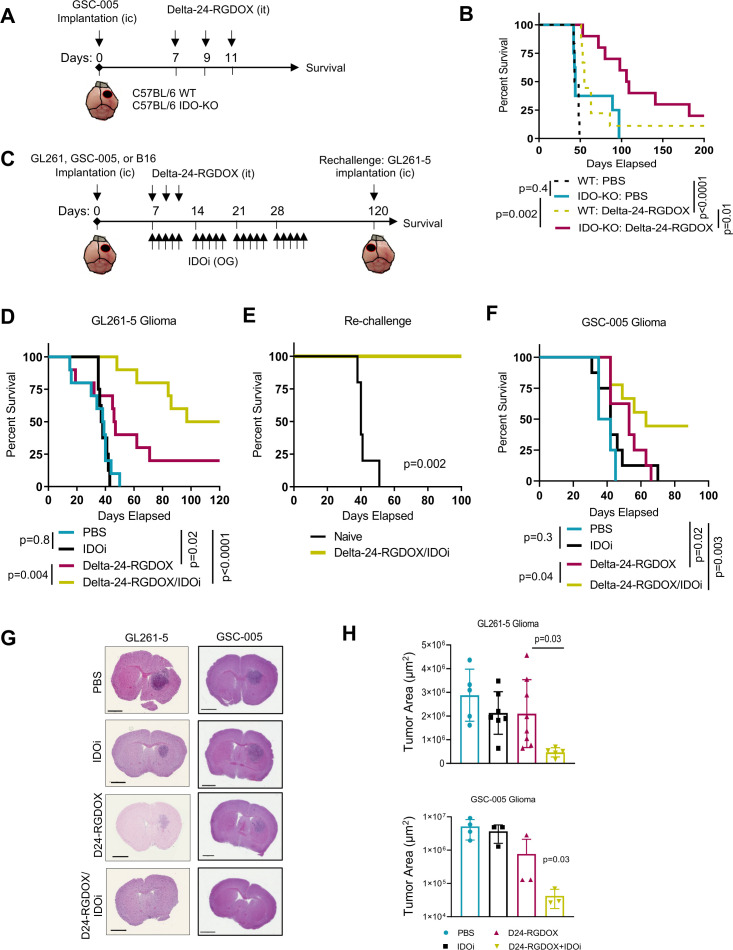
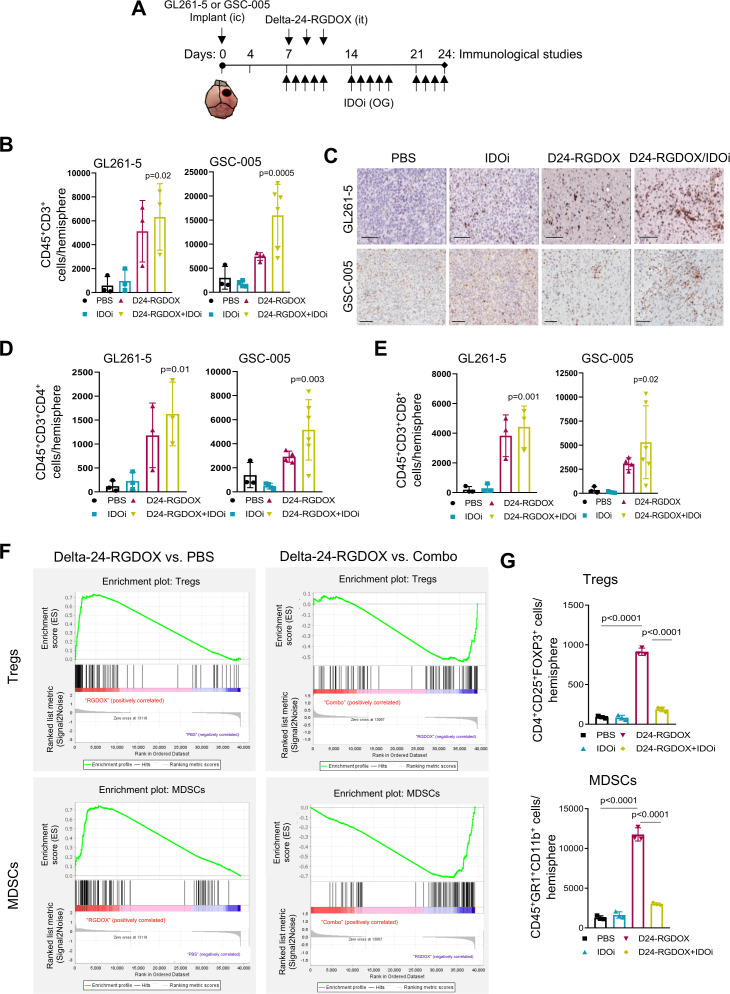
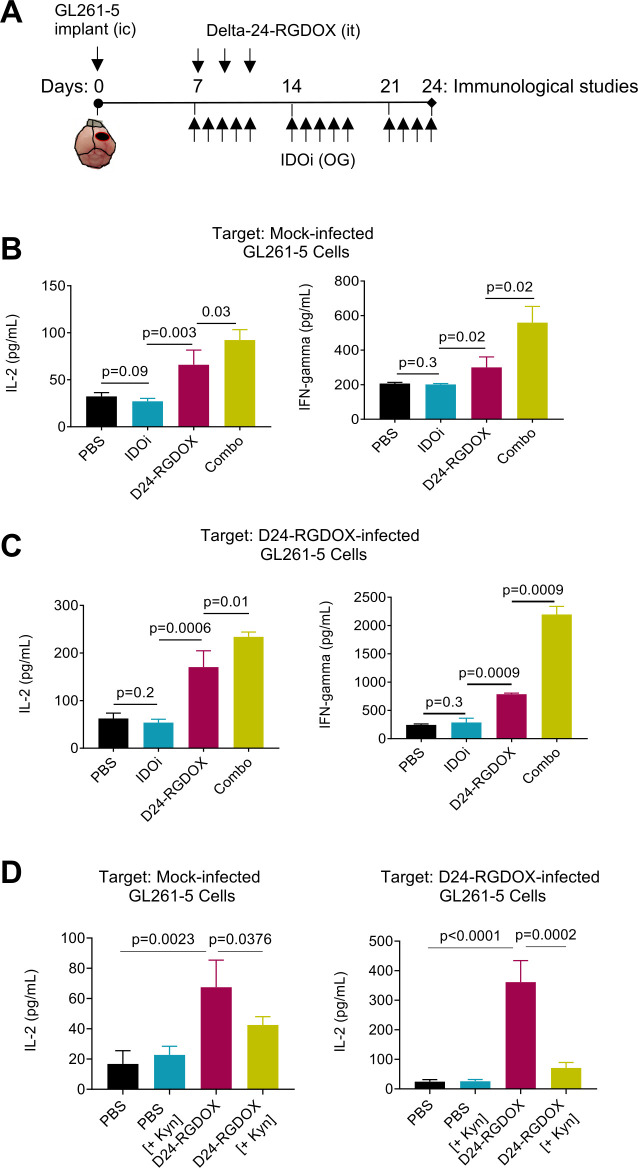
Results: Bulk RNA-seq analyses showed the activation of the immunosuppressive IDO-kynurenine-AhR circuitry in response to Delta-24-RGDOX infection of tumors. To overcome the effect of this pivotal pathway, we combined Delta-24-RGDOX with clinically relevant IDO inhibitors. The combination therapy increased the frequency of CD8+ T cells and decreased the rate of myeloid-derived suppressor cell and immunosupressive Treg tumor populations in animal models of solid tumors. Functional studies demonstrated that IDO-blockade-dependent activation of immune cells against tumor antigens could be reversed by the oncometabolite kynurenine. The concurrent targeting of the effectors and suppressors of the tumor immune landscape significantly prolonged the survival in animal models of orthotopic gliomas.

Conclusions: Our data identified for the first time the in vivo role of IDO-dependent immunosuppressive pathways in the resistance of solid tumors to oncolytic adenoviruses. Specifically, the IDO-Kyn-AhR activity was responsible for the resurface of local immunosuppression and resistance to therapy, which was ablated through IDO inhibition. Our data indicate that combined molecular and immune therapy may improve outcomes in human gliomas and other cancers treated with virotherapy.

Keywords: Brain Neoplasms; Immunomodulation; Oncolytic Virotherapy.


Conflict of interest statement

Competing interests: MA, HJ, FL, CG-M, and JF report license agreements with DNAtrix. CG-M and JF are shareholders of DNAtrix. MA reports DNAtrix-sponsored research not related to this work.

Figures

Figure 1
Figure 1
Delta-24-RGDOX treatment remodels the tumor microenvironment. Differentially expressed genes in tumors treated with PBS versus tumors treated with Delta-24-RGDOX were used for clustering, gene ontology (GO) biological process enrichment analysis, and pathway and network analyses. Analyses of tumors were performed on day 12, 5 days after the first dose of Delta-24-RGDOX. (A) Heatmap comparing the transcriptional signatures of intracranial GL261-5–derived tumors treated with PBS or Delta-24-RGDOX. The log2-normalized expression levels of genes with significant adjusted p values (<0.05) across samples are shown. The color scale is shown above the heatmap. (B) GO biological process enrichment results for tumors treated with PBS or Delta-24-RGDOX. The five most significant GO biological processes are shown. GO biological processes significantly associated with PBS-treated tumors are marked as ‘+’, whereas those significantly associated with Delta-24-RGDOX-treated tumors are marked as ‘–’. (C) The five most significantly altered canonical pathways in tumors treated with PBS vs Delta-24-RGDOX. Activation z-scores are plotted in the graph. †Hypercytokinemia/hyperchemokinemia in the pathogenesis of influenza; ††neuroinflammation signaling pathway. (D) The five most significantly altered upstream regulators in tumors treated with PBS versus Delta-24-RGDOX. Activation z-scores are plotted in the graph. The negative z-scores represent activation in Delta-24-RGDOX. (E) The prediction of the immune cell composition in GL261-5-derived brain tumors treated with PBS or Delta-24-RGDOX. The percentages of various immune cell populations in each sample are presented in the graph. The color code for the various immune cell types is shown to the right of the graph. (F) IDO1 network genes with significantly altered expression levels in tumors treated with PBS or Delta-24-RGDOX. The color intensity indicates the log2 fold-change (green=activation) levels for each gene in PBS-treated tumors vs Delta-24-RGDOX-treated tumors. IDO, indoleamine 2,3-dioxygenase.
Figure 2
Figure 2
Oncolytic adenoviruses induce the expression and activation of the IDO-Kyn-AhR cascade in vivo and in vitro. (A) IDO expression in GL261-5 and GSC-005 murine glioma cells in response to Delta-24-RGDOX infection. Cells were infected with Delta-24-RGDOX (100–150 multiplicities of infection (MOIs)) over 48 hours. RNA was extracted, and the relative levels of IDO were measured using qRT-PCR; GAPDH or β-Actin was used as a housekeeping gene control. The column graph shows 2(CtGAPDH or β-Actin-CtIDO) results normalized to the mock-infected control. (B, C) Relative IDO expression in GL261-5 or 4T1.2 tumors in response to oncolytic adenovirus treatment in vivo. In (B, D), the mice were implanted intracranially with GL261-5 or GSC-005 cells and intratumorally treated with PBS or Delta-24-RGDOX; brain tumors were collected and flash-frozen on day 12. In (C), the mice were implanted with 4T1.2 cells in the right mammary fat pad and treated with PBS, D24-RGDOX, or indoximod (IDOi); tumors were collected and flash-frozen on day 36. RNA was extracted and analyzed as described in (A). (D) The Kyn and Trp metabolite levels in murine gliomas following the indicated treatments (described in (B)) were quantified using liquid chromatography–mass spectrometry. Data are presented as the ratios±SDs of Kyn concentrations to Trp concentrations. (E) AhR activity in human GSC lines and HeLa cells in response to Delta-24-RGDOX infection. Cells were mock-infected or infected with Delta-24-RGDOX (50 MOI) over 48 hours, and the transcriptional activity of AhR in the cells was quantified by evaluating the supernatants. Controls included medium (negative), medium containing the AhR agonist MeBio (0.32 nM), and medium containing Kyn (25 µM). HeLa cells were used as a positive control. (F) AhR expression and nuclear translocation on Delta-24-RGDOX treatment. HeLa cells were infected with Delta-24-RGDOX (25 MOI) over 48 hours or treated with Kyn (positive control) and then immunostained for AhR detection. Representative images of AhR-FITC staining, DAPI (nuclear) staining, and merged FITC/DAPI staining are shown. Scale bars, 50 µm. (G) Quantification of the mean fluorescence intensity of AhR in whole cells and nuclear compartments. (H) Frequency of nuclear AhR-positive cells after the indicated treatments, as analyzed using ImageJ software. Data are shown as the means±SDs. P values were generated by using a two-tailed Student’s t-test. AhR, aryl hydrocarbon receptor.
Figure 3
Figure 3
IDO inhibition modulates the tumor microenvironment of Delta-24-RGDOX-treated murine brain tumors. Differentially expressed genes in tumors treated with PBS, the IDO inhibitor (IDOi) indoximod, Delta-24-RGDOX (RGDOX), or the IDOi and Delta-24-RGDOX (combo) utilized for clustering, immune population prediction, and pathway and network analyses. Examination of tumors were performed on day 21, 14 days after the first dose of Delta-24-RGDOX. (A) Heatmap comparing the transcriptional signatures of intracranial GL261-5-derived tumors treated with PBS, the IDOi, Delta-24-RGDOX, or the combination therapy. Tumors were established in these mice for 21 days, and the mice underwent treatment for 14 days. The log2-normalized averaged expression levels of genes with significant adjusted p values (<0.05) across sample groups are shown. The color scale is shown above the heatmap. (B) The prediction of the immune cell composition in GL261-5-derived brain tumors in the indicated treatment group. The percentages of various immune cell populations in each sample are presented in the graph. The color code for the various immune cell types is shown at the bottom of the graph. (C) Heatmap or (D) pathway representation of IDO1 network genes with significantly altered expression levels in tumors; treatment group comparisons are indicated, in the experiment delineated in (A). The color scale is shown above the heatmap. The color intensity of the pathway representation graphics indicates the log2 fold-change levels for each gene in the specified treatment group comparison; gray represents unchanged, green represents activation, and red represents inhibition. IDO, indoleamine 2,3-dioxygenase.
Figure 4
Figure 4
Combined treatment with Delta-24-RGDOX infection and IDO inhibition results in an enhanced therapeutic effect and tumor regression. (A) Treatment schedule of wild-type (WT) and IDO-KO C57BL/6 mice bearing intracranial (IC) GSC-005 tumors. GSC-005 cells were implanted IC on day 0, and the mice were randomly assigned to receive intratumoral (IT) injection of either Delta-24-RGDOX or vehicle. Survival was monitored for up to 200 days. (B) Kaplan-Meier survival curves of the mice included in the experiment depicted in (A). (C) Treatment schedule of C57BL/6 mice-bearing intracranial tumors that were treated with Delta-24-RGDOX alone or in combination with an IDO inhibitor (IDOi). OG, oral gavage. (D) Kaplan-Meier survival curves of intracranial GL261-5 tumor-bearing C57BL/6 mice treated with vehicle or with Delta-24-RGDOX alone, or in combination with the IDOi 1-methyl-DL-tryptophan (1MT; n=10/group). (E) Long-term survivors previously treated with the combination therapy described in (D) were rechallenged with an intracranial injection of GL216-5 cells into the contralateral hemisphere, and their survival was compared with that of control treatment-naïve mice (n=5/group). (F) Kaplan-Meier survival curves of intracranial GSC-005 tumor–bearing C57BL/6 mice treated with vehicle or with Delta-24-RGDOX alone or in combination with the IDOi BGB-7204 (n=9–10/group). (G, H) The brains of intracranial GL261-5 or GSC-005 tumor-bearing C57BL/6 mice were subjected to histopathological analyses on day 15 (GL261-5) or 24 (GSC-005) after treatment with PBS, Delta-24-RGDOX, indoximod, or the combination therapy (n=5–8/group). Representative images of H&E staining (G) and the average tumor surface areas (H) were acquired using Aperio ImageScope software. Scale bar, 2 mm. P values were derived with the log-rank test (B, D–F) and a two-tailed Student’s t-test (G–I). The difference between the arms Delta-24-RGDOX and Delta-24-RGDOX+IDOi was calculated using the restricted mean survival Qme (RMST) to account for the long-term survivors. IDO, indoleamine 2,3-dioxygenase.
Figure 5
Figure 5
Combined Delta-24-RGDOX and IDO inhibitor treatment increases intratumoral T cells and decreases immunosuppressive cell populations. (A) Treatment timeline for the analysis of immune cell populations. C57BL/6 mice were intracranially (IC) implanted with GL261-5 or GSC-005 cells and randomly assigned to receive PBS (control), an IDO inhibitor (IDOi; GL261-5: indoximod. GSC-005: BGB-7204), Delta-24-RGDOX, or Delta-24-RGDOX plus IDOi. On day 24, brains were collected, stained as indicated, and analyzed using flow cytometry. Parallel experiments were performed for immunohistochemical analyses of the brains. it, intratumorally; OG, oral gavage. (B) Column graphs show the absolute numbers of CD45+CD3+ cells per tumor-containing brain hemisphere in the indicated murine glioma model. (C) Representative CD3 immunohistochemistry images for the indicated treatment groups. Images were acquired using Aperio ImageScope pathology slide viewing software. Scale bar, 100 µm. (D, E) Column graphs show the absolute numbers of CD4+ (D) and CD8+ (E) T cells per hemisphere in the indicated murine glioma models. (F) Enrichment plots for the Treg (top) and MDSC (bottom) gene sets in PBS-treated versus Delta-24-RGDOX-treated or Delta-24-RGDOX-treated versus Combo-treated GL261-5 brain tumor RNA. (G) Column graphs show the absolute numbers of CD4+CD25+FoxP3+ Tregs per hemisphere (top) and CD45+GR1+CD11b+ MDSCs per hemisphere (bottom). Data are shown as the means±SDs (n=3). P values were derived with an ordinary one-way ANOVA (B, D–E) or a two-tailed Student’s t-test (G). ANOVA, analysis of variance; IDO, indoleamine 2,3-dioxygenase; MDSC, myeloid-derived suppressor cell.
Figure 6
Figure 6
The therapeutic efficacy of combined Delta-24-RGDOX infection and IDO inhibition requires CD4+ T cell activity. (A) Treatment schedule for Delta-24-RGDOX given alone or in combination with an IDO inhibitor (IDOi) in the presence of anti-CD4 depleting antibodies. Mice were intracranially (IC) implanted with GL261-5 cells and randomly assigned to receive intratumoral (IT) injections of PBS or the combination of Delta-24-RGDOX and the IDOi indoximod (n=10 or 11 per group, respectively). An IgG control antibody and the anti-CD4 depleting antibodies were administered intraperitoneally. OG, oral gavage. (B) Flow cytometry plots showing CD4+ and CD8+ T cell populations in the spleen of treatment-naïve mice and mice treated with IgG2b or anti-CD4 at 38 days after tumor implantation. (C) Column graph shows the frequencies of CD4+ T cells in the indicated treatment groups. (D) Kaplan-Meier survival curves of GL261-5 tumor–bearing C57BL/6 mice in the different treatment groups. Data are shown as the means±SDs. P values were derived with a two-tailed Student’s t-test (C) or the log-rank test (D). IDO, indoleamine 2,3-dioxygenase.
Figure 7
Figure 7
Combined oncolytic virus and IDO inhibitor treatment enhances antitumor immune activation. (A) Treatment timeline for the functional splenocyte assays. C57BL/6 mice were intracranially (IC) implanted with GL261-5 cells and randomly assigned to receive PBS, the IDO inhibitor (IDOi) indoximod, Delta-24-RGDOX, or Delta-24-RGDOX plus indoximod. On day 24, splenocytes from the tumor-bearing mice were cocultured with the indicated prefixed target cells for 48 hours, and the concentrations of secreted IFNγ or IL-2 were assessed by ELISA. it, intratumoral; OG, oral gavage. (B, C) Column graphs show the levels of secreted IL-2 (top) or IFNγ (bottom) in cocultures containing splenocytes from mice in the indicated treatment groups and mock-infected GL261-5 cells (B), GL261-5 cells infected with Delta-24-RGDOX (C). (D) Levels of IL-2 in co-cultures containing splenocytes from mice in the indicated groups and t mock or Delta-24-RGDOX-infected GL261-5, and the media was supplemented with kynurenine (Kyn, 25 µM). Data are shown as the means±SDs (n=3). Indicated p values were evaluated using a two-tailed Student’s t-test. IDO, indoleamine 2,3-dioxygenase.

Similar articles

Cited by

References

    1. Challenor S, Tucker D. SARS-CoV-2-induced remission of Hodgkin lymphoma. Br J Haematol 2021;192:415. 10.1111/bjh.17116 - DOI - PubMed
    1. Sollini M, Gelardi F, Carlo-Stella C. Complete remission of follicular lymphoma after SARS-CoV-2 infection: from the "flare phenomenon" to the "abscopal effect. Eur J Nucl Med Mol Imaging 2021. - PMC - PubMed
    1. Lang FF, Conrad C, Gomez-Manzano C, et al. . Phase I study of DNX-2401 (Delta-24-RGD) oncolytic adenovirus: replication and immunotherapeutic effects in recurrent malignant glioma. J Clin Oncol 2018;36:JCO2017758219. 10.1200/JCO.2017.75.8219 - DOI - PMC - PubMed
    1. Jiang H, Fueyo J. Healing after death: antitumor immunity induced by oncolytic adenoviral therapy. Oncoimmunology 2014;3:e947872. 10.4161/21624011.2014.947872 - DOI - PMC - PubMed
    1. Jiang H, Gomez-Manzano C, Rivera-Molina Y, et al. . Oncolytic adenovirus research evolution: from cell-cycle checkpoints to immune checkpoints. Curr Opin Virol 2015;13:33–9. 10.1016/j.coviro.2015.03.009 - DOI - PMC - PubMed

Publication types

Substances