

Vitamin A supplementation among 9-59 month old children in India: geospatial perspectives and implications for targeted coverage
- PMID: 35902202
- PMCID: PMC9137340
- DOI: 10.1136/bmjgh-2021-007972
Vitamin A supplementation among 9-59 month old children in India: geospatial perspectives and implications for targeted coverage
Abstract
Introduction: Vitamin A supplementation (VAS) is yet to reach all Indian children aged 9-59 months, despite guidelines for universal coverage. This study mapped geospatial patterns underlying VAS coverage across two policy-relevant administrative unit levels (states and districts) in India. The relationship between spatial distribution of VAS coverage and vitamin A deficiency (VAD) prevalence was also investigated.
Methods: The study draws on nationally representative cross-sectional data collected during National Family and Health Survey 4 (NFHS-4) and Comprehensive National Nutritional Survey (CNNS). VAS coverage was estimated using information obtained during NFHS-4 from mothers about whether their children (n=204 645) had received VAS within 6 months of the survey. VAD prevalence estimates were based on serum retinol measurements during CNNS in under-five children (n=9563). State-level and district-level choropleth maps of VAS coverage were constructed. Spatial patterns were probed using Moran's statistics, scatter plots and local indicators of spatial association (LISA). Relationship between VAS coverage (as an explanatory variable) and VAD prevalence was explored using spatial autoregressive models.
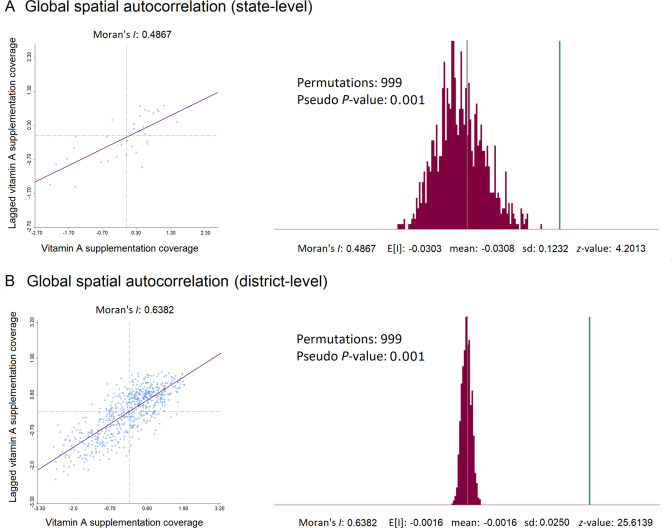
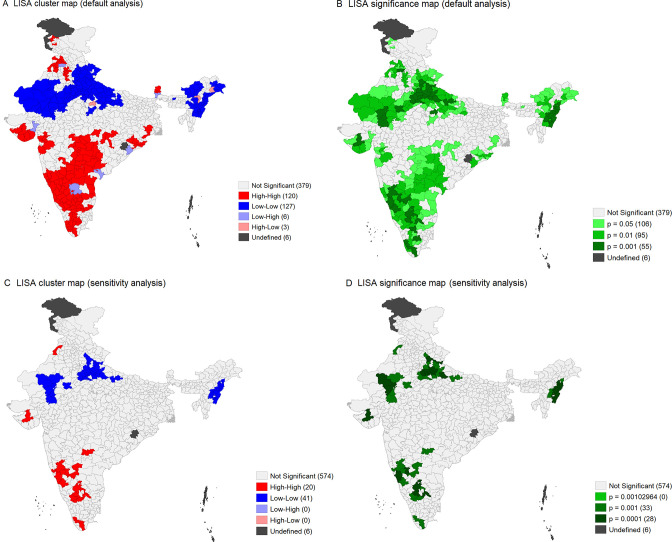
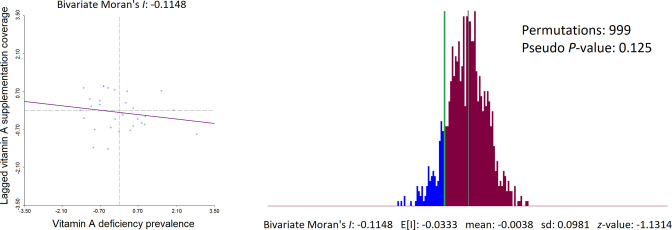
Results: VAS coverage in India (overall 60.5%) ranged from 29.5% (Nagaland) to 89.5% (Goa) across the various states/union territories. Among districts, it ranged from 12.8% (Longleng district, Nagaland) to 94.5% (Kolar district, Karnataka). The coverage exhibited positive spatial autocorrelation, more prominently at the district-level (univariate Moran's I=0.638, z-value=25.614, pseudo p value=0.001). LISA maps identified spatial clusters of high coverage and low coverage districts. No significant spatial association was observed between VAS coverage and VAD prevalence in the states during spatial error (R2=0.07, λ=0.30, p value=0.14) and spatial lag (R2=0.05, ρ=0.25, p value=0.23) regression.
Conclusion: Two out of every five eligible Indian children were not supplemented with vitamin A. The coverage was geographically heterogeneous with discernible spatial patterns. Their consequences on vitamin A status and associated health effects in the community deserve close monitoring.
Keywords: child health; epidemiology; nutrition; public health.
© Author(s) (or their employer(s)) 2022. Re-use permitted under CC BY-NC. No commercial re-use. See rights and permissions. Published by BMJ.
Conflict of interest statement
Competing interests: None declared.
Figures

References
MeSH terms
Substances
LinkOut - more resources
Full Text Sources
Medical