

Cross-sectional Study of Workers Employed at a Copper Smelter-Effects of Long-term Exposures to Copper on Lung Function and Chronic Inflammation
- PMID: 35902212
- PMCID: PMC9426729
- DOI: 10.1097/JOM.0000000000002610
Cross-sectional Study of Workers Employed at a Copper Smelter-Effects of Long-term Exposures to Copper on Lung Function and Chronic Inflammation
Abstract
Objective: The aim of the study was to assess the effect of exposure to copper-containing dust on lung function and inflammatory endpoints among workers of a German copper plant, effects rarely studied before.
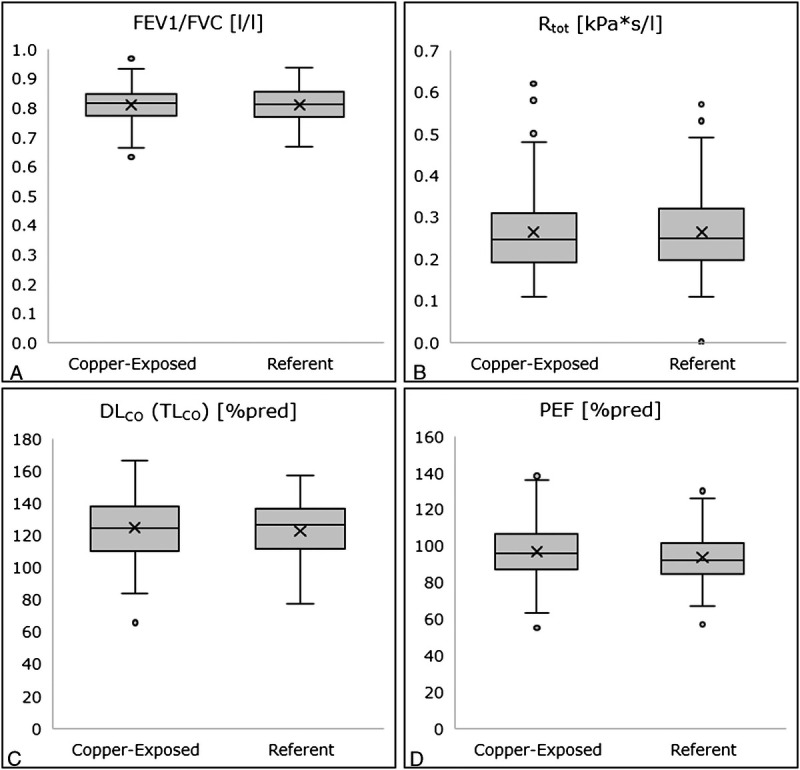
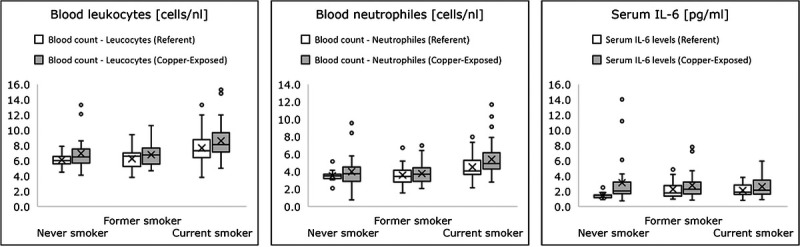
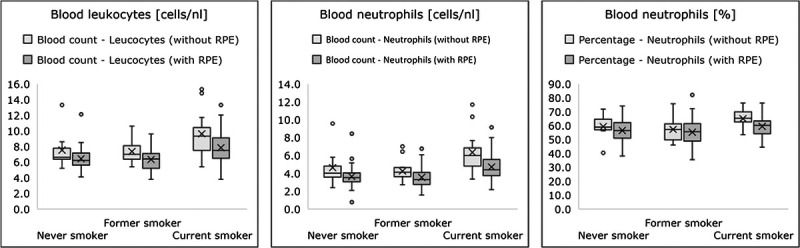
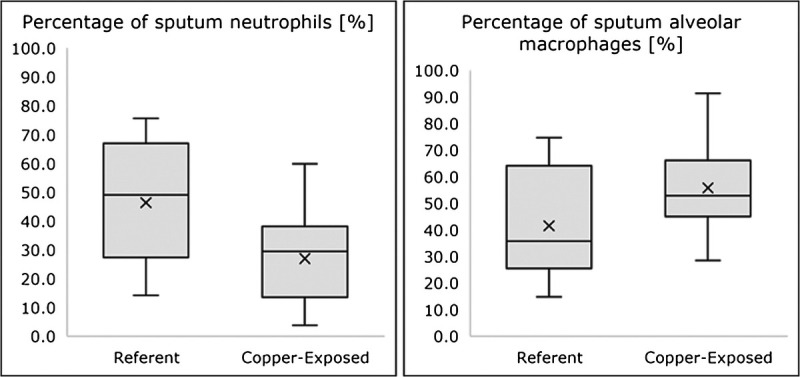
Methods: One hundred four copper-exposed smelter workers and 70 referent workers from the precious metal and lead facilities were included, with different metal exposures in both groups due to the different process materials. Body plethysmography, exhaled nitric oxide (FeNO) measurements, and blood sampling were conducted in all workers. Smoking status and the use of respiratory protective equipment were considered. In a subgroup of 40 nonsmoking volunteers (28 copper-exposed and 12 referents), sputum biomarkers were assessed.
Results: Median lung function values of both copper-exposed and the referent groups were within reference ranges of "healthy" individuals, and statistical differences between the groups were mostly not evident. Similarly, differences in blood and sputum biomarkers were too small to be biologically relevant.
Conclusion: The results suggest the absence of the detectable effects of copper-containing dust exposure on lung function or chronic inflammation within the investigated cohort.
Copyright © 2022 The Author(s). Published by Wolters Kluwer Health, Inc. on behalf of the American College of Occupational and Environmental Medicine.
Conflict of interest statement
Conflict of interest: The published work was part of a research project commissioned to the consultancy Ramboll by the International Copper Association (ICA). Dr Mundt supported Ramboll as independent consultant. The affiliated institutions of Dr Poland (University of Edinburgh), Dr Holz, and Dr Müller (Fraunhofer Institute for Toxicology and Experimental Medicine) received funding for their scientific input and contributions to the study from ICA as well.
Figures
Similar articles
-
A Health Surveillance Study of Workers Employed at a Copper Smelter-Effects of Long-Term Exposure to Copper on Lung Function Using Spirometric Data.J Occup Environ Med. 2021 Aug 1;63(8):e480-e489. doi: 10.1097/JOM.0000000000002252. J Occup Environ Med. 2021. PMID: 34074954
-
Effect of exposure to cement dust on Fractional Exhaled Nitric Oxide (FeNO) in non-smoking cement mill workers.Eur Rev Med Pharmacol Sci. 2014;18(10):1458-64. Eur Rev Med Pharmacol Sci. 2014. PMID: 24899603
-
Sputum neutrophils are elevated in smelter workers, and systemic neutrophils are associated with rapid decline in FEV1.Occup Environ Med. 2016 Jul;73(7):459-66. doi: 10.1136/oemed-2015-103083. Epub 2016 Apr 6. Occup Environ Med. 2016. PMID: 27052769
-
Oxidative Stress Biomarkers in Exhaled Breath of Workers Exposed to Crystalline Silica Dust by SPME-GC-MS.J Res Health Sci. 2016 Summer;16(3):153-161. J Res Health Sci. 2016. PMID: 27840344 Free PMC article.
-
Lung Function and Respiratory Morbidity Among Informal Workers Exposed to Cement Dust: A Comparative Cross-Sectional Study.Ann Glob Health. 2023 Jul 4;89(1):47. doi: 10.5334/aogh.4089. eCollection 2023. Ann Glob Health. 2023. PMID: 37425142 Free PMC article.
Cited by
-
Effect of Sodium Para-Aminosalicylic Acid on Cuproptosis in PC12 Cells Exposed Manganese, Iron, and Copper.Biol Trace Elem Res. 2025 Apr 8. doi: 10.1007/s12011-025-04613-1. Online ahead of print. Biol Trace Elem Res. 2025. PMID: 40199826
-
Perspective on health and ecological risk assessments of potentially toxic metal(loid)s using aquatic biodiversity as biomonitoring indicators.Toxicol Rep. 2025 Jul 15;15:102086. doi: 10.1016/j.toxrep.2025.102086. eCollection 2025 Dec. Toxicol Rep. 2025. PMID: 40703635 Free PMC article. Review.
-
Application of quantitative mineralogy to determine sources of airborne particles at a European copper smelter.Heliyon. 2023 Feb 21;9(3):e13803. doi: 10.1016/j.heliyon.2023.e13803. eCollection 2023 Mar. Heliyon. 2023. PMID: 36879976 Free PMC article.
References
-
- European Commission . Recommendation from the Scientific Committee on Occupational Exposure Limits for Copper and Its Inorganic Compounds (SCOEL/SUM/171). 2014;1–24. Available at: https://ec.europa.eu/social/BlobServlet?langId=en&docId=11815&. Accessed November 11, 2020.
-
- Services H . Toxicological profile for copper. ATSDR Toxicol Profiles. 2004.
-
- Forschungsgemeinschaft D. Copper and its inorganic compounds [MAK value documentation, 2014]. MAK Collection Occup Health Saf. 2015;1–18.
-
- Stern BR. Essentiality and toxicity in copper health risk assessment: overview, update and regulatory considerations. J Toxicol Environ Health A. 2010;73:114–127. - PubMed
-
- Gleason RP. Exposure to copper dust. Am Ind Hyg Assoc J. 1968;29:461–462. - PubMed
Publication types
MeSH terms
Substances
LinkOut - more resources
Full Text Sources
Medical
