. 2022 Jul 28;13(7):659.
doi: 10.1038/s41419-022-05109-9.

Palmitic acid control of ciliogenesis modulates insulin signaling in hypothalamic neurons through an autophagy-dependent mechanism

Affiliations

Palmitic acid control of ciliogenesis modulates insulin signaling in hypothalamic neurons through an autophagy-dependent mechanism

Yenniffer Ávalos et al. Cell Death Dis. .

Abstract

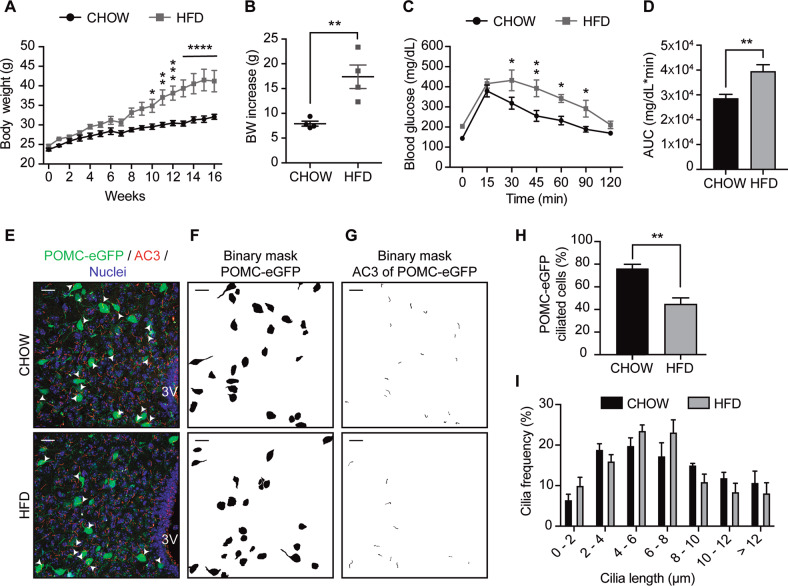
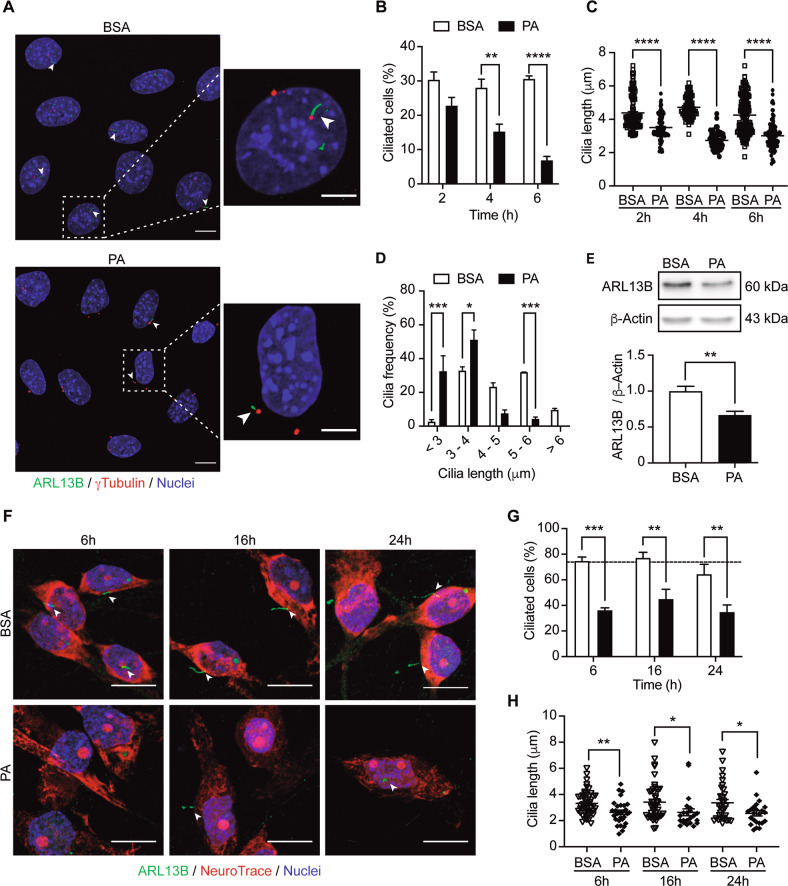
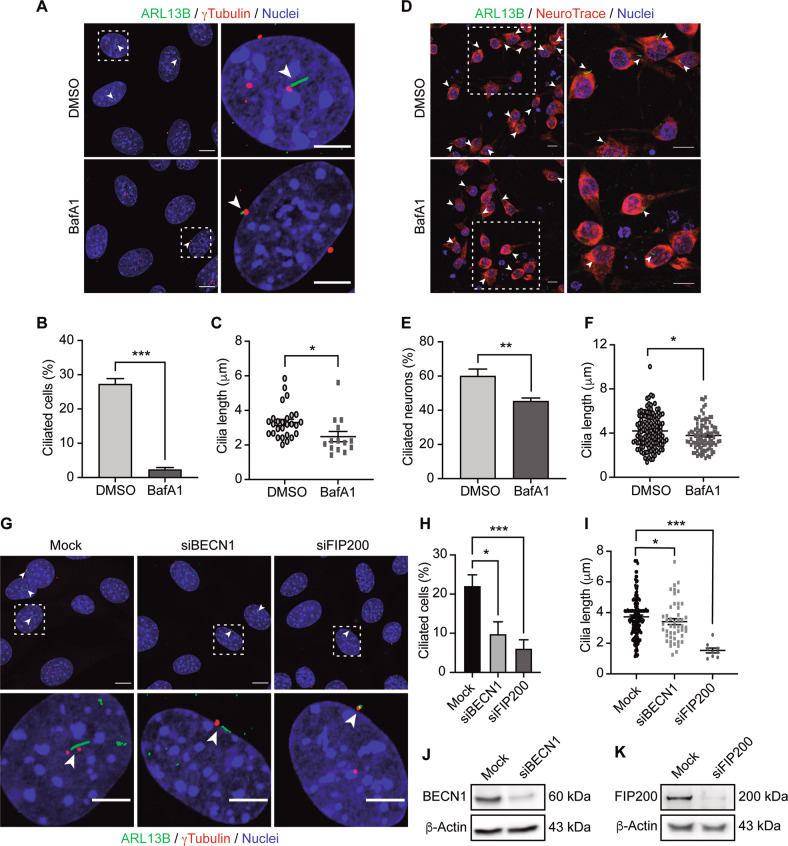
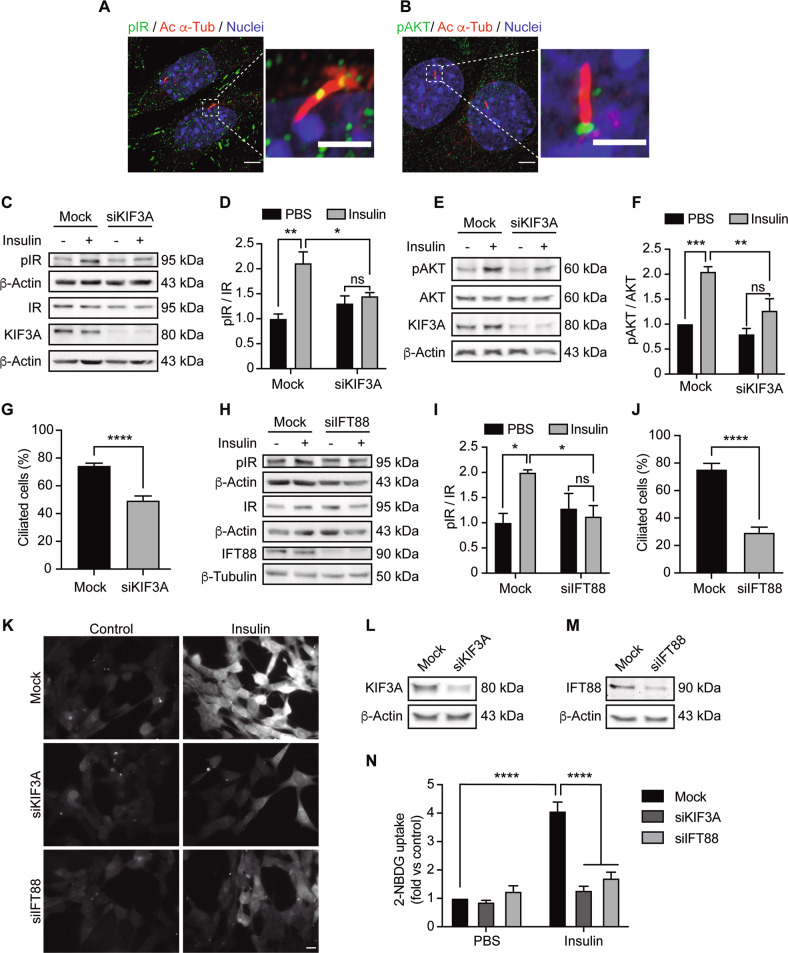
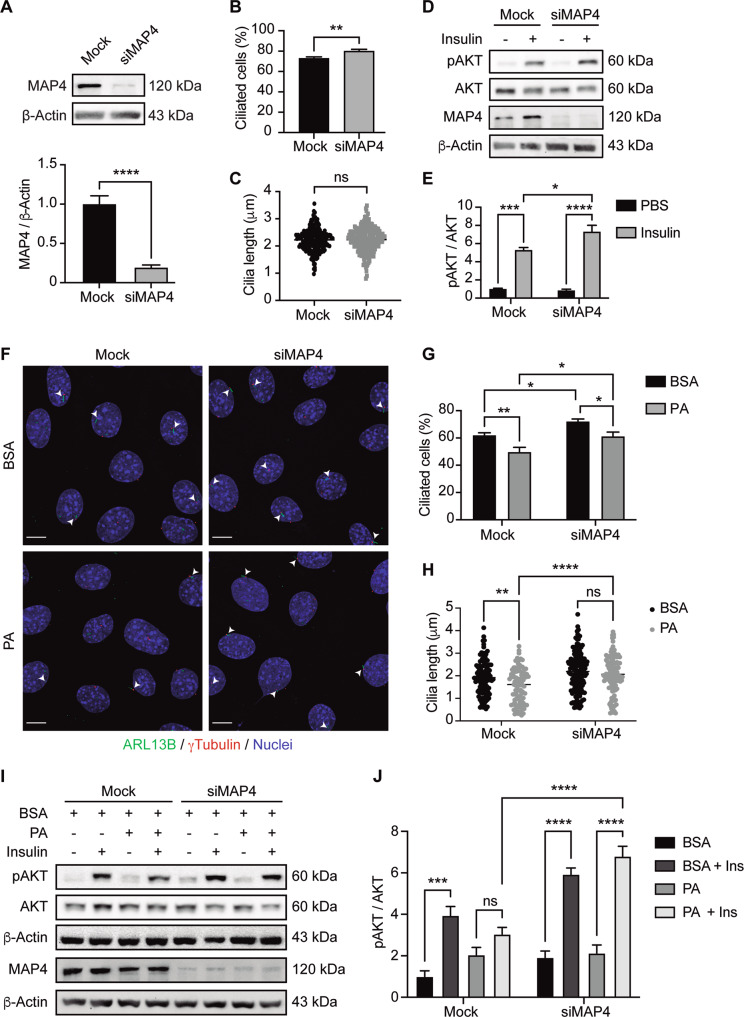
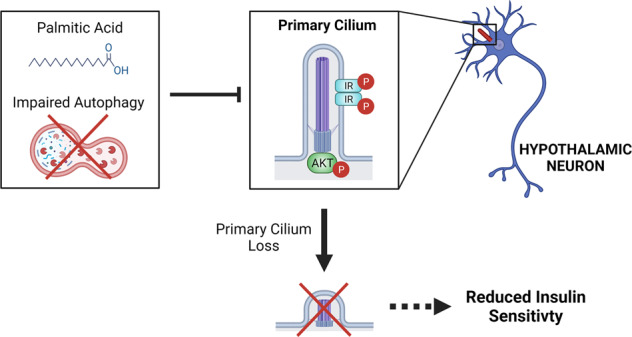
Palmitic acid (PA) is significantly increased in the hypothalamus of mice, when fed chronically with a high-fat diet (HFD). PA impairs insulin signaling in hypothalamic neurons, by a mechanism dependent on autophagy, a process of lysosomal-mediated degradation of cytoplasmic material. In addition, previous work shows a crosstalk between autophagy and the primary cilium (hereafter cilium), an antenna-like structure on the cell surface that acts as a signaling platform for the cell. Ciliopathies, human diseases characterized by cilia dysfunction, manifest, type 2 diabetes, among other features, suggesting a role of the cilium in insulin signaling. Cilium depletion in hypothalamic pro-opiomelanocortin (POMC) neurons triggers obesity and insulin resistance in mice, the same phenotype as mice deficient in autophagy in POMC neurons. Here we investigated the effect of chronic consumption of HFD on cilia; and our results indicate that chronic feeding with HFD reduces the percentage of cilia in hypothalamic POMC neurons. This effect may be due to an increased amount of PA, as treatment with this saturated fatty acid in vitro reduces the percentage of ciliated cells and cilia length in hypothalamic neurons. Importantly, the same effect of cilia depletion was obtained following chemical and genetic inhibition of autophagy, indicating autophagy is required for ciliogenesis. We further demonstrate a role for the cilium in insulin sensitivity, as cilium loss in hypothalamic neuronal cells disrupts insulin signaling and insulin-dependent glucose uptake, an effect that correlates with the ciliary localization of the insulin receptor (IR). Consistently, increased percentage of ciliated hypothalamic neuronal cells promotes insulin signaling, even when cells are exposed to PA. Altogether, our results indicate that, in hypothalamic neurons, impairment of autophagy, either by PA exposure, chemical or genetic manipulation, cause cilia loss that impairs insulin sensitivity.


Conflict of interest statement

The authors declare no competing interests.

Figures

Fig. 1
Fig. 1. Chronic HFD consumption decreases the percentage of ciliated cells in hypothalamic POMC neurons.
A Body weight of C57BL/6 transgenic mice expressing eGFP in POMC neurons (POMC-eGFP) on a chow or high-fat diet (HFD) for 16 weeks. B Body weight (BW) increase of POMC-eGFP mice fed chow or HFD after 16 weeks. C Glucose tolerance test (GTT) and D area under the curve (AUC) of GTT of POMC-eGFP mice fed chow or high-fat diet (HFD) for 16 weeks. E Representative confocal images showing POMC-eGFP neurons and AC3 (adenylate cyclase 3, cilia) immunoreactivity in the arcuate nucleus of the hypothalamus, with the respective binary masks (F, G) of mice fed chow or HFD for 16 weeks. Arrowheads indicate cilia of POMC-eGFP neurons. Scale bar: 20 µm. Nuclei were stained with Hoechst (blue). H Percentage of ciliated cells in POMC-eGFP neurons. I Cilia length distribution of POMC-eGFP neurons from mice fed chow or HFD for 16 weeks. Data are presented as mean ± SEM. Statistical differences were evaluated by using: A Two-way ANOVA followed by post hoc Sidak multiple comparison test; B, D, H unpaired two-tailed Student t-test; C two-way ANOVA, post hoc Holm-Sidak multiple comparison test. *p < 0.05, **p < 0.01, ***p < 0.001, ****p < 0.0001. n = 4/group.
Fig. 2
Fig. 2. Palmitic acid reduces the percentage of ciliated cells and primary cilium length in hypothalamic neurons.
A Representative confocal images of N43/5 hypothalamic neuronal cells treated with BSA (vehicle) or palmitic acid (PA, 100 μM) during 6 h, stained against ARL13B (ADP-ribosylation factor-like protein 13B, cilia axoneme) and γ-tubulin (cilia basal body). Scale bar: 10 µm. Inserts show a magnification of one cell within the dotted square. Insert scale bar: 5 µm. Arrowheads indicate the primary cilium. Quantification of B percentage of ciliated cells, C cilia length, and D cilia length distribution of N43/5 hypothalamic cells treated with BSA (vehicle) or palmitic acid (PA) during 2 h, 4 h, and 6 h and stained against ARL13B. E Representative western blot of ARL13B proteins levels in N43/5 cell lysates, incubated with BSA or PA (100 μM) for 6 h with the respective quantification. F Representative confocal images of primary hypothalamic neurons treated with BSA or PA (100 μM) for 6 h, 16 h, and 24 h, stained against ARL13B and with the neuronal marker NeuroTrace, with their respective quantifications (G, H). Arrowheads indicate the primary cilium. Scale bar: 10 µm. Nuclei were stained with Hoechst (blue). Data are presented as mean ± SEM. Statistical differences were evaluated by using: B, D, G Two-way ANOVA followed by post hoc Sidak multiple comparison test; C one-way ANOVA, post hoc Tukey multiple comparison test; E, H unpaired two-tailed Student t-test. *p < 0.05, **p < 0.01, ***p < 0.001, ****p < 0.0001. n = 3.
Fig. 3
Fig. 3. Autophagy impairment decreases ciliated cell percentage and primary cilium length in hypothalamic neurons.
A Representative confocal images of N43/5 hypothalamic neuronal cells treated with the autophagic flux inhibitor BafA1 (100 nM) or its vehicle (DMSO) for 6 h and then stained against ARL13B (ADP-ribosylation factor-like protein 13B, cilia axoneme) and γ-tubulin (cilia basal body). Arrowheads indicate the primary cilium. Scale bar: 10 µm. Inserts show a magnification of one cell within the dotted square. Insert scale bar: 5 µm. Quantification of B percentage of ciliated cells and C cilia length of N43/5 hypothalamic cells treated as indicated in A. D Representative confocal images of primary hypothalamic neurons treated with DMSO or BafA1 (100 nM) during 6 h, stained against ARL13B and with the neuronal marker NeuroTrace, with their respective quantifications (E, F). Inserts show a magnification of cells within the dotted square. Arrowheads indicate the primary cilium. Scale bars: 10 µm. G Representative confocal images of N43/5 hypothalamic neuronal cells transfected with siRNA against BECN1 and FIP200. Scale bar: 10 µm. Inserts show a magnification of one cell within the dotted square. Insert scale bar: 5 µm. Arrowheads indicate the primary cilium. Nuclei were stained with Hoechst (blue). Quantification of H percentage of ciliated cells and I cilia length of N43/5 hypothalamic cells treated as indicated in G. Representative western blot showing protein levels of N43/5 cells depleted of J BECN1 and K FIP200. Cells were incubated with Lipofectamine RNAiMAX reagent only (Mock) as control. Data are shown as mean ± SEM. Comparisons between two conditions were made using the unpaired two-tailed Student t-test. One-way ANOVA was used for comparison of more than 2 groups, followed by Tukey’s post hoc adjustment. *p < 0.05, **p < 0.01, ***p < 0.001. n = 3.
Fig. 4
Fig. 4. Primary cilium depletion reduced insulin signaling in hypothalamic cells.
Representative confocal images showing A phospho-IR (pIR) and B phospho-AKT (pAKT) with primary cilium (acetylated α-tubulin, Ac α-tub) double immunostaining in N43/5 hypothalamic neuronal cells. Scale bar: 10 µm. Inserts show a magnification of one cilium within the dotted square. Insert scale bar: 2 µm. Nuclei were stained with Hoechst (blue). Representative blots of N43/5 hypothalamic cells transfected with siRNA against KIF3A followed by insulin (1 nM) or PBS (control) treatment for 3 min to evaluate IR phosphorylation (C) or 12 min to evaluate AKT phosphorylation (E), with their respective quantifications (D, F). G Percentage of ciliated cells in N43/5 hypothalamic cells depleted of KIF3A. H Representative blot of N43/5 hypothalamic cells transfected with siRNA against IFT88 followed by insulin (1 nM) or PBS (control) treatment for 3 min to evaluate IR phosphorylation, with their respective quantifications (I). J Percentage of ciliated cells in N43/5 hypothalamic cells transfected with siRNA against IFT88. K Representative images of 2-NBDG uptake in N43/5 hypothalamic cells transfected with siRNA against KIF3A and IFT88 and then stimulated with insulin 1 nM for 30 min, with its quantification (N). Scale bar: 10 μm. Representative western blots showing protein levels of N43/5 hypothalamic cells depleted of L KIF3A or M IFT88. As control condition, cells were incubated with Lipofectamine RNAiMAX reagent only (Mock). Data are presented as mean ± SEM. Comparisons between two conditions were made using the unpaired two-tailed Student t-test. Two-way ANOVA was used for comparison of more than 2 groups, followed by Sidak’s post hoc adjustment. *p < 0.05, **p < 0.01, ***p < 0.001, ****p < 0.0001. ns, not significant. n = 3.
Fig. 5
Fig. 5. Increase in the percentage of ciliated cells promotes insulin signaling.
A Representative blots of N43/5 cells transfected with siRNA against MAP4 showing MAP4 protein level in control condition (Mock) and following siRNA-mediated downregulation (siMAP4), and the respective quantification. β-actin was used as loading control. B Percentage of ciliated cells in N43/5 hypothalamic cells depleted of MAP4. C Cilia length of N43/5 cells in mock conditions or following MAP4 siRNA mediated downregulation. D Representative blots of N43/5 hypothalamic cells transfected with siRNA against MAP4 followed by insulin (1 nM) or PBS (control) treatment for 12 min to evaluate AKT phosphorylation (D), with their respective quantifications (E). F Representative confocal images of N43/5 cells transfected with siRNA against MAP4 and then exposed to BSA (vehicle) or 100 µM palmitic acid (PA) for 2 h. After fixation, cells were stained against ARL13B (ADP-ribosylation factor-like protein 13B, cilia axoneme) and γ-tubulin (cilia basal body). Arrowheads indicate the primary cilium. Scale bar: 10 µm. Quantification of the percentage of ciliated cells (G) and cilia length (H) of N43/5 cells exposed to the treatments indicated in F. I Representative blots of N43/5 cells transfected with siRNA against MAP4 followed by BSA or PA (100 µM) treatment for 2 h and then stimulated with insulin (1 nM) during 12 min, to evaluate AKT phosphorylation, with the respective quantification (J). Data are presented as mean ± SEM. Comparisons between two conditions were made using the unpaired two-tailed Student t-test. Two-way ANOVA was used for comparison of more than 2 groups, followed by Sidak’s post hoc adjustment. *p < 0.05, **p < 0.01, ***p < 0.001, ****p < 0.0001. ns, not significant. n = 3.
Fig. 6
Fig. 6. Primary cilium loss induced by palmitic acid or autophagy impairment reduces insulin sensitivity.
Our results indicate that conditions which impair autophagy, such as PA exposure or chemical and genetic inhibition of autophagy, obtained by treatment with the autophagy inhibitor Bafilomycin A1 or Chloroquine or downregulation of essential autophagy genes, causes cilia loss in hypothalamic neuronal cells. We also show that proteins required for insulin signaling (IR and AKT) localize at the primary cilium, promoting insulin sensitivity. Consistently, conditions that cause cilia loss impair insulin signaling in hypothalamic neurons. p-IR: phosphorylated insulin receptor; p-AKT: phosphorylated protein kinase B (also known as AKT). Figure created with BioRender.com.

References

    1. Ng M, Fleming T, Robinson M, Thomson B, Graetz N, Margono C, et al. Global, regional, and national prevalence of overweight and obesity in children and adults during 1980–2013: a systematic analysis for the Global Burden of Disease Study 2013. Lancet. 2014;384:766–81. doi: 10.1016/S0140-6736(14)60460-8. - DOI - PMC - PubMed
    1. Arner P, Ryden M. Fatty acids, obesity and insulin resistance. Obes Facts. 2015;8:147–55. doi: 10.1159/000381224. - DOI - PMC - PubMed
    1. Frohnert BI, Jacobs DR, Jr., Steinberger J, Moran A, Steffen LM, Sinaiko AR. Relation between serum free fatty acids and adiposity, insulin resistance, and cardiovascular risk factors from adolescence to adulthood. Diabetes. 2013;62:3163–9. doi: 10.2337/db12-1122. - DOI - PMC - PubMed
    1. Chen W, Balland E, Cowley MA. Hypothalamic insulin resistance in obesity: effects on glucose homeostasis. Neuroendocrinology. 2017;104:364–81. doi: 10.1159/000455865. - DOI - PubMed
    1. Kleinridders A, Ferris HA, Cai W, Kahn CR. Insulin action in brain regulates systemic metabolism and brain function. Diabetes. 2014;63:2232–43. doi: 10.2337/db14-0568. - DOI - PMC - PubMed

Publication types