. 2022 Jul 28;9(1):451.
doi: 10.1038/s41597-022-01559-0.

The role of plant functional groups mediating climate impacts on carbon and biodiversity of alpine grasslands

Affiliations

The role of plant functional groups mediating climate impacts on carbon and biodiversity of alpine grasslands

Vigdis Vandvik et al. Sci Data. .

Abstract

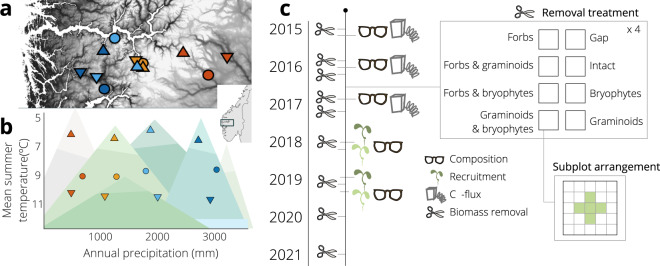
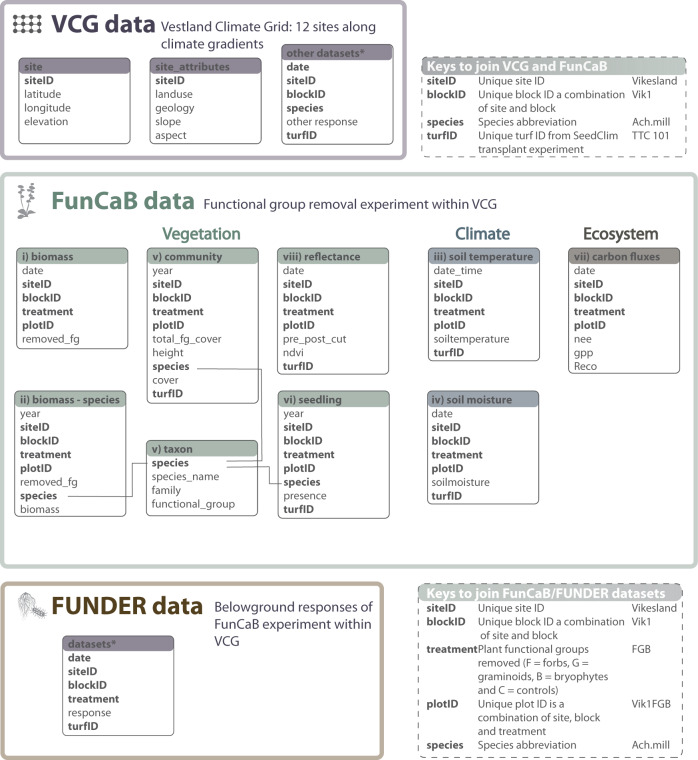
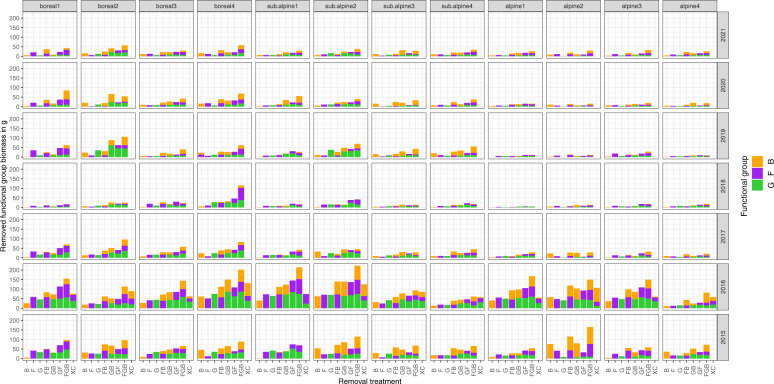
Plant removal experiments allow assessment of the role of biotic interactions among species or functional groups in community assembly and ecosystem functioning. When replicated along climate gradients, they can assess changes in interactions among species or functional groups with climate. Across twelve sites in the Vestland Climate Grid (VCG) spanning 4 °C in growing season temperature and 2000 mm in mean annual precipitation across boreal and alpine regions of Western Norway, we conducted a fully factorial plant functional group removal experiment (graminoids, forbs, bryophytes). Over six years, we recorded biomass removed, soil microclimate, plant community composition and structure, seedling recruitment, ecosystem carbon fluxes, and reflectance in 384 experimental and control plots. The dataset consists of 5,412 biomass records, 360 species-level biomass records, 1,084,970 soil temperature records, 4,771 soil moisture records, 17,181 plant records covering 206 taxa, 16,656 seedling records, 3,696 ecosystem carbon flux measurements, and 1,244 reflectance measurements. The data can be combined with longer-term climate data and plant population, community, ecosystem, and functional trait data collected within the VCG.


Conflict of interest statement

The authors declare no competing interests.

Figures

Fig. 1
Fig. 1
Study area, site selection, experimental design, and field sampling overview for the FunCaB plant functional group experiment. (a) Location of the study area and the 12 study sites in Vestland county, Western Norway. (b) The Vestland Climate Grid is established across independent broad-scale biogeographic gradients in summer temperature (mean of four warmest months, °C), and annual precipitation (mean annual precipitation, mm). Temperature levels are given as boreal, sub-alpine, and alpine; precipitation levels range from 1 (dry) to 4 (wet). (c) Experimental design, with the timeline (species composition recordings [dataset v], seedling recruitment monitoring [vi], ecosystem carbon flux monitoring [vii], and functional group removals [i] indicated, see legend for dataset symbols, for other datasets see text), an overview of the eight factorial removal treatments, and plot layout with subplots used for the community and seedling recording. The removal treatments are described by the functional groups removed from the respective plots, note that in the figure the ‘Intact’ plot refers to the no removal controls whereas the ‘Gap’ are plots with all functional groups removed. For detailed description of treatments and their abbreviations as used in the datasets, see text.
Fig. 2
Fig. 2
The data collection and management workflow of the FunCaB project. Reproducibility throughout the research process is assured as follows: Experimental design and data collection was based on best-practice community methods and protocols, adapted for the projects’ needs. Measurements were digitalized and the raw data stored in the project Open Science Foundation (OSF) repository before the raw data were cleaned and managed through code-based data curation, with version control secured via GitHub. The clean data are stored at the OSF repository, and a time-stamped version of the code to retrieve and clean data is provided through Zenodo. This data paper describes and documents the data collection and workflow, and describes how to access and use clean data, raw data, and code.
Fig. 3
Fig. 3
Data structure for the FunCaB functional group removal experiment and associated Vestland Climate Grid (VCG) and FUNDER project data. Within each of the three projects, boxes represent data tables. The FunCaB project data tables include biomass of functional groups removed and forb species-level biomass (datasets i, ii), soil temperature and moisture (datasets iii, iv) plant community composition and the associated taxon table (dataset v), seedling recruitment (dataset vi), ecosystem carbon fluxes (dataset vii) and reflectance (dataset viii). Names of individual data tables are given in the coloured title area, and a selection of the main variables available within tables in the internal lists. For full sets of variables for each FunCaB dataset, see Tables 3–9. The lines linking three of the boxes exemplify links using species as keys across tables, note that all bold variables are shared between several tables and can be used as keys to join them. Keys can also be used to link to/from data from other projects in the VCG (for general VCG project keys, see top right hatched outline box, for keys between the FunCaB and FUNDER projects see the bottom right hatched outline box (both including an example value for each variable on the right). The (other) datasets* boxes refer to extensive datasets on plant community composition, cover, biomass, fitness, and reproduction available from previous projects in the VCG and upcoming datasets in the FUNDER project.
Fig. 4
Fig. 4
Biomass over time in the FunCaB plant functional group removal experiment. Biomass removed per site, treatment, and plant functional group over time from 384 25 × 25 cm experimental plant functional group removal plots from 2015–2021, and total biomass from 48 extra controls in 2016, at twelve sites in the Vestland Climate Grid, Vestland County, Norway. Sites are coded by vegetation zone (boreal, sub-alpine, alpine) and precipitation level (low = 1 to high = 4). B = bryophytes, F = forbs, G = graminoids. Removal treatments are coded by the plant functional group removed (i.e., in the B treatments, F and G are not removed).
Fig. 5
Fig. 5
Functional group cover in response to removal treatments in the FunCaB plant functional group experiment. Difference from unmanipulated control plots (C treatment) over time in the sum of covers of graminoids, forbs, and bryophytes in plots where this functional group grows alone (i.e., the FB, GB, and GF removal treatments, respectively, see Table 6 for abbreviations). Data from 192 25 × 25 cm experimental plant functional group removal plots from 2015 – 2019 at twelve sites in the Vestland Climate Grid, Vestland County, Norway.

References

    1. Steinbauer MJ, et al. Accelerated increase in plant species richness on mountain summits is linked to warming. Nature. 2018;556:231–234. doi: 10.1038/s41586-018-0005-6. - DOI - PubMed
    1. Walther G-R, et al. Ecological responses to recent climate change. Nature. 2002;416:389–395. doi: 10.1038/416389a. - DOI - PubMed
    1. Elmendorf SC, et al. Experiment, monitoring, and gradient methods used to infer climate change effects on plant communities yield consistent patterns. Proc. Natl. Acad. Sci. USA. 2015;112:448–452. doi: 10.1073/pnas.1410088112. - DOI - PMC - PubMed
    1. Bardgett, R. D. & Wardle, D. A. Aboveground-belowground linkages: biotic interactions, ecosystem processes, and global change. (Oxford University Press, 2010).
    1. Tylianakis JM, Didham RK, Bascompte J, Wardle DA. Global change and species interactions in terrestrial ecosystems. Ecol. Lett. 2008;11:1351–1363. doi: 10.1111/j.1461-0248.2008.01250.x. - DOI - PubMed

Publication types