. 2022 Jul 28;13(1):4385.
doi: 10.1038/s41467-022-32109-2.

Phosphatidylinositol-4-phosphate controls autophagosome formation in Arabidopsis thaliana

Affiliations

Phosphatidylinositol-4-phosphate controls autophagosome formation in Arabidopsis thaliana

Rodrigo Enrique Gomez et al. Nat Commun. .

Abstract

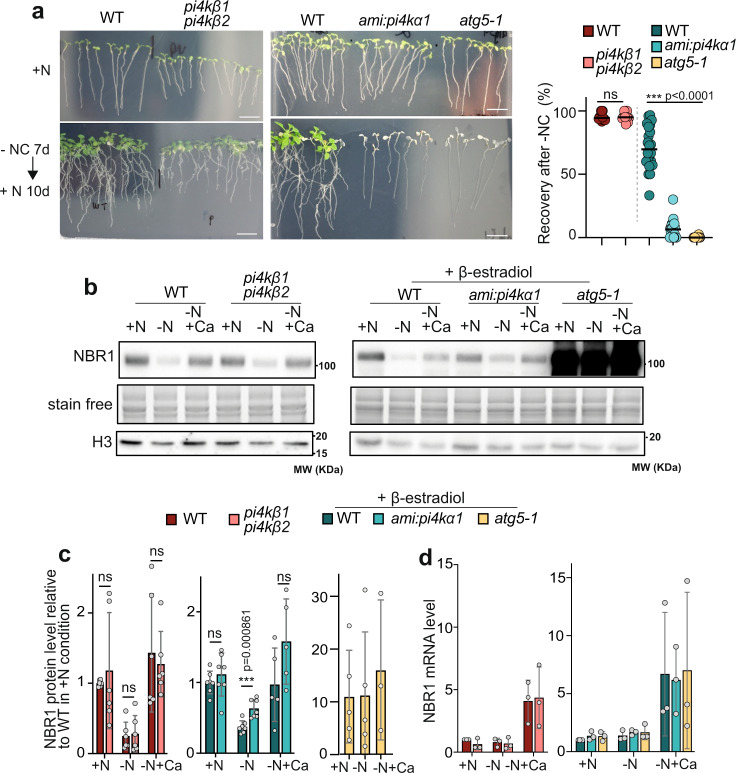
Autophagy is an intracellular degradation mechanism critical for plant acclimation to environmental stresses. Central to autophagy is the formation of specialized vesicles, the autophagosomes, which target and deliver cargo to the lytic vacuole. How autophagosomes form in plant cells remains poorly understood. Here, we uncover the importance of the lipid phosphatidylinositol-4-phosphate in autophagy using pharmacological and genetical approaches. Combining biochemical and live-microscopy analyses, we show that PI4K activity is required for early stages of autophagosome formation. Further, our results show that the plasma membrane-localized PI4Kα1 is involved in autophagy and that a substantial portion of autophagy structures are found in proximity to the PI4P-enriched plasma membrane. Together, our study unravels critical insights into the molecular determinants of autophagy, proposing a model whereby the plasma membrane provides PI4P to support the proper assembly and expansion of the phagophore thus governing autophagosome formation in Arabidopsis.


Conflict of interest statement

The authors declare no competing interests

Figures

Fig. 1
Fig. 1. The PI4-kinase inhibitor PAO blocks autophagic flux in root cells.
a, c, e Detection of GFP-ATG8a degradation and release of free GFP in the vacuole. 7-day-old GFP-ATG8a seedlings were transferred from nutrient rich MS plates to either nutrient rich liquid medium (+N), nutrient starved liquid medium (-nitrogen and carbon; −NC) or nutrient rich liquid medium supplemented with 1 μM AZD in either PI4K inhibiting conditions (+PAO) or control conditions (DMSO). Roots were dissected from seedlings after treatments and total root proteins were extracted and subjected to immunoblot analysis with anti-GFP antibodies. Stain free images were used as loading control. Uncropped blots in Source Data. In a, seedlings were transferred to nutrient rich liquid medium for 3 h (+N) or in nutrient deprived conditions and treated with 30 μM PAO or DMSO as control for 1.5 h or 3 h. In c, seedlings were treated for 3 h with various concentrations of PAO as indicated on the figure. In e, seedlings were transferred to liquid medium containing DMSO or 1 μM AZD for 3 h supplemented with PAO at either 7.5 μM or 30 μM, or DMSO as control. b, d, f Quantification of the ratio of GFP/GFP-ATG8a reflective of the rate of autophagy flux in each experimental conditions presented in a, c, and e respectively, relative to the ratio of control plants (−N+DMSO 3 h or + AZD+DMSO) which was set to 100% in each independent experiments. Results are presented as the mean ± SD with values of distinct replicates (b, number of independent experiments: n = 4 for 1.5 h conditions, n = 5 for other conditions; d, n = 6 distinct replicates examined over four independent biological experiments; f number of independent biological experiments: n = 3 for PAO conditions, n = 5 for other conditions) with two-tailed one sample t-test (for comparison to control at 100% in b, d, f) or two-tailed Mann-Whitney test (compare DMSO 1.5 h to PAO 1.5 h in b).
Fig. 2
Fig. 2. Downregulating PI4Kα1, but not PI4Kβ, compromises autophagy activity.
a amiRNA:PI4Kα1 seedlings display phenotypes reminiscent of an autophagy deficiency after recovery from nutrient starvation conditions. An overview of the experiment is presented in Supplementary Fig. 2c. Briefly, 7-day-old seedlings grown in rich conditions (+N) were transferred to nutrient deprived (−NC) solid medium for 7 days in darkness and then transferred back to +N solid medium for 10 days for recovery. Media were supplemented with 10 μM β-estradiol to compare the survival of amiRNA:-PI4Kα1 to that of WT and atg5-1. Scale Bar: 2 cm. To assess the percentage of recovery presented in the right panel, three independent experiments were carried out for PI4Kβ analyses with a total of n = 12 distinct replicates; four independent experiments were carried out for PI4Kα1 analyses with a total of n = 22, 22, or 24 distinct replicates for WT, amiRNA:PI4Kα1 or atg5-1, respectively. Statistical differences were assessed using two-tailed unpaired t-test, exact p values are provided in the source data file. b Immunoblot analyses of NBR1 protein levels from 7-day-old seedlings. An overview of the experimental set up is presented in Supplementary Fig. 2b. Uncropped blots in Source Data. Col-0 (WT), amiRNA:PI4Kα1, atg5-1, were grown on full MS agar plates, then transferred to β-estradiol containing MS plates for 24 h before being transferred in liquid nutrient rich (+N), liquid nutrient starvation medium (−N), or liquid nutrient starvation medium supplemented with 1 μM concanamycin A (+Ca), for 16 h. In the other set of samples, Col-0 (WT) and pi4kβ1 pi4kβ2 double mutant plants were directly transferred from full MS plates to liquid rich, liquid nutrient starvation or liquid nutrient starvation media supplemented with 1 μM concanamycin A (+Ca) for 16 h. c Quantification of the NBR1 protein levels relative to that of WT plants in +N conditions (set to 1) in the lines and conditions presented in (b). Signal from stain free gels and Histone H3 bands were used as loading control and for normalization. Results present the average ± SD and individual values. For PI4Kα1 experiments, in +N and −N conditions, n = 7 biological replicates were examined over four independent experiments for WT and amiRNA:PI4Kα1, n = 5 biological replicates in 3 independent experiments for atg5-1; in −N + Ca conditions, n = 5 biological replicates in three independent experiments for WT and amiRNA:PI4Kα1, n = 3 independent experiments for atg5-1. For PI4Kβ experiments, n = 6 biological replicates were examined over three independent experiments. Statistical differences were assessed using two-tailed unpaired t-test. ns, non significant. d NBR1 mRNA levels in the line and conditions presented in (b). Results represent the average ± SD of n = 3 independent experiments. Statistical differences were assessed using two-tailed one sample t-test (for comparison to WT in +N condition which was set to 1 in each experiment) or two-tailed Mann–Whitney test (for comparison to WT in −NC condition or WT in −NC+Ca conditions). Statistical analyses showed no significant differences across lines and conditions.
Fig. 3
Fig. 3. Inhibition of PI4K activity blocks autophagosome formation.
a Confocal images of roots from Arabidopsis plants expressing different isoforms of ATG8: GFP-ATG8a, GFP-ATG8e or GFP-ATG8f. 7-day-old plants were imaged in either nutrient rich conditions (directly from MS plates; +N) or after 30 min in nutrient deprived liquid medium (−NC) with the addition of PAO (P, 60 μM) or DMSO as control (D). Scale Bar: 20 μm. b Quantification of autophagic structures in conditions presented in (a). Results are presented as number of puncta per 1000 μm2 of root area, three independent experiments were performed for each condition, number of replicates (n, images) are indicated in the figure. For each ATG8 isoform, one-way ANOVA analyses showed statistical differences among the three conditions (+N, D, P, p < 0.0001 for each ATG8, see source data file for exact p values). Two-tailed t-test with a Bonferroni correction was used as a post hoc test showing statistical differences when +N or P conditions were compared to D; exact p values are provided in the source data file.
Fig. 4
Fig. 4. PI4K inhibition blocks ATG8 lipidation.
a Immunoblot analysis using anti-ATG8 antibody of WT or atg5-1 roots in rich conditions (R) or after 30 min in nutrient depleted conditions (−NC) with PAO 60 μM (P) compared to control conditions (D, DMSO). Uncropped blots in Source Data. Lipidated ATG8 is present in the pellet membrane containing fraction (P100), while being excluded from the supernatant (S100) fraction as shown by the comparison of the protein profiles between WT and atg5-1 mutant in which ATG8 conjugation is prevented. PIP2;7 was used as loading control and normalization factor for the membrane fraction; UGPase was used as loading control and normalization factor for the soluble fraction. Levels of ATG8-PE normalized to PIP2;7 in P100 of the selected blot is reported. b Quantification of ATG8 levels in conditions presented in (a). Results present the average of the level of ATG8 and ATG8-PE band intensities relative to each type of sample and normalized to either PIP2;7 or UGPase ± SD as well as individual values (n = 4 independent experiments) with two-tailed paired t-test to compare between Rich and DMSO or DMSO and PAO conditions. ns, non-significant.
Fig. 5
Fig. 5. PI4K inhibition prevents the formation of punctae-like structures of early ATG markers, but not their association to membranes.
ATG5-mCherry, ATG12-ATG5-mCherry (a), RFP-ATG4a (c), and YFP-ATG18a (e) accumulate in the membrane fraction in PI4P inhibition conditions. Immunoblot analyses using anti-mCherry antibody (a), anti-RFP antibody (c), and anti-YFP antibody (e). Uncropped blots in Source Data. 7-day-old seedlings were transferred from rich conditions (R) to nutrient deprived control conditions (D) or nutrient deprived medium supplemented with PAO 60 μM (P), for 30 min. Roots were dissected and proteins were analyzed by western blot after cell fractionation. PIP2;7 was used as loading control and normalization factor for the membrane fraction; UGPase was used as loading control and normalization factor for the soluble fraction. S100, soluble fraction; P100, pellet membrane containing fraction. Quantification of the levels of ATG5-mCherry and ATG12-ATG5-mCherry (b), RFP-ATG4a (d), and YFP-ATG18a (f) in conditions presented in a, c, e relative to P100 in DMSO conditions which was set to 1 in each independent experiment. Results present the average ± SD; number of independent experiments: n = 3 in (b) and in (d), in (f) n = 5 for P100 samples, n = 4 for other conditions. In (b) multiple comparison statistical analyses using the Kruskal–Wallis (KW) test were performed to assess differences among the 3 conditions (+N, Rich, PAO) in each group of samples (TL, S100, P100). Resulting exact p values are indicated below the graph and only showed significant differences among the P100 samples. Follow-up statistical analyses comparing Rich or PAO conditions to DMSO were performed using two-tailed one sample t-test. In d and f statistical differences between DMSO and PAO conditions were performed using two-tailed one-sample t-test. ns, non-significant. g Confocal microscopy images of ATG5-mCherry, RFP-ATG4a, and YFP-ATG18a-expressing plants. 7-day-old seedlings were transferred to liquid nutrient deprived control conditions (DMSO) or nutrient-deprived supplemented with PAO 60 μM (PAO), for 30 min. Scale Bar: 20 μm. h Quantification of ATG puncta in conditions presented in (g). Results as presented as number of puncta per 1000 μm2, bar is mean. For ATG5 puncta, three independent experiments were performed with n = 41 images for DMSO and n = 68 images for PAO. For ATG4 puncta, 4 independent experiments were performed with n = 46 images for DMSO and n = 62 images for PAO. For ATG18 puncta, three independent experiments were performed with n = 38 images for DMSO and n = 40 images for PAO. Statistical differences between conditions were assessed using two-tailed unpaired t-test, exact p values are provided in the source data file.
Fig. 6
Fig. 6. PI4P accumulates on late autophagy structures.
a Confocal images of 7-day-old seedlings co-expressing mCherry-ATG8f and the PI4P-binding probe Citrine-1xPHFAPP1- E50A-H54A. Plants were placed in liquid MS medium deprived of nutrients (−NC) for 2 or 5 h, in control conditions or supplemented with concanamycin A (Ca, 1 μM). Scale bar: 20 μm. b Quantification of the co-localization events in (a) as percentage of mCitrine puncta colocalizing with mCherry signal. Box plots indicate all individual values and median (middle line), 25th, 75th percentile (box), and 5th and 95th percentile (whiskers). For conditions −NC 2 h and −NC 5 h, n = 8 distinct replicates were examined over three independent experiments; for condition −NC 5 h + Ca, n = 62 distinct replicates were examined over five independent experiments).
Fig. 7
Fig. 7. Autophagy structures form close to PI4P-enriched compartments.
ad Confocal images of 7-day-old seedlings co-expressing the PI4P-binding probe mCitrine-1xPHFAPP1-E50A-H54A and either mCherry-ATG8f (a) or ATG5-mCherry (c). Plants were placed in autophagy induction conditions (−NC) for 1.5 h. Empty arrowheads indicate puncta in the cytosol (Cy), full arrowheads indicate puncta at proximity from the plasma membrane (Pr) and arrows indicate puncta on the plasma membrane (PM). Scale Bar: 10 μm. Repartition of the three distinct types of ATG8 or ATG5 puncta populations are presented in b and d, respectively. For each image we counted the total number of puncta as well as the number of puncta in each category. We used these data to calculate the percentage of puncta in each category compared to total puncta. Box plots indicate all individual values and median (middle line), 25th, 75th percentile (box), and 5th and 95th percentile (whiskers). In b, n = 52 images were examined over four independent biological experiments; in d, n = 49 images were examined over 5 independent biological experiments. e (1) Confocal acquisition of the root tip of seedlings co-expressing GFP-ATG8a and 2xmCherry-2xPHFAPP1 after 1.5 h induction of autophagy using 1 μM AZD. (2) Transmission electron micrograph tiles of the regions observed in (1). (3) Correlated light electron microscopy view of the root tip which allows the precise identification of autophagic structures. (4) Magnification of a region of interest identified by CLEM allows to locate an autophagic structure and (5) to perform electron tomography to improve resolution and access to its 3D organization and cellular environment. (6) Segmentation of the autophagic structure. The plasma membrane is represented in magenta, the phagophore in green, the ER in yellow. f Quantification of (e). Proximity of ATG8-labeled structures (phagophores, Ph; autophagosomes, AP) with cell compartments in percentage of total phagophore or autophagosome analyzed. A total of 68 autophagy structures were analyzed over three independent biological samples. The distance of each structure to other cell compartments (ER, PM, Golgi, Plastid, Mitochondria (mito.), vacuole, or Multi Vesicular Body (MVB)) was measured, and structures were categorized in distinct range of distance compared to cell compartments. The results present the average ± SD of each category in % of the total structures analyzed in each biological sample (n = 3).

References

    1. Marshall RS, Vierstra RD. Autophagy: The master of bulk and selective recycling. Annu. Rev. Plant Biol. 2018;69:173–208. doi: 10.1146/annurev-arplant-042817-040606. - DOI - PubMed
    1. Guiboileau A, et al. Autophagy machinery controls nitrogen remobilization at the whole-plant level under both limiting and ample nitrate conditions in Arabidopsis. New Phytol. 2012;194:732–740. doi: 10.1111/j.1469-8137.2012.04084.x. - DOI - PubMed
    1. Liu Y, Bassham DC. Autophagy: Pathways for self-eating in plant cells. Annu. Rev. Plant Biol. 2012;63:215–237. doi: 10.1146/annurev-arplant-042811-105441. - DOI - PubMed
    1. Soto-burgos J, Zhuang X, Jiang L, Bassham DC. Dynamics of autophagosome formation. Plant Physiol. 2018;176:219–229. doi: 10.1104/pp.17.01236. - DOI - PMC - PubMed
    1. Feng Y, He D, Yao Z, Klionsky DJ. The machinery of macroautophagy. Cell Res. 2014;24:24–41. doi: 10.1038/cr.2013.168. - DOI - PMC - PubMed

Publication types

MeSH terms

Substances

LinkOut - more resources