

Administration of probiotic lactic acid bacteria to modulate fecal microbiome in feedlot cattle
- PMID: 35902668
- PMCID: PMC9334624
- DOI: 10.1038/s41598-022-16786-z
Administration of probiotic lactic acid bacteria to modulate fecal microbiome in feedlot cattle
Abstract
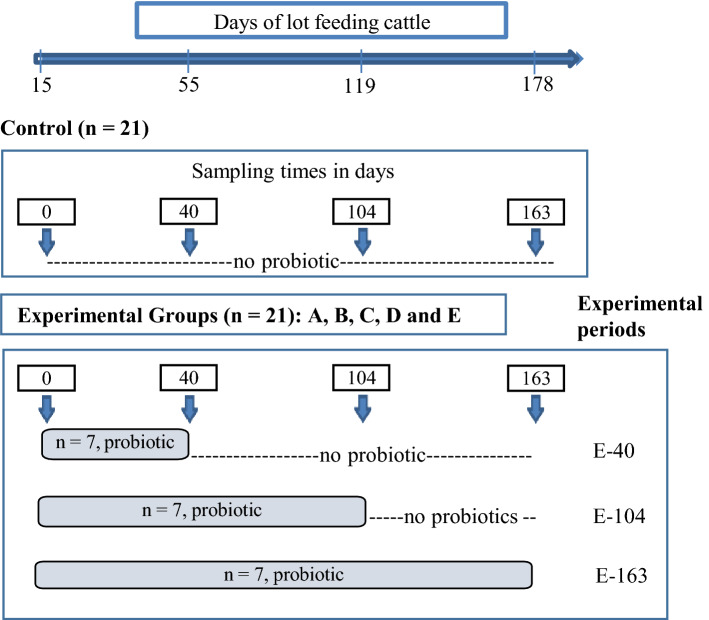
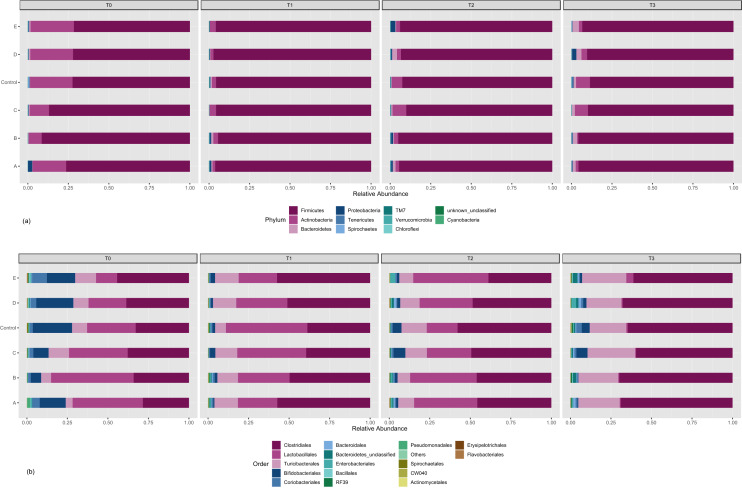
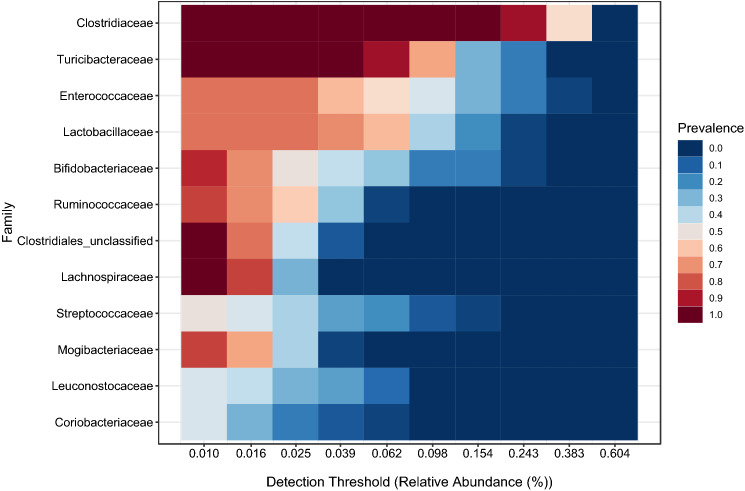
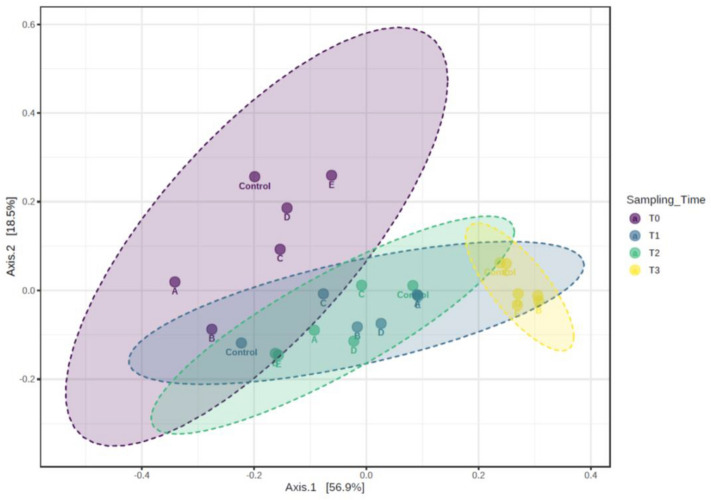
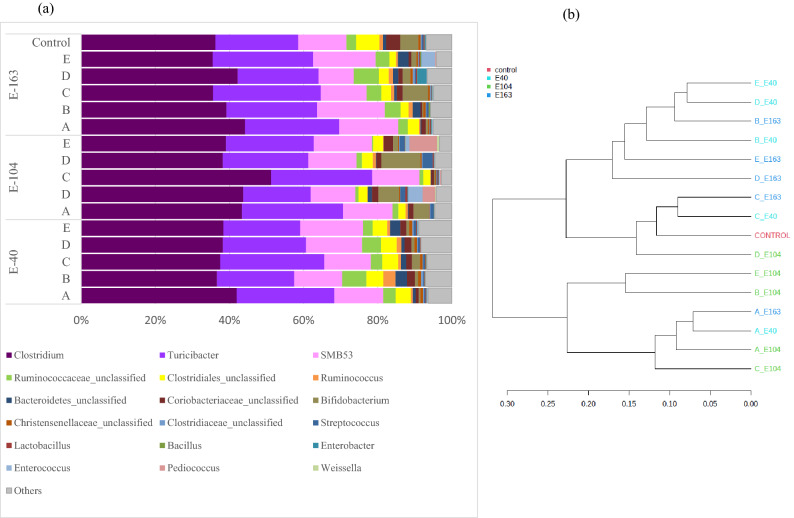
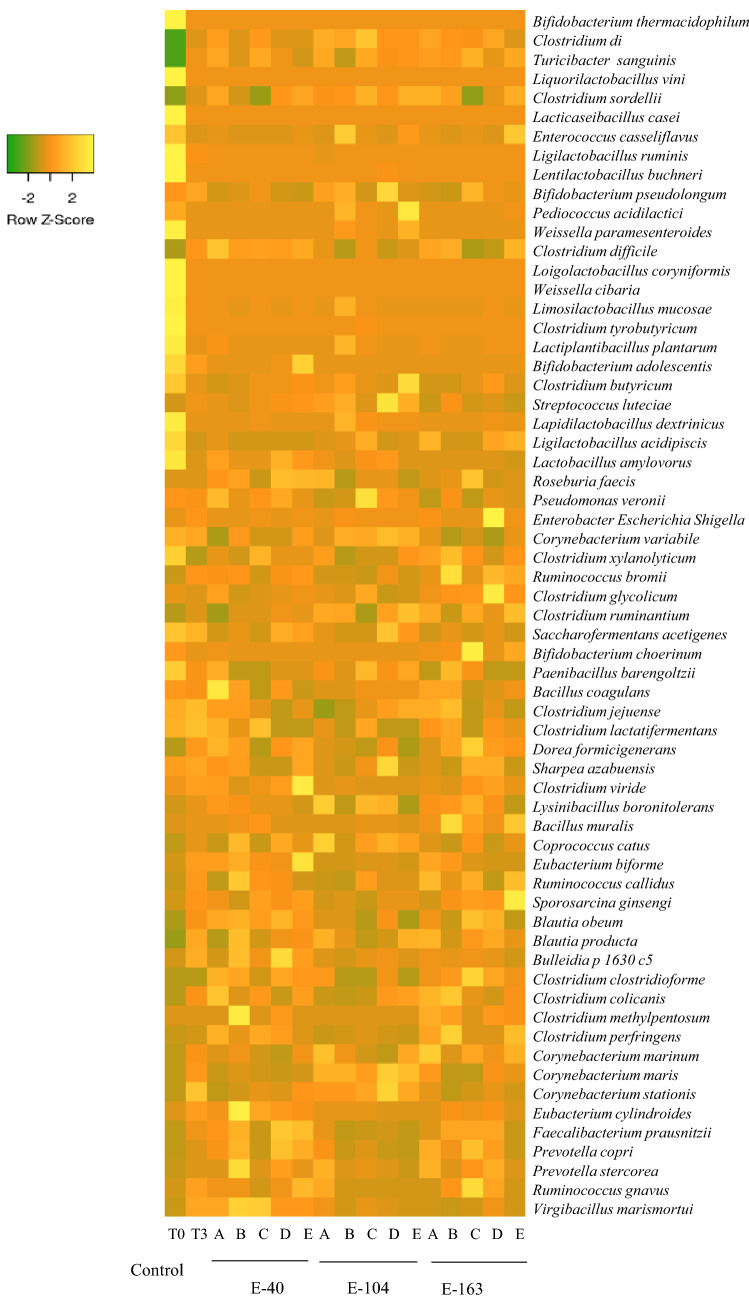
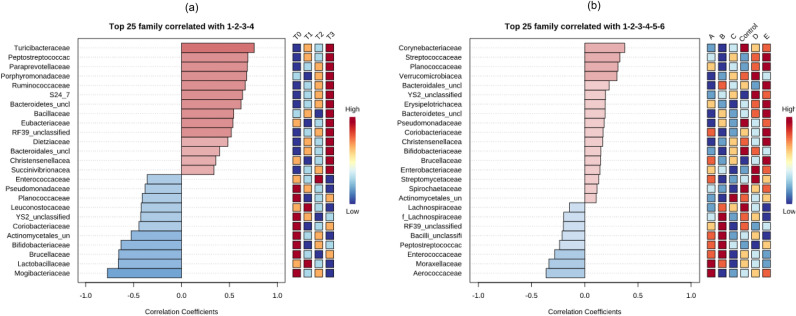
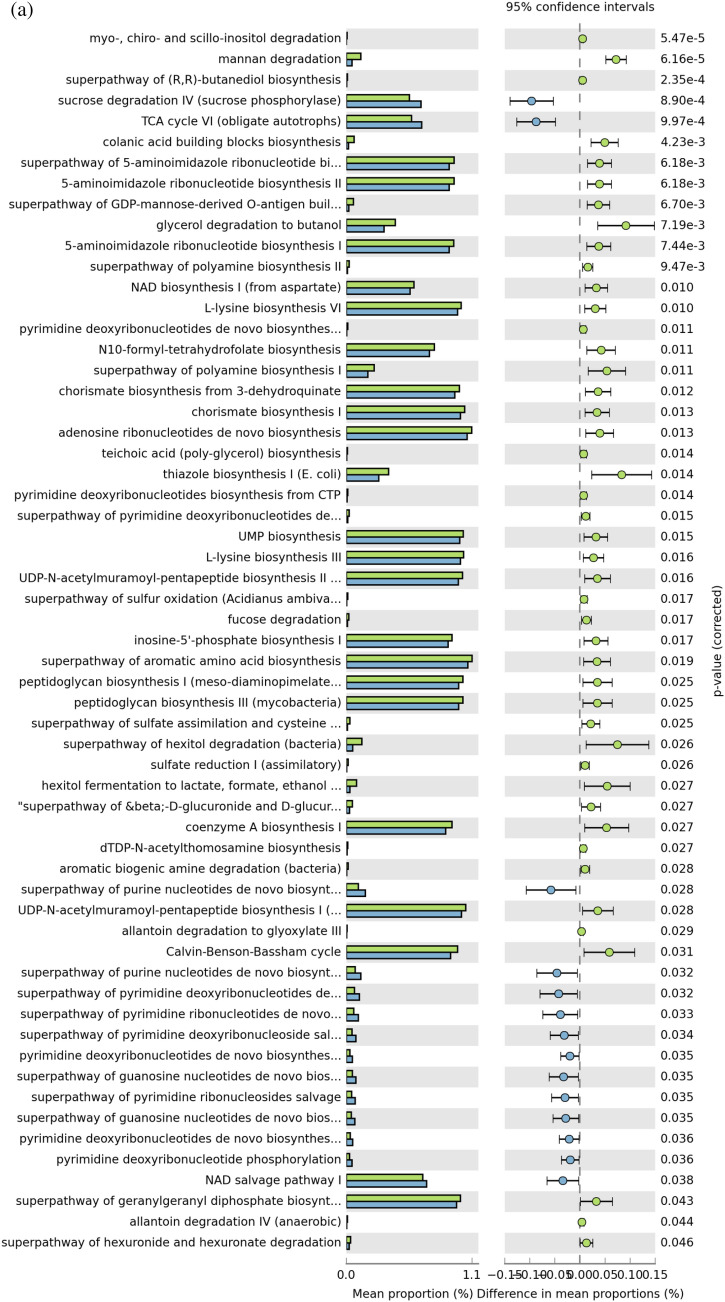
Modulation of animal gut microbiota is a prominent function of probiotics to improve the health and performance of livestock. In this study, a large-scale survey to evaluate the effect of lactic acid bacteria probiotics on shaping the fecal bacterial community structure of feedlot cattle during three experimental periods of the fattening cycle (163 days) was performed. A commercial feedlot located in northwestern Argentina was enrolled with cattle fed mixed rations (forage and increasing grain diet) and a convenience-experimental design was conducted. A pen (n = 21 animals) was assigned to each experimental group that received probiotics during three different periods. Groups of n = 7 animals were sampled at 40, 104 and 163 days and these samples were then pooled to one, thus giving a total of 34 samples that were subjected to high-throughput sequencing. The microbial diversity of fecal samples was significantly affected (p < 0.05) by the administration period compared with probiotic group supplementation. Even though, the three experimental periods of probiotic administration induced changes in the relative abundance of the most representative bacterial communities, the fecal microbiome of samples was dominated by the Firmicutes (72-98%) and Actinobacteria (0.8-27%) phyla, while a lower abundance of Bacteroidetes (0.08-4.2%) was present. Probiotics were able to modulate the fecal microbiota with a convergence of Clostridiaceae, Lachnospiraceae, Ruminococcaceae and Bifidobacteriaceae associated with health and growth benefits as core microbiome members. Metabolic functional prediction comparing three experimental administration periods (40, 104 and 163 days) showed an enrichment of metabolic pathways related to complex plant-derived polysaccharide digestion as well as amino acids and derivatives during the first 40 days of probiotic supplementation. Genomic-based knowledge on the benefits of autochthonous probiotics on cattle gastrointestinal tract (GIT) microbiota composition and functions will contribute to their selection as antibiotic alternatives for commercial feedlot.
© 2022. The Author(s).
Conflict of interest statement
The authors declare no competing interests.
Figures
 E- 40;
  E-104;
  E-163. The q-values are based on Welsh's t test and corrected with Benjamini–Hochberg FDR.
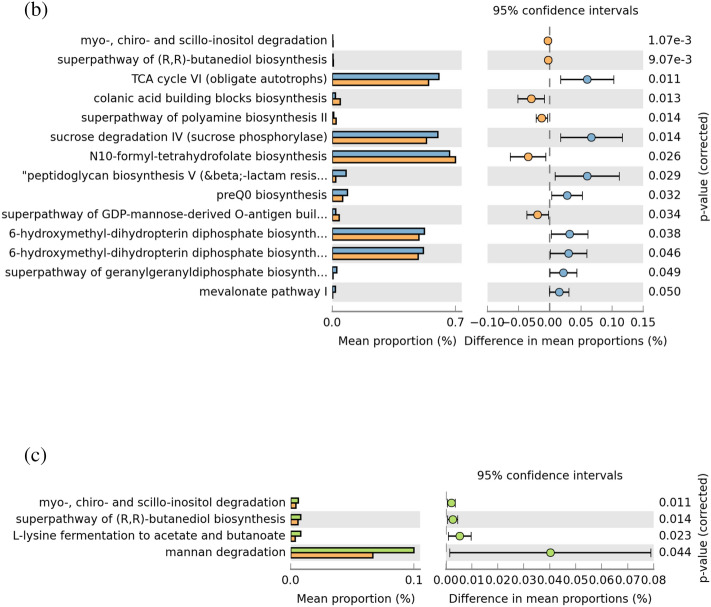 E- 40; E-104; E-163. The q-values are based on Welsh's t test and corrected with Benjamini–Hochberg FDR.
References
Publication types
MeSH terms
Substances
LinkOut - more resources
Full Text Sources
