. 2022 Jul 28;12(1):12921.
doi: 10.1038/s41598-022-17081-7.

Evidence for oligodendrocyte progenitor cell heterogeneity in the adult mouse brain

Affiliations

Evidence for oligodendrocyte progenitor cell heterogeneity in the adult mouse brain

Rebecca M Beiter et al. Sci Rep. .

Abstract

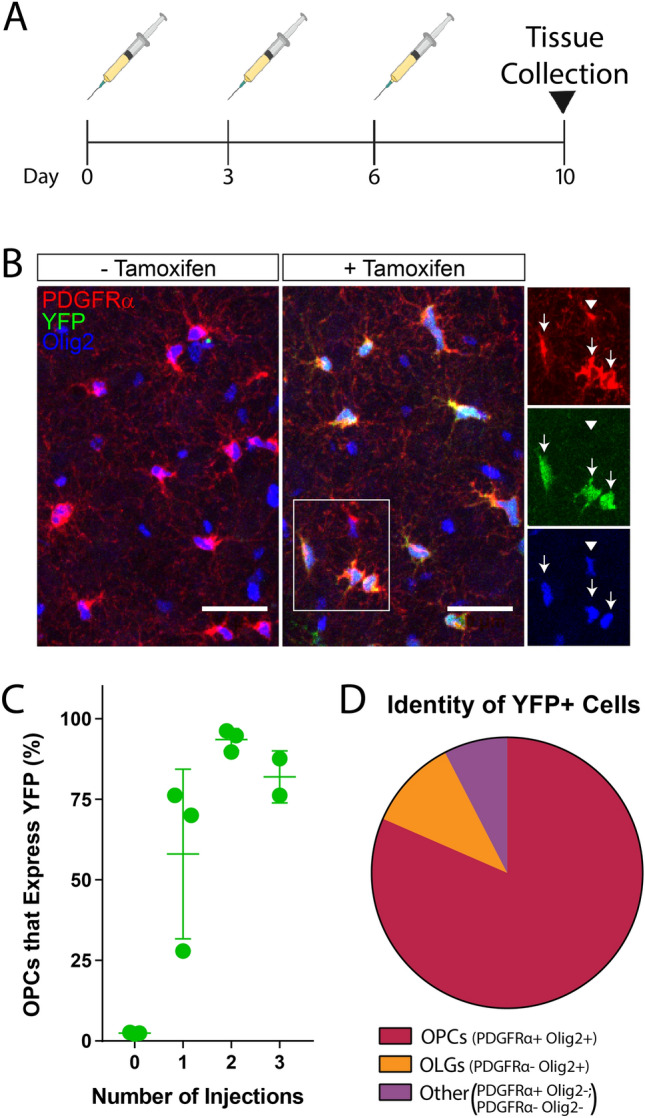
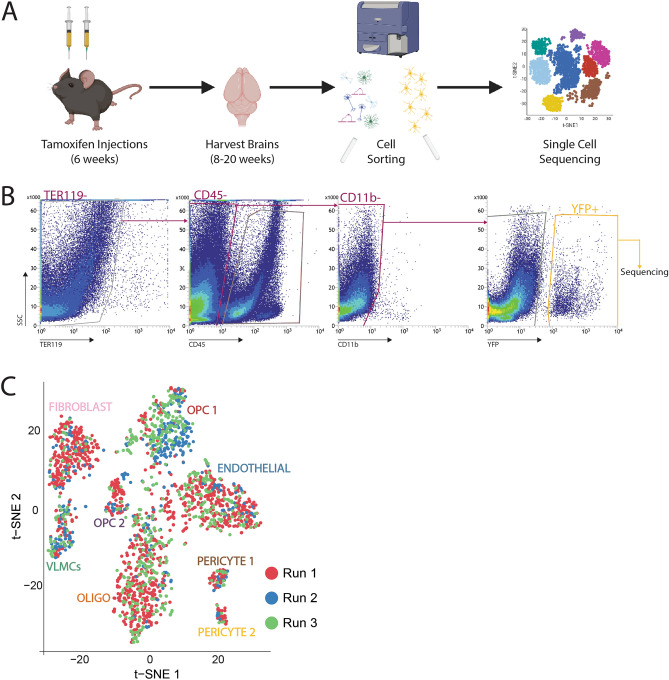
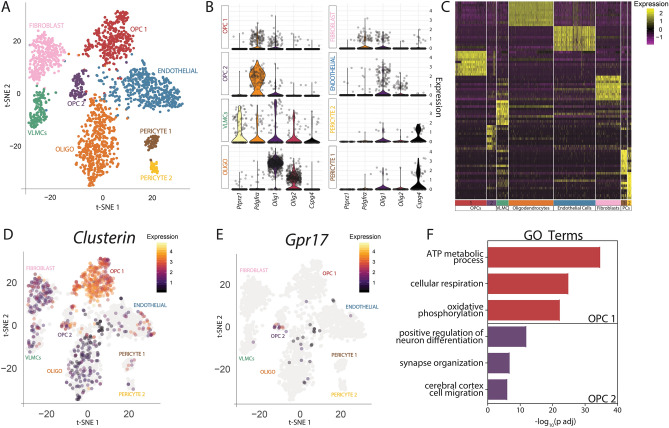
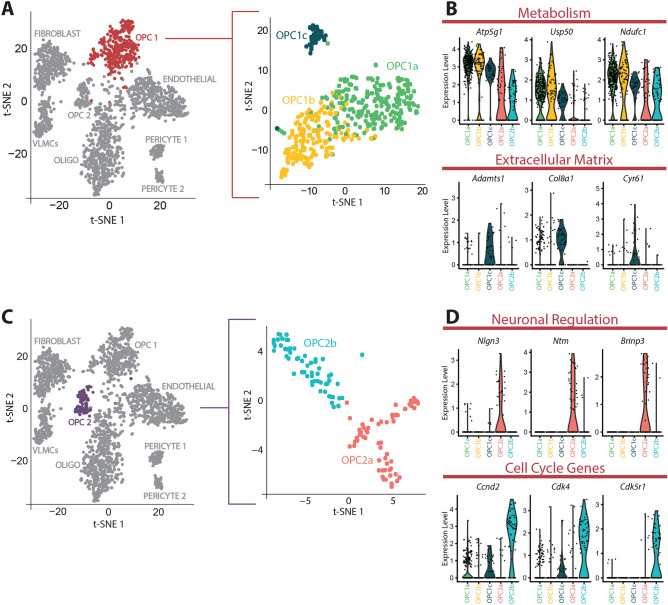
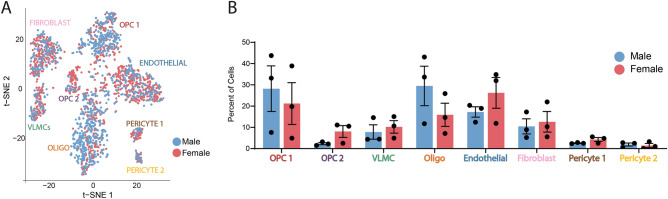
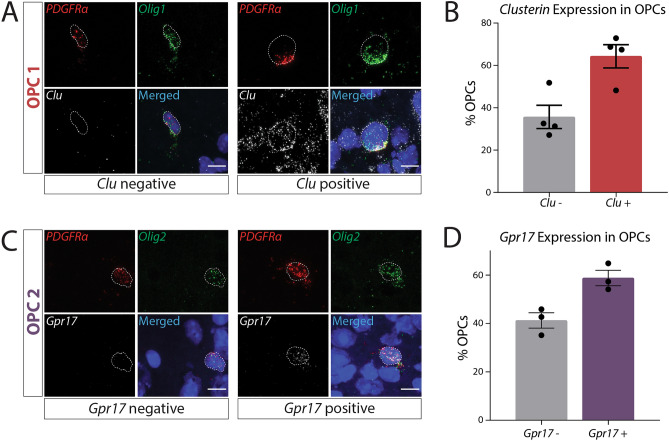
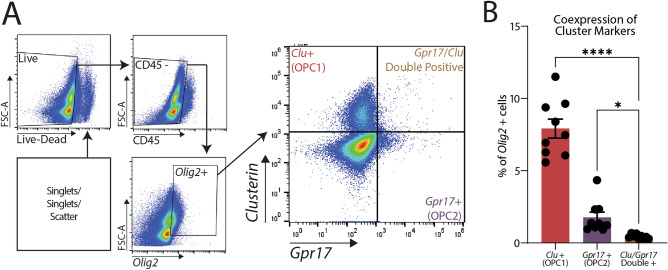
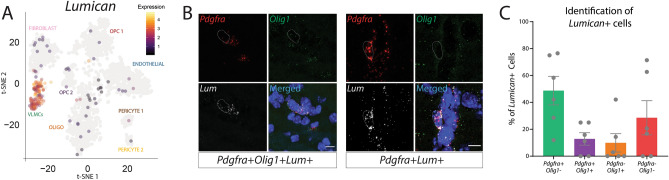
Oligodendrocyte progenitor cells (OPCs) account for approximately 5% of the adult brain and have been historically studied for their role in myelination. In the adult brain, OPCs maintain their proliferative capacity and ability to differentiate into oligodendrocytes throughout adulthood, even though relatively few mature oligodendrocytes are produced post-developmental myelination. Recent work has begun to demonstrate that OPCs likely perform multiple functions in both homeostasis and disease and can significantly impact behavioral phenotypes such as food intake and depressive symptoms. However, the exact mechanisms through which OPCs might influence brain function remain unclear. The first step in further exploration of OPC function is to profile the transcriptional repertoire and assess the heterogeneity of adult OPCs. In this work, we demonstrate that adult OPCs are transcriptionally diverse and separate into two distinct populations in the homeostatic brain. These two groups show distinct transcriptional signatures and enrichment of biological processes unique to individual OPC populations. We have validated these OPC populations using multiple methods, including multiplex RNA in situ hybridization and RNA flow cytometry. This study provides an important resource that profiles the transcriptome of adult OPCs and will provide a toolbox for further investigation into novel OPC functions.


Conflict of interest statement

The authors declare no competing interests.

Figures

Figure 1
Figure 1
Validation of PDGFRα-CreER; R26-EYFP reporter mouse. (A) Timeline of tamoxifen injections and tissue harvest used to validate YFP expression and titrate optimal tamoxifen dosing paradigm. (B) Immunofluorescence of PDGFRα (red), Olig2 (blue), and YFP (green) in PDGFRα-CreER; R26-eYFP mice receiving no tamoxifen injections (− Tamoxifen) or 2 tamoxifen injections (+ Tamoxifen). Arrows represent OPCs expressing YFP and arrowheads represent OPCs lacking YFP expression. Scale bar = 30 µm. (C) Percentage of OPCs (PDGFRα+/Olig2+) that also express YFP following 0, 1, 2, or 3 tamoxifen injections. N = 3 independent experiments, n = 2–3 per group. Error bars represent SEM. (D) Proportion of YFP+ cells identified as OPCs (PDGFRα+/Olig2+), Oligodendrocytes (OLG, PDGFRα−/Olig2+), or neither of these cell types (Other, PDGFRα+/Olig2− or PDGFRα−/Olig2−) following 2 tamoxifen injections. N = 2 independent experiments, n = 3 samples. Data quantified in (C,D) include images from the prefrontal cortex, hippocampus, and corpus callosum.
Figure 2
Figure 2
Isolation of YFP+ cells from PDGFRα-CreER × YFP brains for sequencing. (A) Experimental strategy used for the isolation and single-cell sequencing of cells. (B) Gating strategy for YFP+ cell sorting following live/scatter/singlet gating. (C) tSNE map depicting cell clusters colored by sequencing run.
Figure 3
Figure 3
Adult OPCs cluster in two distinct subpopulations. (A) tSNE plot of all sequenced cells isolated from PDGFRα-CreER reporter brains. Clusters were labeled with cell-type classifications based on expression of common cell-type markers. N = 3 independent experiments, n = 6 biological samples (3 males and 3 females). (B) Violin plots depicting expression of common OPC markers in each cluster. Each dot represents a cell. Expression value is plotted on the y-axis. (C) Heatmap depicting the scaled and log-normalized expression values of the top 10 most highly enriched genes in each cluster. (D) Cell-specific expression of Clusterin used for cluster validation of OPC1 overlaid on the tSNE map. (E) Cell-specific expression of Gpr17 used for cluster validation of OPC2 overlaid on the tSNE map. (F) Significant GO terms uniquely upregulated in one OPC cluster compared to each OPC cluster and VLMCs. PCs pericytes.
Figure 4
Figure 4
Subclustering reveals potential functions of OPCs. (A) Subclustering of OPC1 into 3 subclusters (OPC1a, OPC1b, and OPC1c). (B) Violin plots depicting expression of genes related to metabolism that are significantly upregulated in OPC1a and genes related to the extracellular matrix that are significantly upregulated in OPC1c. Each dot represents a cell. (C) Subclustering of OPC2 into 2 subclusters (OPC2a and OPC2b). (D) Violin plots depicting expression of genes related to neuronal regulation that are significantly upregulated in OPC2a and genes related to the cell cycle that are significantly upregulated in OPC2b. Each dot represents a cell.
Figure 5
Figure 5
Distribution of PDGFRα positive cells in each cluster based on sex. (A) tSNE map depicting cell clusters colored by sex. (B) Percent of male and female cells that fall within each cluster. Each dot represents an individual sequencing sample.
Figure 6
Figure 6
In vivo expression of cluster markers Clusterin and Gpr17 in OPCs. (A) RNAscope expression of Pdgfrα (red), Olig1 (green), Clu (white), and Hoechst (blue). White dotted line indicates the nuclear outline. (B) Quantification of Clu+ and Clu− OPCs (depicted in (A); N = 2 independent experiments, n = 4 individual mice (2 males and 2 females) with 206 total cells analyzed). Each sample includes quantification of OPCs from the cortex, hippocampus, corpus callosum, and cerebellum. (C) RNAscope expression of Pdgfrα (red), Olig2 (green), Gpr17 (white), and Hoechst (blue). White dotted line indicates the nuclear outline. (D) Quantification of Gpr17+ and Gpr17− OPCs (depicted in (C); N = 2 independent experiments, n = 3 individual mice (1 male and 2 females) with 204 total cells analyzed). Each sample includes quantification of OPCs from the cortex, hippocampus, corpus callosum, and cerebellum. In all RNAscope experiments, OPCs were identified as cells co-expressing an OPC surface marker (Pdgfrα or Cspg4) and an oligolineage transcription factor (Olig1 or Olig2). Scale bar = 10 µm.
Figure 7
Figure 7
OPC clusters do not overlap in vivo. (A) Representative PrimeFlow gating of brain cells stained for CD45 protein and Clu, Gpr17, Pdgfra, and Olig2 RNA (115,783 events plotted in Clusterin vs. Gpr17 plot). (B) Quantification of live/CD45−/Olig2+ cells that express Clu alone, Gpr17 alone, or both Clusterin and Gpr17. N = 2 individual experiments, n = 9 biological samples (9 males). Analyzed using one-way repeated measures ANOVA with a Tukey’s pos-hoc test (F(2,8) = 90.85, p < 0.0001). *p < 0.05, ****p < 0.0001. Error bars represent SEM. All gates for RNA probes were drawn using fluorescence minus one (FMO) stains.
Figure 8
Figure 8
Lumican+ fibroblast-like cells are found in the brain parenchyma. (A) Expression of Lumican, a marker of the VLMC cluster overlaid on the tSNE map. (B) Representative RNAscope images of an OPC (Pdgfra+ Olig1+) and a fibroblast-like cell (Pdgfra+ Olig1−) expressing Lumican in the brain parenchyma. White dotted line indicates the nuclear outline. (C) Quantification of the percentage of Lumican+ cells in each mouse that also expressed Pdgfra, Olig1, both, or neither. N = 3 individual experiments, n = 6 biological samples (3 males and 3 females).

References

    1. Raff MC, Miller RH, Noble M. A glial progenitor-cell that develops invitro into an astrocyte or an oligodendrocyte depending on culture-medium. Nature. 1983;303:390–396. doi: 10.1038/303390a0. - DOI - PubMed
    1. Dawson MR, Polito A, Levine JM, Reynolds R. NG2-expressing glial progenitor cells: An abundant and widespread population of cycling cells in the adult rat CNS. Mol. Cell Neurosci. 2003;24:476–488. doi: 10.1016/S1044-7431(03)00210-0. - DOI - PubMed
    1. Geha S, et al. NG2+/Olig2+ cells are the major cycle-related cell population of the adult human normal brain. Brain Pathol. 2010;20:399–411. doi: 10.1111/j.1750-3639.2009.00295.x. - DOI - PMC - PubMed
    1. Simon C, Gotz M, Dimou L. Progenitors in the adult cerebral cortex: Cell cycle properties and regulation by physiological stimuli and injury. Glia. 2011;59:869–881. doi: 10.1002/glia.21156. - DOI - PubMed
    1. Hughes EG, Kang SH, Fukaya M, Bergles DE. Oligodendrocyte progenitors balance growth with self-repulsion to achieve homeostasis in the adult brain. Nat. Neurosci. 2013;16:668–676. doi: 10.1038/nn.3390. - DOI - PMC - PubMed

Publication types