. 2022 Aug;54(8):1178-1191.
doi: 10.1038/s41588-022-01134-8. Epub 2022 Jul 28.

Single-nucleus and spatial transcriptome profiling of pancreatic cancer identifies multicellular dynamics associated with neoadjuvant treatment

William L Hwang #  1   2   3 Karthik A Jagadeesh #  1   2 Jimmy A Guo #  1   2   4   5   6 Hannah I Hoffman #  1   2   3   7 Payman Yadollahpour  1   2 Jason W Reeves  8 Rahul Mohan  2 Eugene Drokhlyansky  2 Nicholas Van Wittenberghe  2 Orr Ashenberg  2 Samouil L Farhi  2 Denis Schapiro  2   9   10 Prajan Divakar  8 Eric Miller  8 Daniel R Zollinger  8 George Eng  3   11 Jason M Schenkel  3   12 Jennifer Su  1   2   3 Carina Shiau  1   2 Patrick Yu  2 William A Freed-Pastor  3   5 Domenic Abbondanza  2 Arnav Mehta  2   5   13 Joshua Gould  2 Conner Lambden  2 Caroline B M Porter  2 Alexander Tsankov  2 Danielle Dionne  2 Julia Waldman  2 Michael S Cuoco  2 Lan Nguyen  2 Toni Delorey  2 Devan Phillips  2   14 Jaimie L Barth  11 Marina Kem  11 Clifton Rodrigues  15 Debora Ciprani  15 Jorge Roldan  15 Piotr Zelga  15 Vjola Jorgji  11 Jonathan H Chen  2   11 Zackery Ely  3 Daniel Zhao  16 Kit Fuhrman  8 Robin Fropf  8 Joseph M Beechem  8 Jay S Loeffler  1 David P Ryan  13 Colin D Weekes  13 Cristina R Ferrone  15 Motaz Qadan  15 Martin J Aryee  2   11 Rakesh K Jain  1   17 Donna S Neuberg  18 Jennifer Y Wo  1 Theodore S Hong  1 Ramnik Xavier  2 Andrew J Aguirre  2   5 Orit Rozenblatt-Rosen  2   14 Mari Mino-Kenudson  11 Carlos Fernandez-Del Castillo  15 Andrew S Liss  15 David T Ting  13 Tyler Jacks  19 Aviv Regev  20   21
Affiliations

Single-nucleus and spatial transcriptome profiling of pancreatic cancer identifies multicellular dynamics associated with neoadjuvant treatment

William L Hwang et al. Nat Genet. 2022 Aug.

Abstract

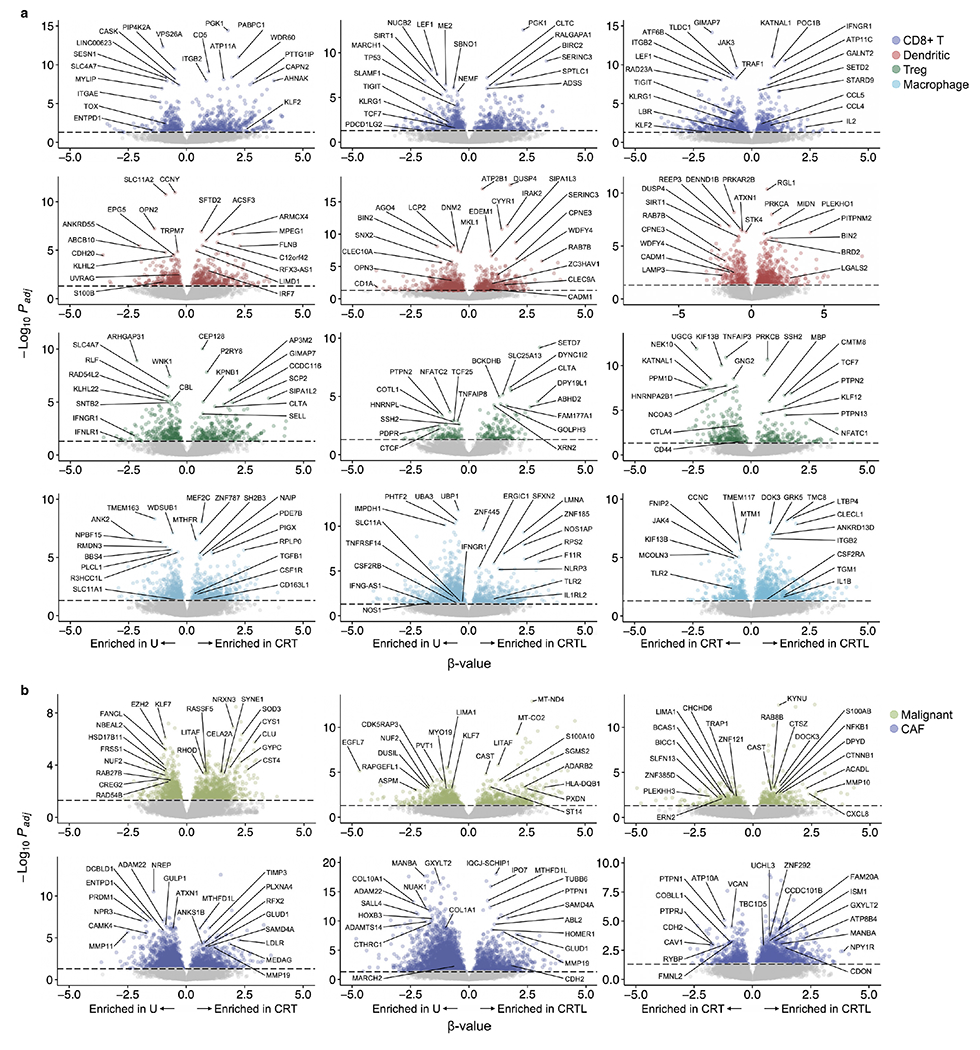
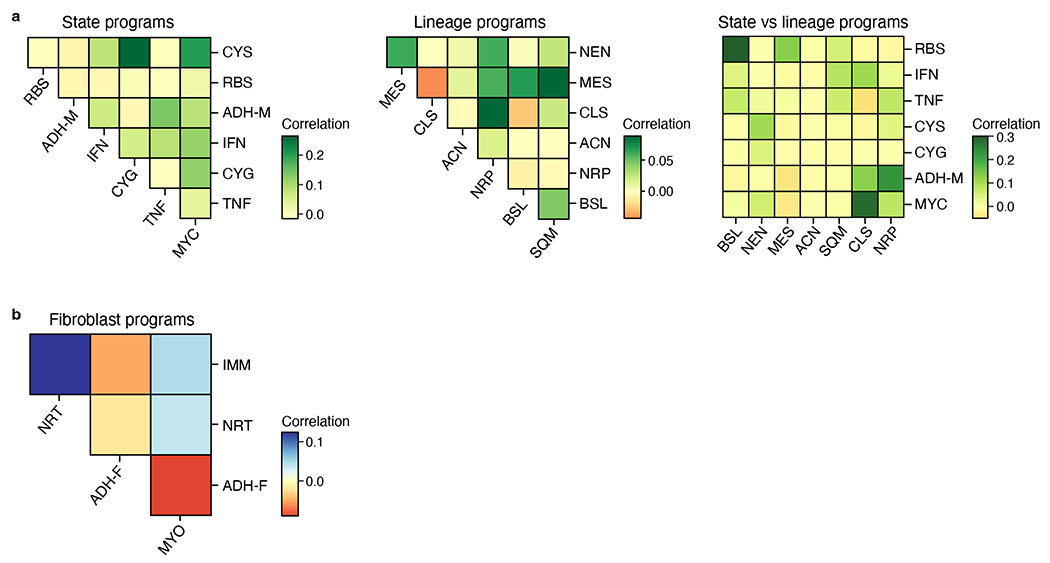
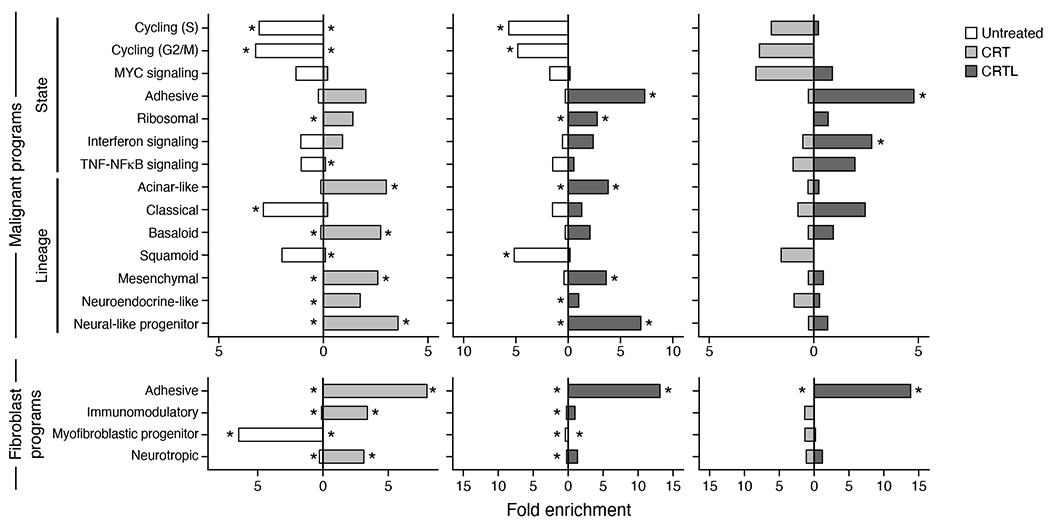
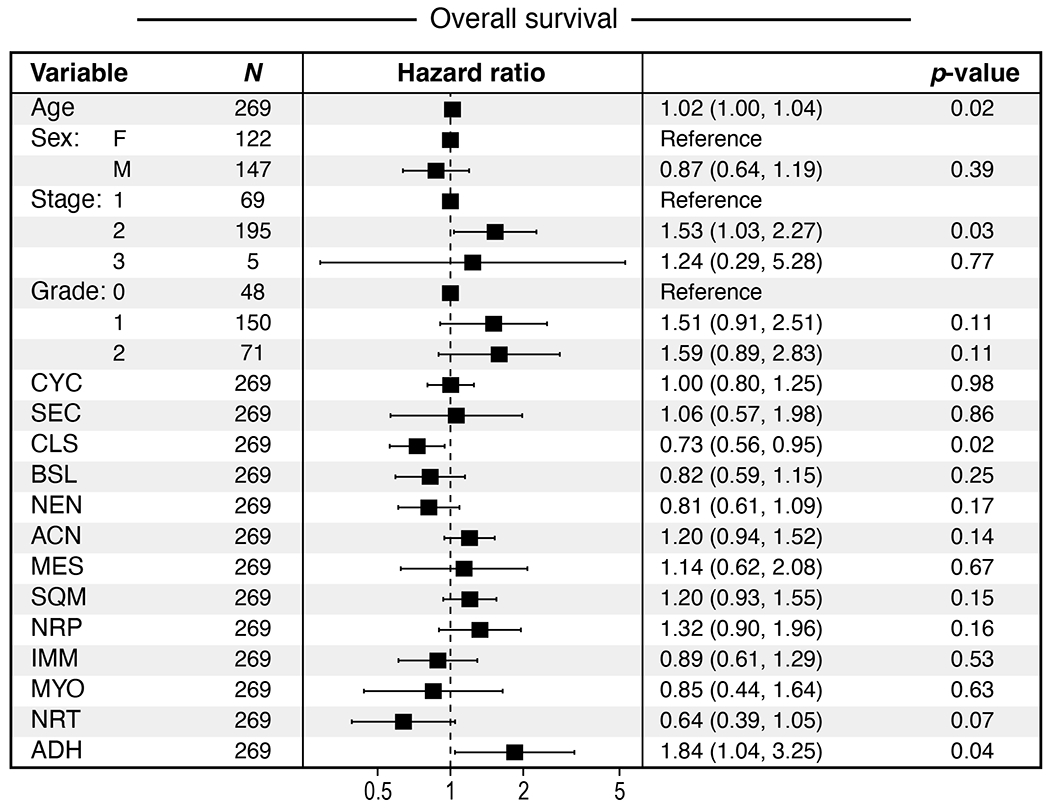
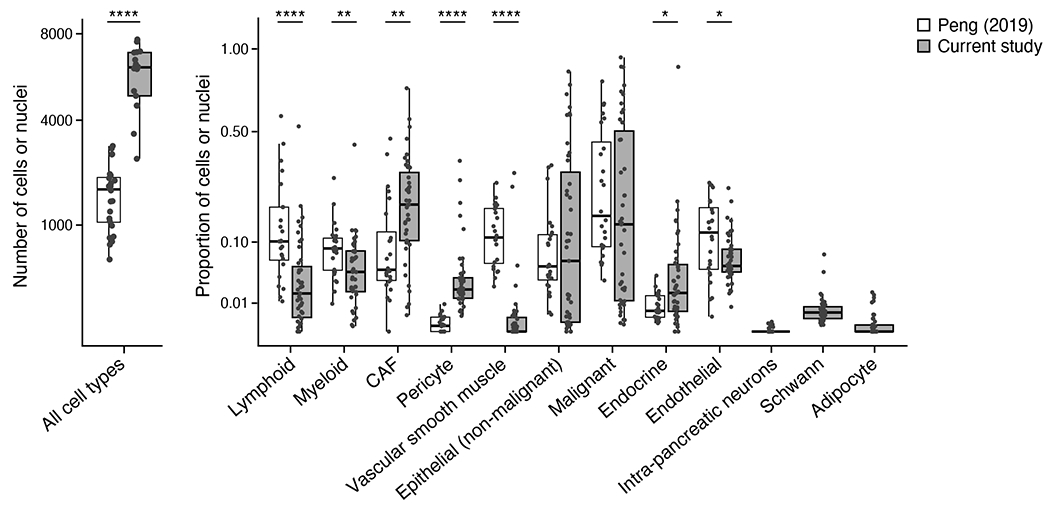
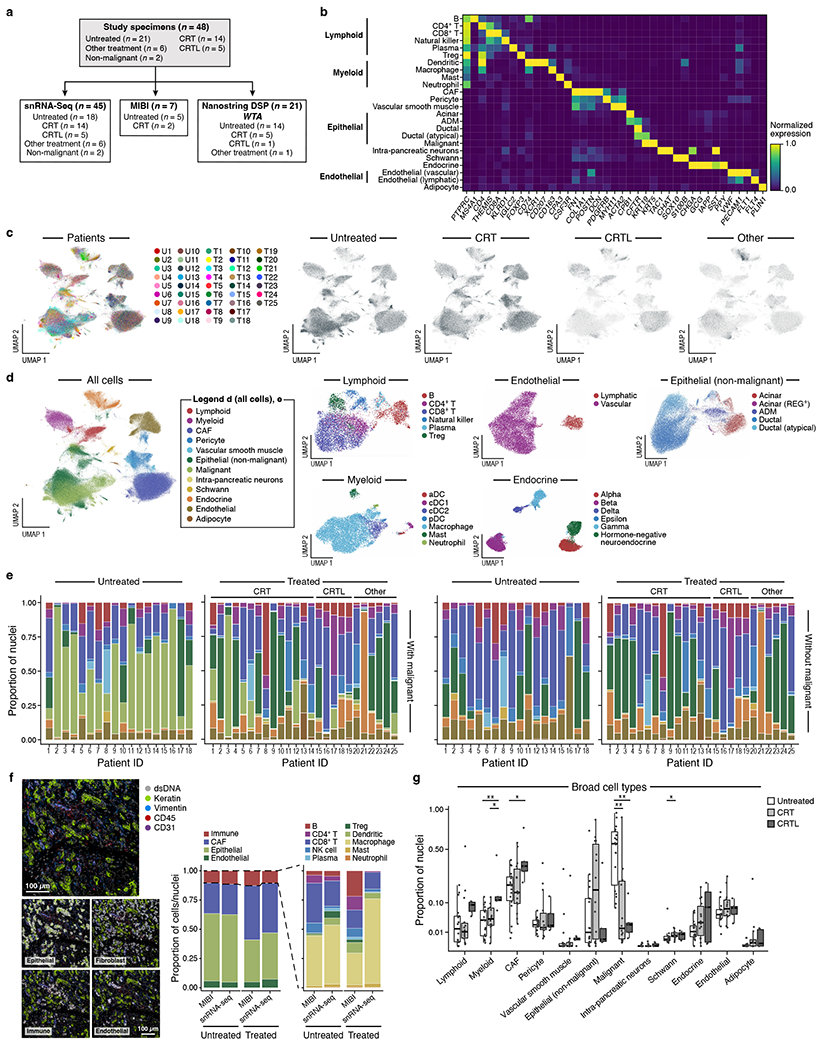
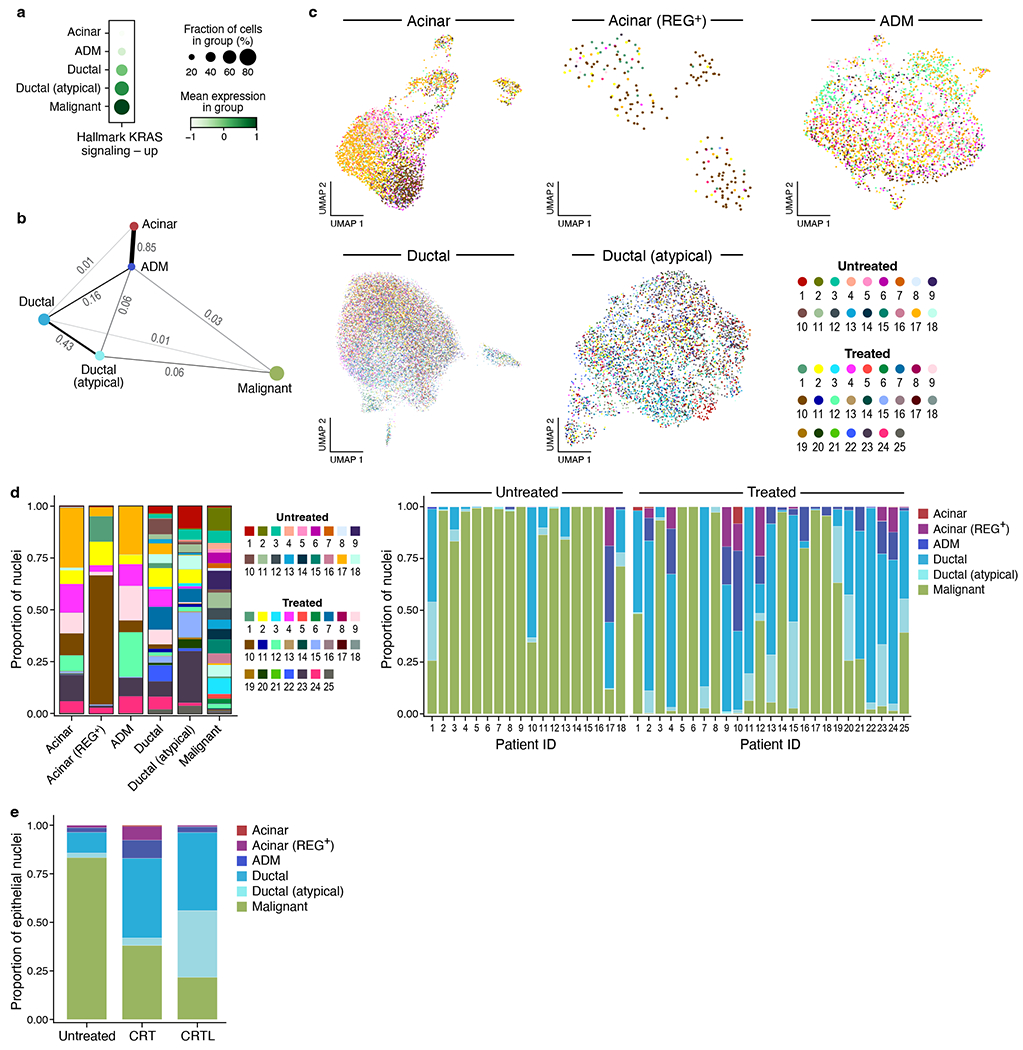
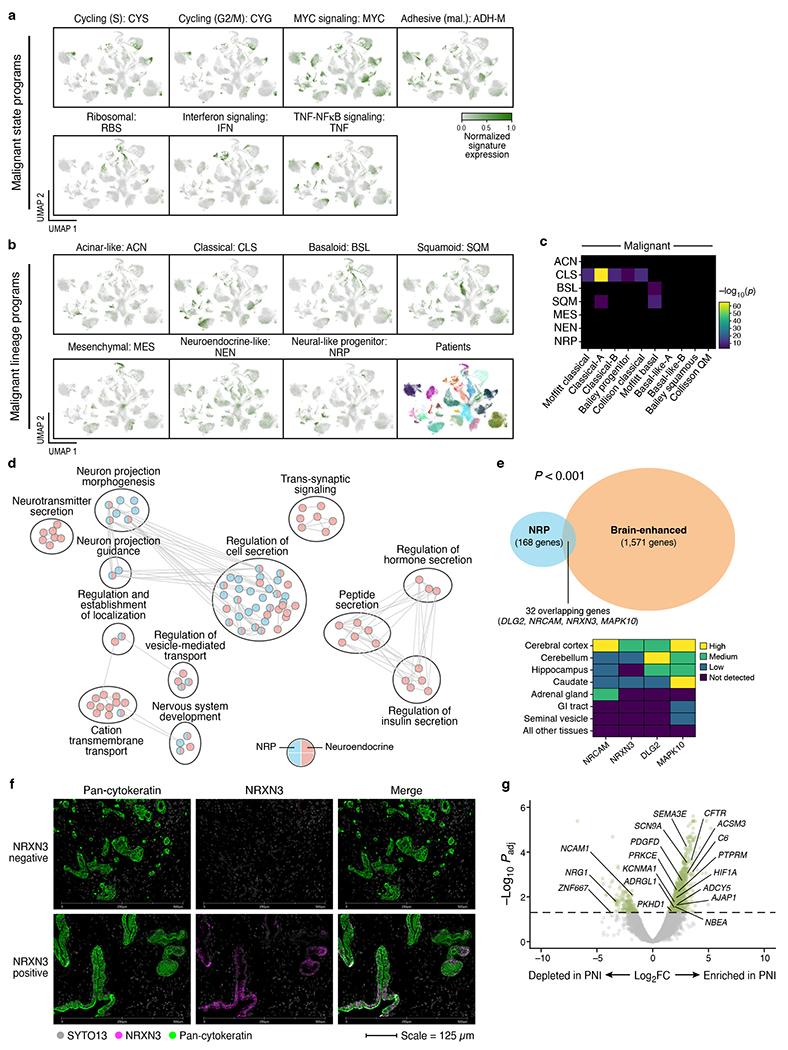
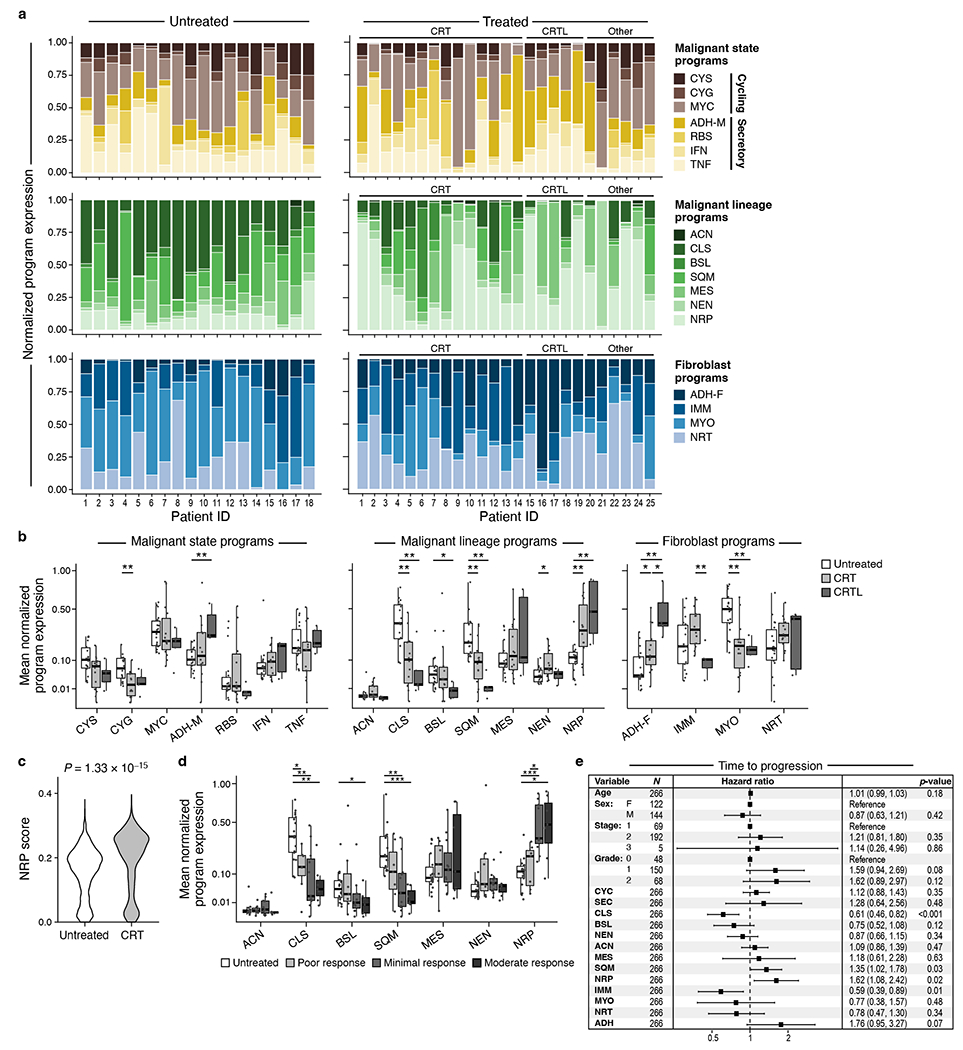
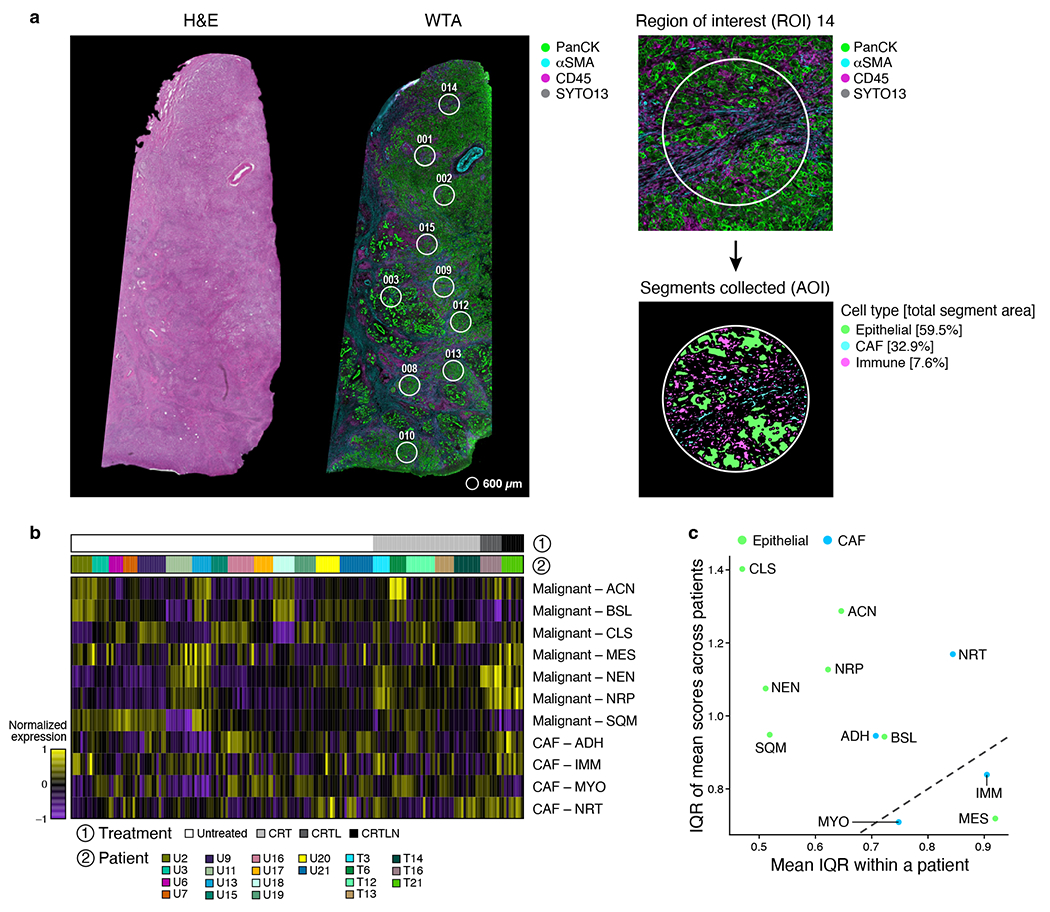
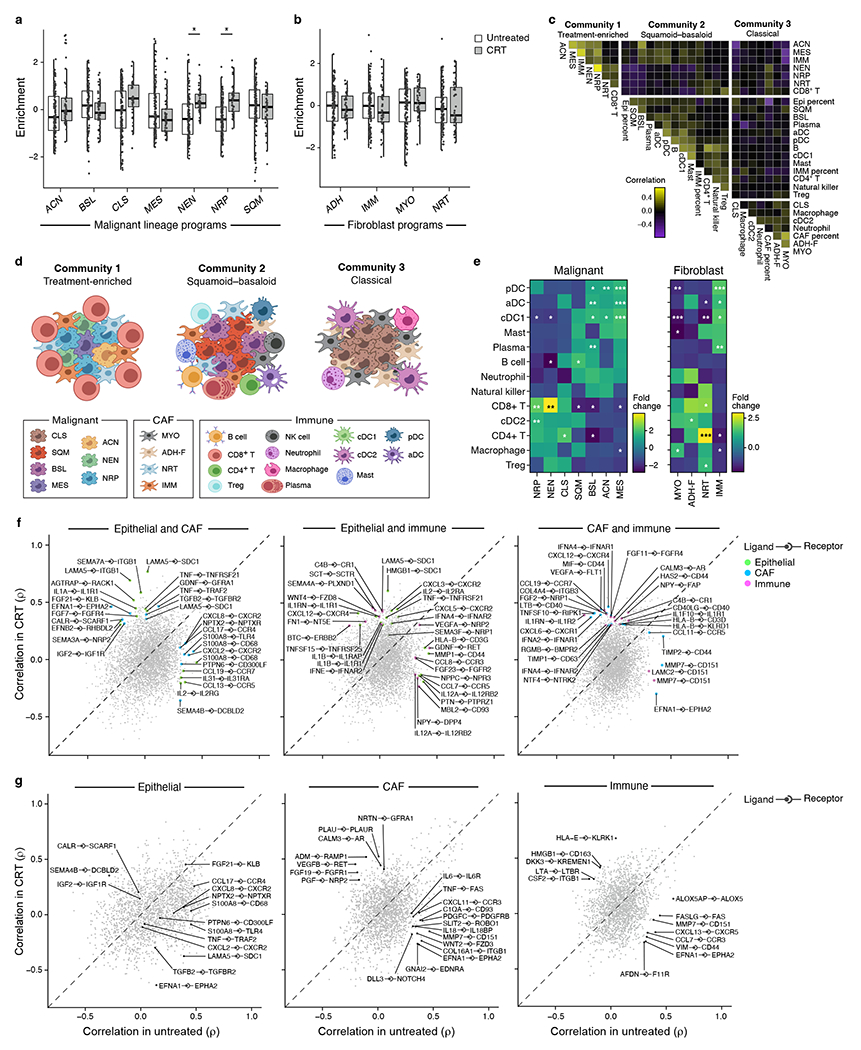
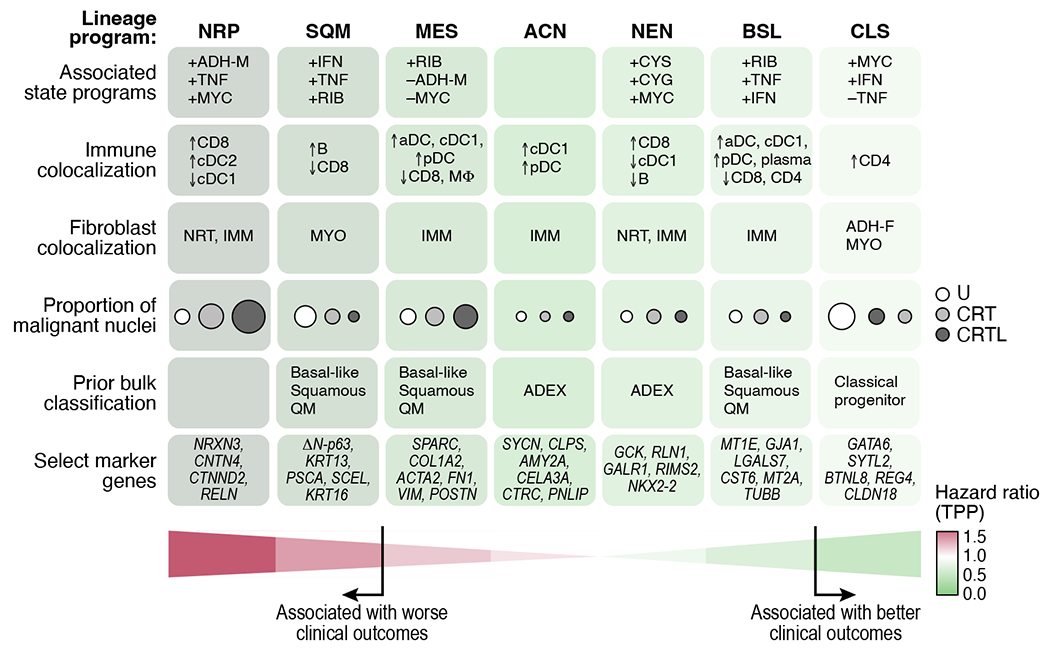
Pancreatic ductal adenocarcinoma (PDAC) is a highly lethal and treatment-refractory cancer. Molecular stratification in pancreatic cancer remains rudimentary and does not yet inform clinical management or therapeutic development. Here, we construct a high-resolution molecular landscape of the cellular subtypes and spatial communities that compose PDAC using single-nucleus RNA sequencing and whole-transcriptome digital spatial profiling (DSP) of 43 primary PDAC tumor specimens that either received neoadjuvant therapy or were treatment naive. We uncovered recurrent expression programs across malignant cells and fibroblasts, including a newly identified neural-like progenitor malignant cell program that was enriched after chemotherapy and radiotherapy and associated with poor prognosis in independent cohorts. Integrating spatial and cellular profiles revealed three multicellular communities with distinct contributions from malignant, fibroblast and immune subtypes: classical, squamoid-basaloid and treatment enriched. Our refined molecular and cellular taxonomy can provide a framework for stratification in clinical trials and serve as a roadmap for therapeutic targeting of specific cellular phenotypes and multicellular interactions.


Conflict of interest statement

A.R. is a co-founder and equity holder of Celsius Therapeutics, an equity holder in Immunitas, and was an SAB member of ThermoFisher Scientific, Syros Pharmaceuticals, Neogene Therapeutics and Asimov. From August 1, 2020, A.R. is an employee of Genentech. T.J. is a member of the Board of Directors of Amgen and Thermo Fisher Scientific, and a co-Founder of Dragonfly Therapeutics and T2 Biosystems. T.J. serves on the Scientific Advisory Board of Dragonfly Therapeutics, SQZ Biotech, and Skyhawk Therapeutics. Dr. Jacks’ laboratory also currently receives funding from Johnson & Johnson, but this fund did not support the research described in this manuscript. D.T.T. has received consulting fees from Nanostring Technologies, which was used in this work. D.T.T. has received consulting fees from ROME Therapeutics, Foundation Medicine, Inc., EMD Millipore Sigma, and Pfizer that are not related to this work. D.T.T. is a founder and has equity in ROME Therapeutics, PanTher Therapeutics and TellBio, Inc., which is not related to this work. D.T.T. receives research support from ACD-Biotechne, PureTech Health LLC, Ribon Therapeutics, which was not used in this work. M.M.K. has served as a compensated consultant for H3 Biomedicine and AstraZeneca and received a research grant (to institution) from Novartis that is not related to this work. R.K.J. received consultant fees from Elpis, Pfizer, SPARC, SynDevRx; owns equity in Accurius, Enlight, SynDevRx; serves on the Board of Trustees of Tekla Healthcare Investors, Tekla Life Sciences Investors, Tekla World Healthcare Fund and received a Research Grant from Boehringer Ingelheim all not related to this work. The interests of D.T.T., M.M.K., and R.K.J. were reviewed and are managed by Massachusetts General Hospital and Mass General Brigham in accordance with their conflict of interest policies. O.R.R. is a co-inventor on patent applications filed by the Broad Institute for inventions related to single cell genomics. ORR is an employee of Genentech since October 19, 2020. W.L.H., K.A.J., J.A.G., H.I.H., T.J., and A.R. are co-inventors on U.S. Provisional Patent Application No. 63/313,596 related to this work. All other authors declare no competing interests.

Figures

Extended Data Fig. 1 |
Extended Data Fig. 1 |. Cell type and inferred CAN composition across PDAC tumors.
a, UMAP embeddings of single nucleus profiles (dots) from individual tumors (panels) from untreated (left) and treated (right) patients colored by post hoc cell type annotations (color legend). b, Example inferCNV analysis of the epithelial subset from a study specimen. Inferred amplifications (red) and deletions (blue) based on expression (color bar) of sliding 100-gene window in each chromosomal locus (columns) from each cell (rows) labeled by its annotated cell type (color code). c, Inferred CNA frequencies in the snRNA-seq cohort have similar distribution as those derived from TCGA genomic study. Frequency (y axis) of CNAs on each chromosome arm (x axis) as inferred across the patients in the snRNA-seq cohort (light green bars) and from genome analysis of PDAC (dark green bars) from the TCGA cohort. d, Proportion of cells (y axis) in each of the four major compartments (color legend, top) or immune cell subsets (color legend, bottom) as estimated by snRNA-seq or MIBI (x axis) in each matched untreated (left; n = 5) or treated (right; n = 2) tumor.
Extended Data Fig. 2 |
Extended Data Fig. 2 |. Treatment associated with distinct cell type proportions across compartments.
Proportions (y axis) of cell types (x axis) in untreated (n = 18), CRT (n = 14), or CRTL (n = 5) tumors out of all non-malignant cells (top left) or in specific non-malignant cell compartments in the tumor. The boxes indicate upper and lower quartiles, with the horizontal lines marking the means. The lines extending vertically from the boxes (whiskers) indicate the maximum and minimum values excluding outliers. Data points are plotted as circles. * Bonferroni adjusted p < 0.05, ** p < 0.01, *** p < 0.001, two-sided Mann-Whitney U test with Bonferroni correction. Exact p-values for significant comparisons were non-malignant myeloid CRT-CRTL = 0.016344, epithelial (non-malignant) ductal CRT-CRTL = 0.031683, lymphoid Treg untreated-CRT = 0.033156, immune CD8+ T CRT-CRTL = 0.03507, immune Treg untreated-CRT = 0.022686.
Extended Data Fig. 3 |
Extended Data Fig. 3 |. Impact of treatment on differential gene expression in immune cells, malignant cells, and cancer-associated fibroblasts.
a, Differential expression (β-value, x axis, Poisson mixed-effect linear regression model, lme4 R package) and its significance (−log10(adjusted p-value), y axis) for CD8+ T cells (top row), dendritic cells (second row), Tregs (third row) and macrophages (bottom row, color legend) in CRT vs. untreated (left), CRTL vs. untreated (middle), and CRTL vs. CRT (right) tumors. Selected enriched or depleted genes are labeled. Bonferroni adjusted p-value < 0.05 is indicated with a dotted horizontal line. b, Differential expression (β-value, x axis, Poisson mixed-effect linear regression model, lme4 R package) and its significance (−log10(adjusted p-value), y axis) for malignant cells (top row) and CAFs (bottom row, color legend) in CRT vs. untreated (left), CRTL vs. untreated (middle), and CRTL vs. CRT (right) tumors. Selected enriched or depleted genes are labeled. Bonferroni adjusted p-value < 0.05 is indicated with a dotted horizontal line.
Extended Data Fig. 4 |
Extended Data Fig. 4 |. Prior signatures derived primarily from the bulk setting insufficiently delineate cells from snRNA-seq.
a, Malignant cell signatures. UMAP embeddings of single nucleus profiles (dots) from all tumor nuclei (top panels) or only malignant cells (bottom panels) colored by expression score (color bar, Methods) of signatures derived from the Bailey, Collisson, Moffitt, and Chan-Seng-Yue studies. b, CAF signatures. UMAP embeddings of single nucleus profiles (dots) from all fibroblast nuclei colored by normalized expression score (color bar, Methods) of myCAF, apCAF, and iCAF signatures and well as cross-tissue fibroblast lineage signatures (COL3A1+ myofibroblast, LRRC15+ myofibroblast, CCL19+ colitis, ADAMDEC1+ colitis, NPNT+ alveolar, and PI16+ adventitial).
Extended Data Fig. 5 |
Extended Data Fig. 5 |. Stability and power in selection of programs in consensus NMF.
a, Estimated stability (blue, left y axis) and error (red, right y axis) in the cNMF solution learned with different numbers of programs (k, x axis) for malignant cells (left) and CAFs (right). b, Number of malignant (out of 14; left) and CAF (out of 4; right) programs recovered in the cNMF solution learned with a different proportion of samples (x axis) subsampled from our cohort.
Extended Data Fig. 6 |
Extended Data Fig. 6 |. Correlation among malignant cell or CAF expression programs.
Correlation (color bar) among expression scores of malignant state and lineage programs across all malignant nuclei (a) or fibroblast programs across all fibroblast nuclei (b).
Extended Data Fig. 7 |
Extended Data Fig. 7 |. Enrichment of malignant cell and CAF programs in genes differentially expressed with treatment regimen.
Fold enrichment of overlap (x axis) between gene program signatures (top 200 genes; rows) and genes differentially expressed (q < 0.05) in CRT (n = 14) vs. untreated (n = 18) (left), CRTL (n = 5) vs. untreated (middle), or CRTL vs. CRT (right). * Bonferroni adjusted p < 0.05, two-sided hypergeometric test. Exact p-values for significant comparisons were untreated-CRT: CYS-untreated = 8.54x10⁻⁶, CYS-CRT = 7.36x10⁻⁴, CYG-untreated = 9.53x10⁻⁷, CYG-CRT = 5.96x10⁻⁴, MYC-CRT = 3.72x10⁻², ADH-M-CRT = 2.95x10⁻², RBS-untreated = 2.25x10⁻², TNF-CRT = 5.61x10⁻³, ACN-untreated = 2.87x10⁻², ACN-CRT = 1.51x10⁻⁶, CLS-untreated = 4.77x10⁻⁵, CLS-CRT = 3.72x10⁻², BSL-untreated = 2.44x10⁻², BSL-CRT = 2.65x10⁻⁵, SQM-CRT = 5.10x10⁻³, MES-untreated = 2.16x10⁻³, MES-CRT = 1.09x10⁻⁴, NEN-untreated = 4.83x10⁻³, NRP-untreated = 2.58x10⁻³, NRP-CRT = 6.06x10⁻¹⁰, ADH-F-untreated = 1.03x10⁻⁸, ADH-F-CRT = 3.68x10−43, IMM-untreated = 6.12x10⁻⁶, IMM-CRT = 5.24x10⁻⁸, MYO-untreated = 3.66x10−72, MYO-CRT = 5.60x10⁻⁴, NRT-untreated = 4.56x10⁻⁴, NRT-CRT = 5.60x10⁻⁷; untreated-CRTL: CYS-untreated = 9.45x10⁻¹⁹, CYS-CRT = 4.91x10⁻³, CYG-untreated = 1.04x10⁻¹³, ADH-M-CRT = 1.10x10⁻²¹, RBS-untreated = 7.60x10⁻³, RBS-CRT = 4.91x10⁻³, IFN-CRT = 4.49x10⁻², ACN-untreated = 9.62x10⁻³, ACN-CRT = 4.14x10⁻⁶, SQM-untreated = 2.65x10⁻¹⁶, MES-CRT = 9.59x10⁻⁶, NEN-untreated = 1.43x10⁻², NRP-untreated = 6.79x10⁻³, NRP-CRT = 2.74x10⁻²⁰, ADH-F-untreated = 7.60x10⁻²¹, ADH-F-CRT = 1.54x10−151, IMM-untreated = 2.58x10⁻⁹, MYO-untreated = 4.80x10⁻⁶, MYO-CRT = 2.09x10⁻⁵, NRT-untreated = 2.57x10⁻¹⁰; CRT-CRTL: MYC-CRT = 3.07x10⁻², ADH-M-CRTL = 4.17x10⁻⁸, IFN-CRTL = 1.99x10⁻², ADH-F-CRT = 7.16x10⁻⁷, ADH-F-CRTL = 5.88x10−60, IMM-CRTL = 2.56x10⁻².
Extended Data Fig. 8 |
Extended Data Fig. 8 |. Multivariable Cox regression analysis for overall survival in TCGA and PanCuRx/ICGC PDAC cohorts.
Hazard ratios ± 95% confidence interval (middle) and p-values (left) for each variable (clinicopathologic and program expression score in bulk RNA-seq, rows) in multivariable Cox regression model for overall survival (OS), based on a cohort of 269 patients with untreated, resected primary PDAC profiled by RNA-seq in TCGA and PanCuRx/ICGC.
Extended Data Fig. 9 |
Extended Data Fig. 9 |. Digital spatial profiling with whole transcriptome atlas (WTA) enables accurate mapping of cell type signatures in space as a complement to snRNA-seq.
a, Immunofluorescence images of FFPE sections from all PDAC specimens analyzed using whole transcriptome DSP (n = 21 independent tumors) separated by treatment status (top, untreated; bottom, treated). Color legend indicates target of fluorophore-conjugated antibodies. b, Expression (z-score of normalized counts across segments; purple/yellow color bar) of signature genes (rows) from different cell types (color legend 3 and left color bar 3) across segments (columns, color legend 2 and horizontal color bar 2) and treatment regimens (columns, grayscale legend 1 and horizontal grayscale bar 1) profiled by WTA, capturing epithelial (green), fibroblasts (blue) and immune (red) cells. Columns and rows are clustered by unsupervised hierarchical clustering. c, Pearson correlation coefficient (color bar) of the scores of each CAF, malignant, and immune feature in snRNA-seq (rows, columns) across patient tumors. Rows and columns are ordered by hierarchical clustering.
Extended Data Fig. 10 |
Extended Data Fig. 10 |. snRNA-seq captures a greater diversity and abundance of cell types relative to prior single-cell approaches.
Number of nuclei/cells per untreated tumor that passed quality control filters (y axis) in our study (n = 18) vs. Peng et al. study (n = 24) (grayscale legend), in total (left) and partitioned by cell type (right). The boxes indicate upper and lower quartiles, with the horizontal lines marking the means. The lines extending vertically from the boxes (whiskers) indicate the maximum and minimum values excluding outliers. Data points are plotted as solid circles. *Bonferroni adjusted p < 0.05, ** p < 0.01, *** p < 0.001, **** p < 0.0001, two-sided Mann-Whitney U test with Bonferroni correction. Exact p-values for significant comparisons were all cell types = 5.76 x 10⁻⁹, lymphoid = 5.54 x 10⁻⁵, myeloid = 7.25 x 10⁻³, CAF = 3.70 x 10⁻³, pericyte = 5.22 x 10⁻¹¹, vascular smooth muscle = 1.09 x 10⁻⁹, endocrine = 1.84 x 10⁻², endothelial = 4.00 x 10⁻².
Figure 1 |
Figure 1 |. Single-nucleus RNA-seq of untreated and treated PDAC captures representative diversity of cell types.
a, Experimental workflow of human PDAC tumors for snRNA-seq, Multiplex Ion Beam Imaging (MIBI), and digital spatial profiling (DSP; NanoString GeoMx). Three patient tumors were analyzed by DSP and not snRNA-seq and two specimens profiled by snRNA-seq were non-malignant pancreatic tissue. b, snRNA-seq captures diverse malignant, epithelial, immune and other stromal cell subsets. Mean normalized expression (color bar) of selected marker genes (columns) across annotated cell subsets (rows) of different compartments (labels, left). c, Distinctions between patients or treatment status. UMAP embedding of single nucleus profiles (dots) of PDAC tumors colored by patient ID (color legend, left) or treatment status (right). d, Cell subsets in each compartment. UMAP embeddings of single nucleus profiles of all cells (left, as in c) or in each compartment (right panels) colored by post hoc cell type annotations (color legend, shared with e). e, Cell type distributions across tumors. Proportions (y axis) of cell subsets (color legend, shared with d) across untreated (n=18) (left) vs. treated (n=25) tumors (right) either with (left) or without (right) malignant cells. Treated patients are further classified by specific treatment type. f, snRNA-seq captures representative cell types distributions compared to in situ assessment. Left: Representative MIBI images and segmentation showing staining with antibodies against cytokeratin (green), vimentin (blue), CD45 (red), CD31 (purple) and double-stranded DNA (gray). Right: Proportion of cells (y axis) in each of the four major compartments (left subpanel, color legend) or in each of the immune subsets (right subpanel, color legend) as estimated by snRNA-seq or MIBI (x axis) in aggregate across all untreated (two left bars; n=5) or treated (two right bars; n=2) tumors. g, Remodeling of tumor composition by treatment. For the untreated, CRT, and CRTL groups, there were n=18, 14, and 5 biologically independent tumor specimens, respectively. Proportions (y axis) of each cell subset (x-axis) among all nuclei. Pairwise comparisons were performed using the two-sided Mann-Whitney U test (* Bonferroni adjusted p < 0.05; ** p < 0.01; *** p < 0.001).
Figure 2 |
Figure 2 |. Epithelial cell type composition and inferred pseudotemporal trajectory includes putative acinar-ductal metaplasia and atypical ductal intermediates.
a,b, Inferred differentiation states in pre-malignant and malignant cells. a, Proportion of cells (dot size) with non-zero expression of gene set HALLMARK_KRAS_SIGNALING_UP in each epithelial cell subset and normalized mean expression (dot color) in expressing cells. b, Partition-based graph abstraction (PAGA) of an inferred pseudotemporal trajectory among epithelial cell subsets (nodes) connected by edges with numerical weights (line thickness). c, UMAP embeddings of single nucleus profiles (dots) for different epithelial cell subsets (panels) colored by patient ID (color legend). d, Left: proportions (y axis) of cells in each tumor (color legend) for each epithelial cell subset (x axis); Right: proportions (y axis) of epithelial cell subsets (color legend) for each tumor (x axis). e, Proportions (y axis) of epithelial cell subsets (color legend) summed across all tumors for each treatment category (x axis).
Figure 3 |
Figure 3 |. Molecular stratification of malignant cells in PDAC reveals a neural-like progenitor program that is enriched in genes associated with the nervous system and perineural invasion.
a-b, Expression programs in malignant cells based on consensus non-negative matrix factorization (cNMF). UMAPs of single nucleus profiles (dots) of malignant cells (a, state programs; b, lineage programs) from all tumors, colored by patient (b bottom right subpanel) or by the normalized expression score of each program (Methods). c, Similarity of de novo cNMF annotated programs (labels, rows) compared to prior malignant signatures (labels, columns)–,. Statistical significance of overlap (−log10(p-value), two-sided hypergeometric test, color bar) for each pair of de novo cNMF annotated program and prior signature with significant overlap based on Bonferroni adjusted p-value < 0.05. Pairs with non-significant overlap are shown in black. d, Distinctions between the neural-like progenitor and neuroendocrine-like programs. Overlap of each gene set (colored pie charts) with the neural-like progenitor (blue) and neuroendocrine-like (red) programs. Circles (black outlines) encompass clusters of related gene sets. Edges represent overlaps between distinct gene sets based on an overlap coefficient threshold (>0.85, Cytoscape). e, The neural-like progenitor program includes ‘brain tissue enhanced’ genes from the Human Protein Atlas (HPA). Left: Overlap between the program (blue) and HPA brain enhanced (orange) genes (p=1.29x10⁻⁴; two-sided hypergeometric). Right: HPA expression categories (color code) for select genes (columns) across brain regions (rows). f, Representative multiplexed immunofluorescence images of untreated PDAC (n=3 independent tumors) showing absence of NRXN3 expression (top) and heterogeneous NRXN3 expression (bottom) in malignant cells/glands from two separate regions of the same tumor. Color legend indicates target of fluorophore-conjugated antibodies. g, Differential expression (log2(fold-change), x axis) and its significance (−log10(adjusted p-value), y axis, DESeq2) of TCGA PDAC patients with (right; n=134) and without (left; n=25) perineural invasion (PNI). P-values were adjusted for the false discovery rate using a Benjamini-Hochberg correction. The dashed horizontal line corresponds to Padj=0.05. Labeled genes are present in the neural-like progenitor program signature.
Figure 4 |
Figure 4 |. Molecular stratification of cancer-associated fibroblasts in PDAC.
a, Expression programs in CAFs based on cNMF. UMAPs of single nucleus profiles (dots) of CAFs from all tumors, colored by patient (bottom left subpanel) or by the normalized expression of each program (Methods). b, Similarity of de novo cNMF annotated programs (labels, rows) compared to prior fibroblast signatures (labels, columns),.
Figure 5 |
Figure 5 |. The neural-like progenitor program is enriched in residual tumor and patient-derived organoids after cytotoxic therapy and is associated with poor clinical outcomes.
a, Intra-tumoral and inter-tumoral heterogeneity of malignant and fibroblast expression programs. Normalized expression scores (y axis) of malignant state (top), malignant lineage (middle) and CAF (bottom) programs (color legend) in each untreated (n=18, left) or treated (n=25, right) tumor (x axis). Treated patients are further ordered by treatment regimen. b, Malignant cell and CAF programs associated with treatment status. Mean normalized program expression (y axis) of malignant cell state (top), malignant cell lineage (middle), and CAF (bottom) programs (x axis) in untreated (n = 18), CRT (n=14), and CRTL (n=5) tumors. * Bonferroni adjusted p < 0.05, ** p < 0.01, *** p < 0.001, **** p < 0.0001, two-sided Mann-Whitney U test with Bonferroni correction. c, The neural-like progenitor program increases in organoids following CRT treatment. Distribution of mean expression of the top 200 cNMF-weighted genes from the neural-like progenitor program (y axis) across individual cells from matched untreated and CRT-treated organoids (x axis) derived from patient PDAC_U_12 (p=1.33x10⁻¹⁵, two-sided Mann-Whitney; untreated=2607 cells; CRT=341 cells). d, Expression of malignant lineage programs in residual neoplastic cells varies by patients’ treatment response. Distribution of mean normalized expression scores in each tumor (y axis) for each pathological treatment response grade (grayscale legend; untreated: n=18, poor: n=7, minimal: n=11, moderate: n=7) for each malignant lineage program (x axis) regardless of treatment group. * Bonferroni adjusted p < 0.05, ** p < 0.01, *** p < 0.001, **** p < 0.0001, two-sided Mann-Whitney U test with Bonferroni correction. e, Program expression and clinicopathologic parameters associated with time to disease progression using multivariable Cox regression analysis of bulk RNA-seq data from two independent cohorts of untreated, resected primary PDAC (TCGA and PanCuRx/ICGC; n=266). Data are presented as hazard ratio (HR) ± 95% confidence interval. Malignant lineage: NRP=neural-like progenitor, SQM=squamoid, MES=mesenchymal, ACN=acinar-like, NEN=neuroendocrine-like, BSL=basaloid, CLS=classical. Malignant state (aggregate): CYC=cycling, SEC=secretory. Fibroblast: IMM=immunomodulatory, NRT=neurotropic, ADH-F=adhesive, MYO=myofibroblastic progenitor.
Figure 6 |
Figure 6 |. Spatial mapping of malignant and CAF programs reveals program-specific associations with intra- versus inter-tumor heterogeneity.
a, Whole Transcriptome Digital Spatial Profiling (WTA DSP). Left: Representative hematoxylin and eosin (H&E)-stained FFPE sections (5 μm thickness, left) and immunofluorescence image (GeoMx DSP, right) of consecutive sections from the same tumor FFPE block, showing selected regions of interest (ROIs, circles). WTA DSP was performed on 21 independent human PDAC tumors. Gray=SYTO13 (nuclear stain), green=anti-panCK, magenta=anti-CD45, cyan=anti-αSMA. Right: Example ROI (circle, 600 μm diameter) with segmentation masks used to enrich for the epithelial, CAF, and immune compartments and percent of total segment area occupied by each compartment. b,c, Higher variation across tumors than within tumor ROIs. b, Normalized expression (color scale) of malignant cell (top rows) and fibroblast (bottom rows) programs in each AOI (columns) across patients (color bar 2, color legend) and treatment status (grayscale bar 1 and color legend). c, Program expression variation between patients (y axis, interquartile range/IQR of the mean program score for each tumor) and within patients (x axis, mean of IQR across all ROIs within a tumor). Dotted line x=y.
Figure 7 |
Figure 7 |. Spatial analysis of malignant programs, CAF programs and immune cell composition reveals three distinct multicellular communities and treatment-associated receptor-ligand interactions.
a,b, Digital spatial profiling shows enrichment of neural-like progenitor and neuroendocrine-like program after neoadjuvant CRT. Distribution of z-score normalized ssGSEA enrichment scores (y axis) of malignant (a) and fibroblast (b) programs (x axis) in AOIs from CRT (gray; n=5) and untreated (white; n=14) tumors. Box depicts interquartile range (IQR) with median marked as horizontal line. The whiskers correspond to 1.5 x IQR. * p < 0.05, mixed-effects model (Methods). c,d, Three multicellular communities with distinct malignant, CAF, and immune features. c, Pearson correlation coefficient (color bar) of the scores/proportions of each malignant, CAF, and immune feature (rows, columns) across ROIs. Rows and columns are ordered by hierarchical clustering. d, Schematic of key features of each multicellular community as defined in c. Malignant lineage: NRP=neural-like progenitor, SQM=squamoid, MES=mesenchymal, ACN=acinar-like, NEN=neuroendocrine-like, BSL=basaloid, CLS=classical. Fibroblast: IMM=immunomodulatory, NRT=neurotropic, ADH-F=adhesive, MYO=myofibroblastic progenitor. Created with BioRender.com. e, Malignant and CAF programs associated with immune cell composition. Fold change (color bar) of inferred immune subset proportions (rows) between the top quartile scoring ROIs and the bottom quartile scoring ROIs for each malignant (columns; left) or fibroblast (columns; right) program. f,g, Spatially correlated receptor-ligand pairs across (f) and within (g) compartments. Spearman rank correlation coefficient of expression of receptor-ligand pairs (gray dots) across paired epithelial:CAF (f, left), epithelial:immune (f, middle), CAF:immune (f, right), epithelial:epithelial (g, left), CAF:CAF (g, middle), and immune:immune (g, right) segments within the same ROI across all ROIs in CRT-treated (y axis) or untreated (x axis) tumors. Selected receptor-ligand pairs that were differentially correlated in CRT-treated or untreated tumors are labeled and colored based on the segment expressing the ligand (f, color legend). Dotted line: x=y.
Figure 8 |
Figure 8 |. Refined molecular taxonomy of pancreatic ductal adenocarcinoma.
Cell intrinsic, clinical, and spatial associations for malignant lineage programs (columns). Malignant lineage: NRP=neural-like progenitor, SQM=squamoid, MES=mesenchymal, ACN=acinar-like, NEN=neuroendocrine-like, BSL=basaloid, CLS=classical. Malignant state: CYS=cycling (S), CYG=cycling (G2/M), MYC=MYC signaling, ADH-M=adhesive, RIB=ribosomal, IFN=interferon signaling, TNF=TNF-NFκB signaling. Fibroblast: IMM=immunomodulatory, NRT=neurotropic, ADH-F=adhesive, MYO=myofibroblastic progenitor.

References

    1. Versteijne E et al. Neoadjuvant Chemoradiotherapy Versus Upfront Surgery for Resectable and Borderline Resectable Pancreatic Cancer: Long-Term Results of the Dutch Randomized PREOPANC Trial. J. Clin. Oncol Online ahead of print (2022) doi:10.1200/jco.21.02233. - DOI - PubMed
    1. Mizrahi JD, Surana R, Valle JW & Schroff RT Pancreatic cancer. Lancet 395, 2008–2020 (2020). - PubMed
    1. Collisson EA, Bailey P, Chang DK & Biankin AV Molecular subtypes of pancreatic cancer. Nat. Rev. Gastroenterol. Hepatol 16, 207–220 (2019). - PubMed
    1. Guo JA et al. Refining the Molecular Framework for Pancreatic Cancer with Single-cell and Spatial Technologies. Clin. Cancer Res 27, 3825–3833 (2021). - PMC - PubMed
    1. Collisson EA et al. Subtypes of pancreatic ductal adenocarcinoma and their differing responses to therapy. Nat. Med 17, 500–503 (2011). - PMC - PubMed

Extended Data References

    1. Raphael BJ et al. Integrated Genomic Characterization of Pancreatic Ductal Adenocarcinoma. Cancer Cell 32, 185–203 (2017). - PMC - PubMed
    1. Bailey P et al. Genomic analyses identify molecular subtypes of pancreatic cancer. Nature 531, 47–52 (2016). - PubMed
    1. Collisson EA, Bailey P, Chang DK & Biankin AV Molecular subtypes of pancreatic cancer. Nat. Rev. Gastroenterol. Hepatol 16, 207–220 (2019). - PubMed
    1. Moffitt RA et al. Virtual microdissection identifies distinct tumor- and stroma-specific subtypes of pancreatic ductal adenocarcinoma. Nat. Genet 47, 1168–1178 (2015). - PMC - PubMed
    1. Chan-Seng-Yue M et al. Transcription phenotypes of pancreatic cancer are driven by genomic events during tumor evolution. Nat. Genet 52, 231–240 (2020). - PubMed

Publication types

MeSH terms

Substances