

Helicobacter pylori (H. pylori) risk factor analysis and prevalence prediction: a machine learning-based approach
- PMID: 35902812
- PMCID: PMC9330977
- DOI: 10.1186/s12879-022-07625-7
Helicobacter pylori (H. pylori) risk factor analysis and prevalence prediction: a machine learning-based approach
Abstract
Background: Although previous epidemiological studies have examined the potential risk factors that increase the likelihood of acquiring Helicobacter pylori infections, most of these analyses have utilized conventional statistical models, including logistic regression, and have not benefited from advanced machine learning techniques.
Objective: We examined H. pylori infection risk factors among school children using machine learning algorithms to identify important risk factors as well as to determine whether machine learning can be used to predict H. pylori infection status.
Methods: We applied feature selection and classification algorithms to data from a school-based cross-sectional survey in Ethiopia. The data set included 954 school children with 27 sociodemographic and lifestyle variables. We conducted five runs of tenfold cross-validation on the data. We combined the results of these runs for each combination of feature selection (e.g., Information Gain) and classification (e.g., Support Vector Machines) algorithms.
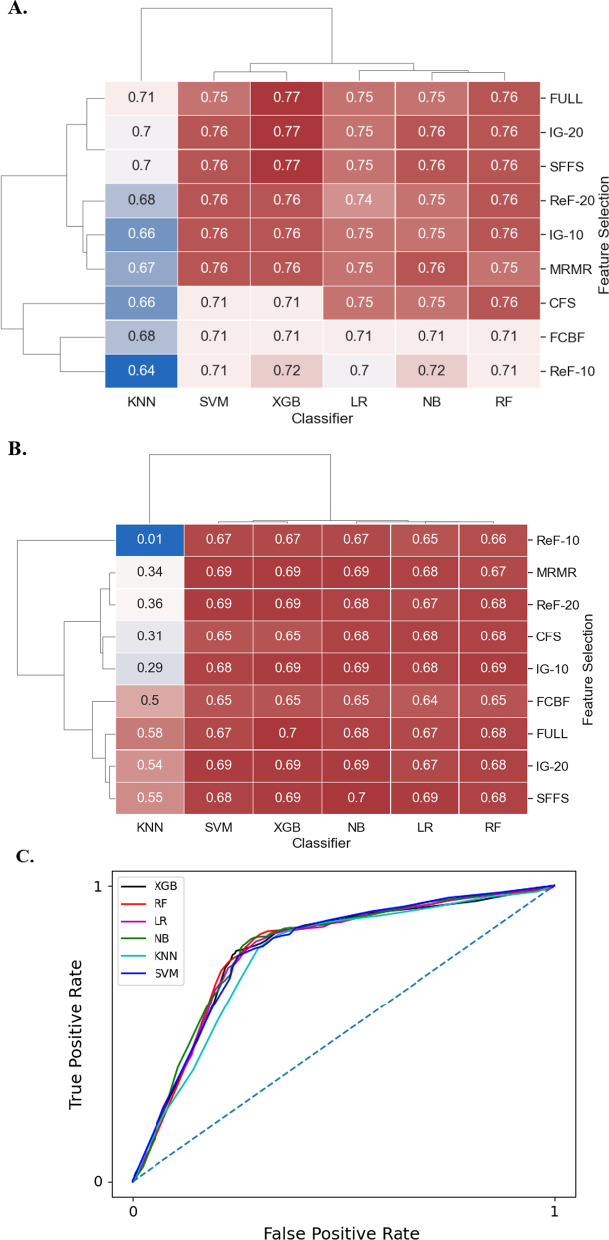
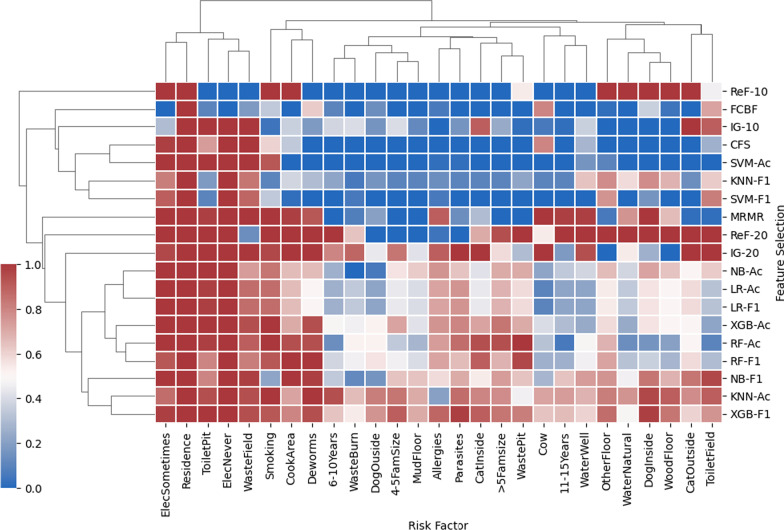
Results: The XGBoost classifier had the highest accuracy in predicting H. pylori infection status with an accuracy of 77%-a 13% improvement from the baseline accuracy of guessing the most frequent class (64% of the samples were H. Pylori negative.) K-Nearest Neighbors showed the worst performance across all classifiers. A similar performance was observed using the F1-score and area under the receiver operating curve (AUROC) classifier evaluation metrics. Among all features, place of residence (with urban residence increasing risk) was the most common risk factor for H. pylori infection, regardless of the feature selection method choice. Additionally, our machine learning algorithms identified other important risk factors for H. pylori infection, such as; electricity usage in the home, toilet type, and waste disposal location. Using a 75% cutoff for robustness, machine learning identified five of the eight significant features found by traditional multivariate logistic regression. However, when a lower robustness threshold is used, machine learning approaches identified more H. pylori risk factors than multivariate logistic regression and suggested risk factors not detected by logistic regression.
Conclusion: This study provides evidence that machine learning approaches are positioned to uncover H. pylori infection risk factors and predict H. pylori infection status. These approaches identify similar risk factors and predict infection with comparable accuracy to logistic regression, thus they could be used as an alternative method.
Keywords: Classification; Ethiopia; Feature selection; H. pylori infection; Logistic regression; Machine learning; School children.
© 2022. The Author(s).
Conflict of interest statement
We declare that we do not have any conflicts of interest.
Figures


References
-
- Miernyk KM, Bulkow LR, Gold BD, Bruce MG, Hurlburt DH, Griffin PM, et al. Prevalence of Helicobacter pylori among Alaskans: Factors associated with infection and comparison of urea breath test and anti-Helicobacter pylori IgG antibodies. Helicobacter. 2018;23(3):e12482. doi: 10.1111/hel.12482. - DOI - PMC - PubMed
-
- Eshraghian A. Epidemiology of Helicobacter pylori infection among the healthy population in Iran and countries of the Eastern Mediterranean Region: A systematic review of prevalence and risk factors. World J Gastroenterol. 2014;20(46):17618–17625. doi: 10.3748/wjg.v20.i46.17618. - DOI - PMC - PubMed
MeSH terms
LinkOut - more resources
Full Text Sources
Medical
