

Peroxisome Proliferator-Activated Receptor Activation in Precision-Cut Bovine Liver Slices Reveals Novel Putative PPAR Targets in Periparturient Dairy Cows
- PMID: 35903133
- PMCID: PMC9315222
- DOI: 10.3389/fvets.2022.931264
Peroxisome Proliferator-Activated Receptor Activation in Precision-Cut Bovine Liver Slices Reveals Novel Putative PPAR Targets in Periparturient Dairy Cows
Abstract
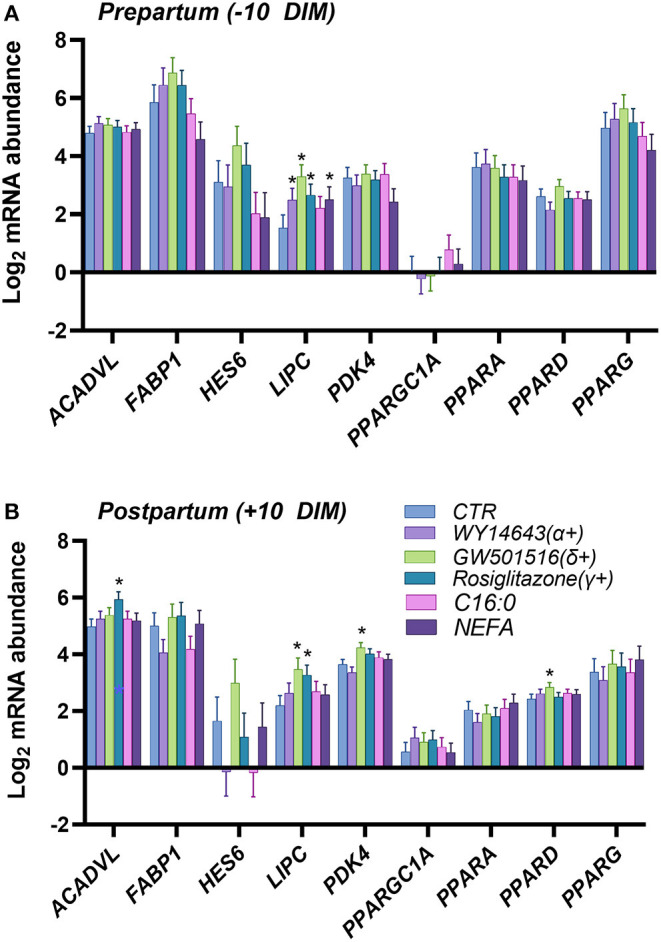
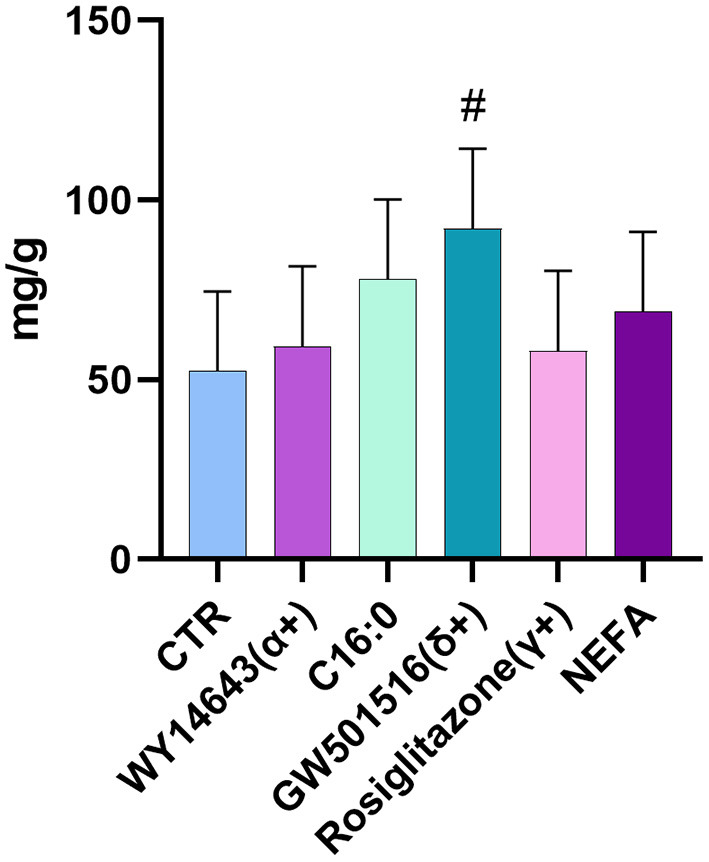
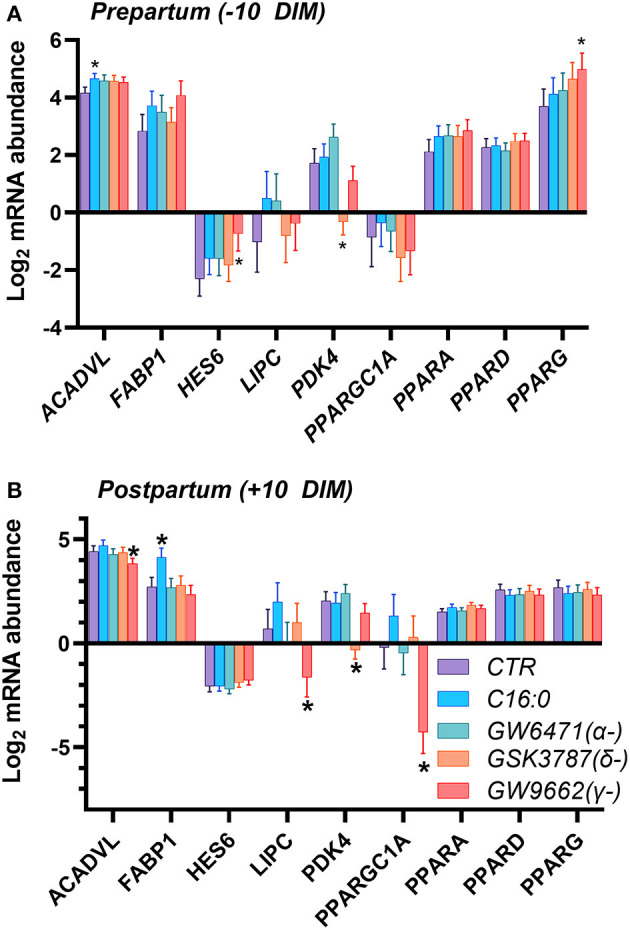
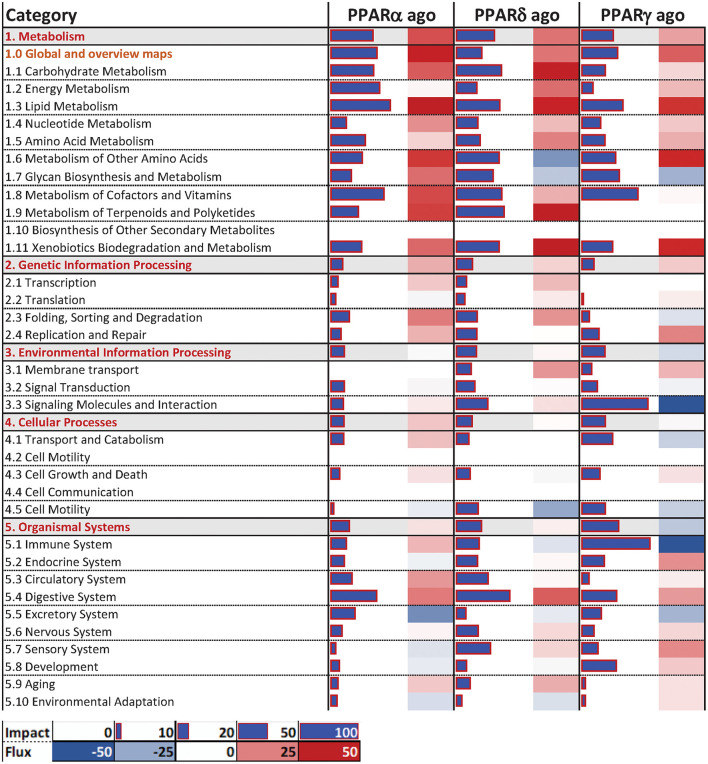
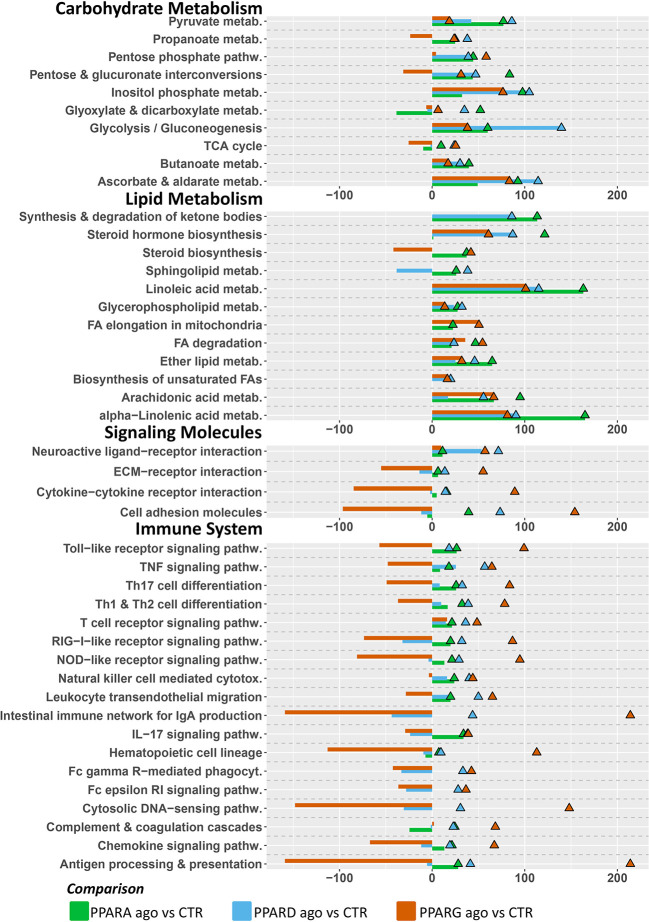
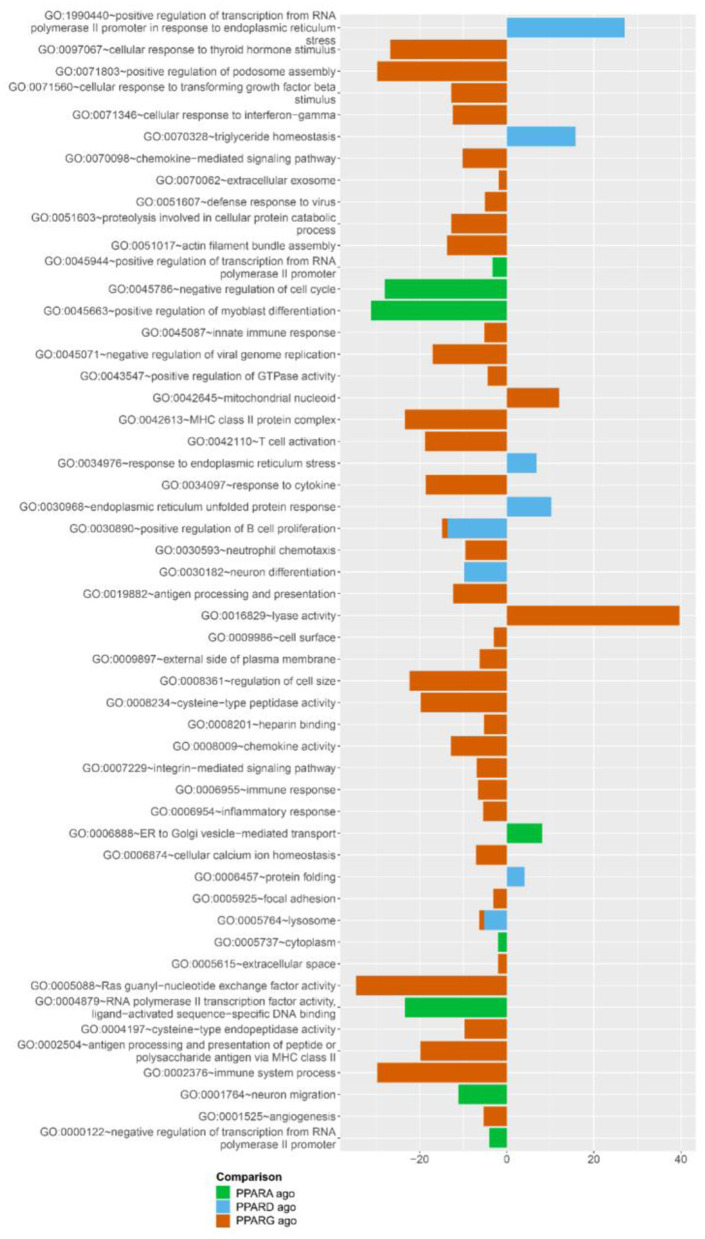
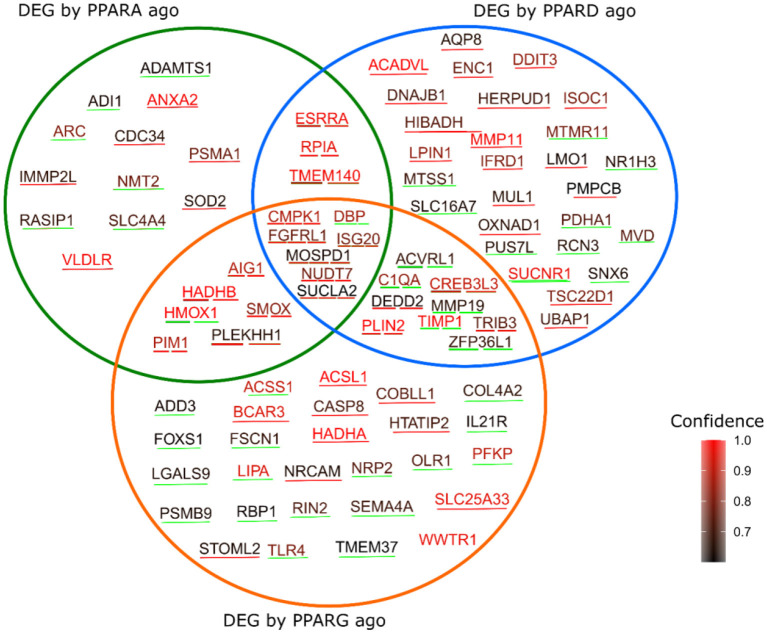
Metabolic challenges experienced by dairy cows during the transition between pregnancy and lactation (also known as peripartum), are of considerable interest from a nutrigenomic perspective. The mobilization of large amounts of non-esterified fatty acids (NEFA) leads to an increase in NEFA uptake in the liver, the excess of which can cause hepatic accumulation of lipids and ultimately fatty liver. Interestingly, peripartum NEFA activate the Peroxisome Proliferator-activated Receptor (PPAR), a transcriptional regulator with known nutrigenomic properties. The study of PPAR activation in the liver of periparturient dairy cows is thus crucial; however, current in vitro models of the bovine liver are inadequate, and the isolation of primary hepatocytes is time consuming, resource intensive, and prone to errors, with the resulting cells losing characteristic phenotypical traits within hours. The objective of the current study was to evaluate the use of precision-cut liver slices (PCLS) from liver biopsies as a model for PPAR activation in periparturient dairy cows. Three primiparous Jersey cows were enrolled in the experiment, and PCLS from each were prepared prepartum (-8.0 ± 3.6 DIM) and postpartum (+7.7± 1.2 DIM) and treated independently with a variety of PPAR agonists and antagonists: the PPARα agonist WY-14643 and antagonist GW-6471; the PPARδ agonist GW-50156 and antagonist GSK-3787; and the PPARγ agonist rosiglitazone and antagonist GW-9662. Gene expression was assayed through RT-qPCR and RNAseq, and intracellular triacylglycerol (TAG) concentration was measured. PCLS obtained from postpartum cows and treated with a PPARγ agonist displayed upregulation of ACADVL and LIPC while those treated with PPARδ agonist had increased expression of LIPC, PPARD, and PDK4. In PCLS from prepartum cows, transcription of LIPC was increased by all PPAR agonists and NEFA. TAG concentration tended to be larger in tissue slices treated with PPARδ agonist compared to CTR. Use of PPAR isotype-specific antagonists in PCLS cultivated in autologous blood serum failed to decrease expression of PPAR targets, except for PDK4, which was confirmed to be a PPARδ target. Transcriptome sequencing revealed considerable differences in response to PPAR agonists at a false discovery rate-adjusted p-value of 0.2, with the most notable effects exerted by the PPARδ and PPARγ agonists. Differentially expressed genes were mainly related to pathways involved with lipid metabolism and the immune response. Among differentially expressed genes, a subset of 91 genes were identified as novel putative PPAR targets in the bovine liver, by cross-referencing our results with a publicly available dataset of predicted PPAR target genes, and supplementing our findings with prior literature. Our results provide important insights on the use of PCLS as a model for assaying PPAR activation in the periparturient dairy cow.
Keywords: PCLS; PPAR; dairy cows; liver; nutrigenomics; peripartum.
Copyright © 2022 Busato, Ford, Abdelatty, Estill and Bionaz.
Conflict of interest statement
The authors declare that the research was conducted in the absence of any commercial or financial relationships that could be construed as a potential conflict of interest.
Figures
Similar articles
-
The interplay between non-esterified fatty acids and bovine peroxisome proliferator-activated receptors: results of an in vitro hybrid approach.J Anim Sci Biotechnol. 2020 Aug 11;11:91. doi: 10.1186/s40104-020-00481-y. eCollection 2020. J Anim Sci Biotechnol. 2020. PMID: 32793344 Free PMC article.
-
Effects of the peroxisome proliferator-activated receptor-alpha agonists clofibrate and fish oil on hepatic fatty acid metabolism in weaned dairy calves.J Dairy Sci. 2010 Jun;93(6):2404-18. doi: 10.3168/jds.2009-2716. J Dairy Sci. 2010. PMID: 20494149
-
Prepartum dietary energy intake alters adipose tissue transcriptome profiles during the periparturient period in Holstein dairy cows.J Anim Sci Biotechnol. 2020 Jan 3;11:1. doi: 10.1186/s40104-019-0409-7. eCollection 2020. J Anim Sci Biotechnol. 2020. PMID: 31908775 Free PMC article.
-
Novel approach to treat insulin resistance, type 2 diabetes, and the metabolic syndrome: simultaneous activation of PPARalpha, PPARgamma, and PPARdelta.Curr Diabetes Rev. 2005 Aug;1(3):299-307. doi: 10.2174/157339905774574365. Curr Diabetes Rev. 2005. PMID: 18220606 Review.
-
Relationship between overfeeding and overconditioning in the dry period and the problems of high producing dairy cows during the postparturient period.Vet Q. 1999 Jun;21(3):71-7. doi: 10.1080/01652176.1999.9694997. Vet Q. 1999. PMID: 10427630 Review.
Cited by
-
Recent developments and future directions in meta-analysis of differential gene expression in livestock RNA-Seq.Front Genet. 2022 Sep 19;13:983043. doi: 10.3389/fgene.2022.983043. eCollection 2022. Front Genet. 2022. PMID: 36199583 Free PMC article. Review.
-
The Experimental and In Silico-Based Evaluation of NRF2 Modulators, Sulforaphane and Brusatol, on the Transcriptome of Immortalized Bovine Mammary Alveolar Cells.Int J Mol Sci. 2024 Apr 12;25(8):4264. doi: 10.3390/ijms25084264. Int J Mol Sci. 2024. PMID: 38673850 Free PMC article.
-
Early life microbiota transplantation from highly feed-efficient broiler improved weight gain by reshaping the gut microbiota in laying chicken.Front Microbiol. 2022 Nov 18;13:1022783. doi: 10.3389/fmicb.2022.1022783. eCollection 2022. Front Microbiol. 2022. PMID: 36466637 Free PMC article.
-
RNA-Seq Reveals Pathways Responsible for Meat Quality Characteristic Differences between Two Yunnan Indigenous Chicken Breeds and Commercial Broilers.Foods. 2024 Jun 25;13(13):2008. doi: 10.3390/foods13132008. Foods. 2024. PMID: 38998514 Free PMC article.
-
Ewe early gestation supplementation with eicosapentaenoic and docosahexaenoic acids affects the liver, muscle, and adipose tissue fatty acid profile and liver mRNA expression in the offspring.J Anim Sci. 2023 Jan 3;101:skad144. doi: 10.1093/jas/skad144. J Anim Sci. 2023. PMID: 37158288 Free PMC article.
References
LinkOut - more resources
Full Text Sources
Molecular Biology Databases
Miscellaneous