. 2022 Jul 12:9:849363.
doi: 10.3389/fmolb.2022.849363. eCollection 2022.

Mapping CAR T-Cell Design Space Using Agent-Based Models

Affiliations

Mapping CAR T-Cell Design Space Using Agent-Based Models

Alexis N Prybutok et al. Front Mol Biosci. .

Abstract

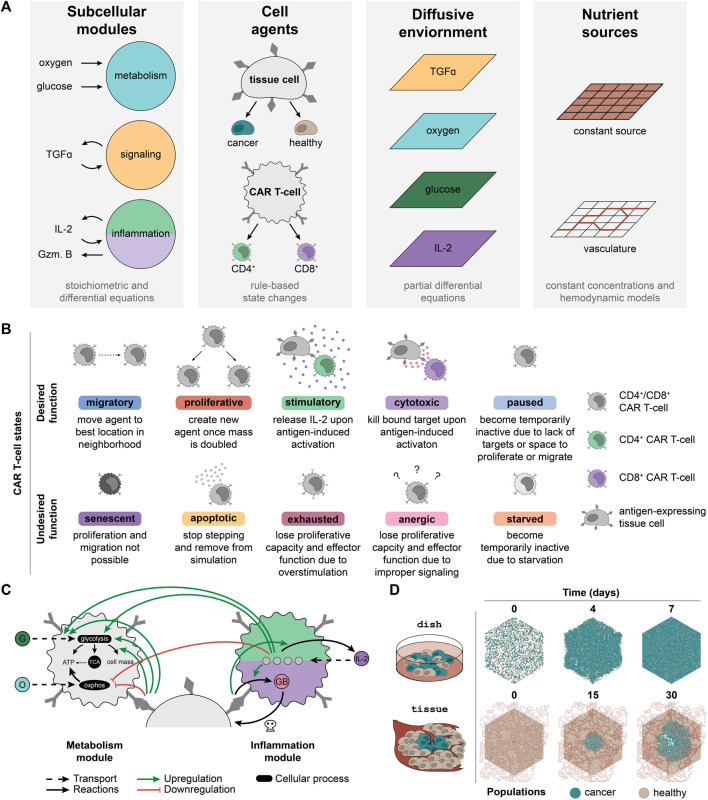
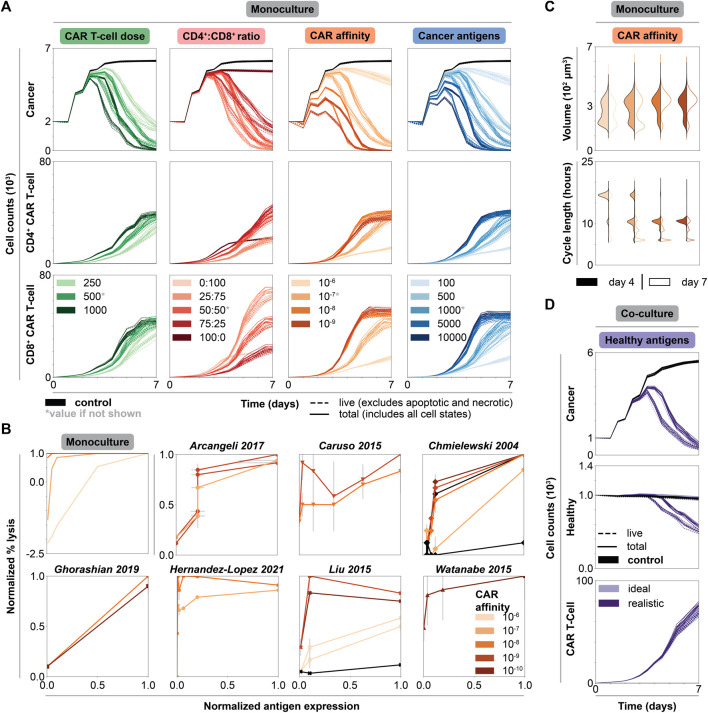
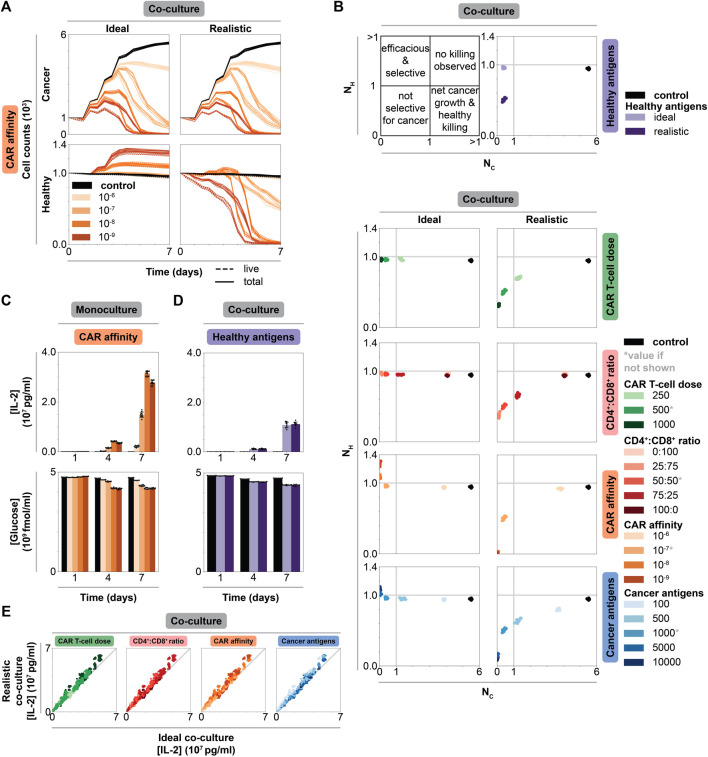
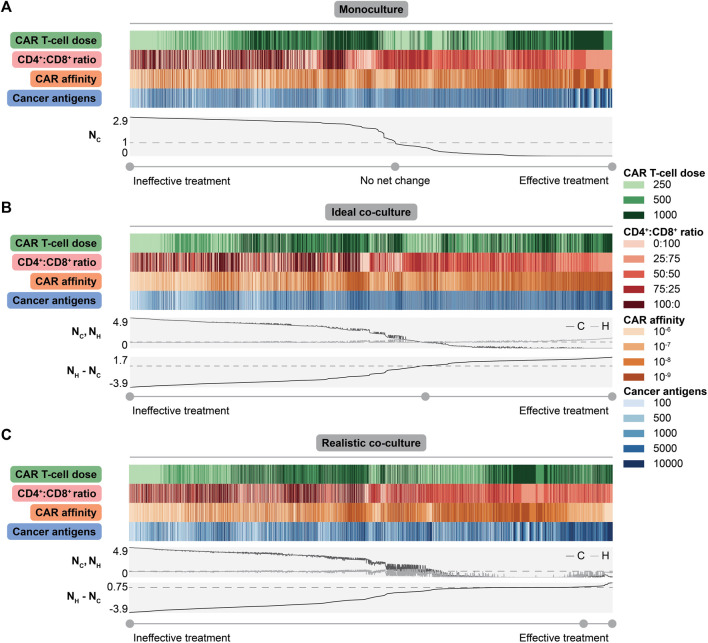
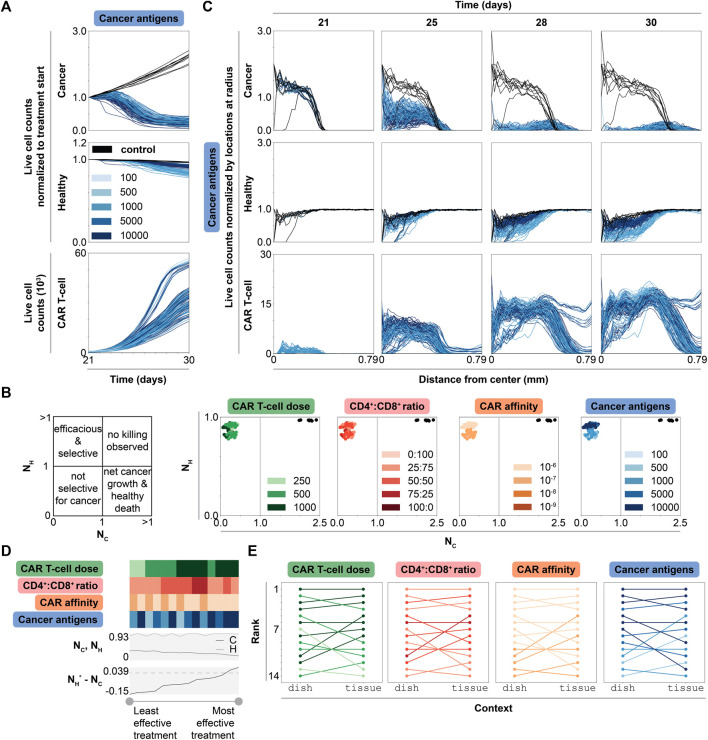
Chimeric antigen receptor (CAR) T-cell therapy shows promise for treating liquid cancers and increasingly for solid tumors as well. While potential design strategies exist to address translational challenges, including the lack of unique tumor antigens and the presence of an immunosuppressive tumor microenvironment, testing all possible design choices in vitro and in vivo is prohibitively expensive, time consuming, and laborious. To address this gap, we extended the modeling framework ARCADE (Agent-based Representation of Cells And Dynamic Environments) to include CAR T-cell agents (CAR T-cell ARCADE, or CARCADE). We conducted in silico experiments to investigate how clinically relevant design choices and inherent tumor features-CAR T-cell dose, CD4+:CD8+ CAR T-cell ratio, CAR-antigen affinity, cancer and healthy cell antigen expression-individually and collectively impact treatment outcomes. Our analysis revealed that tuning CAR affinity modulates IL-2 production by balancing CAR T-cell proliferation and effector function. It also identified a novel multi-feature tuned treatment strategy for balancing selectivity and efficacy and provided insights into how spatial effects can impact relative treatment performance in different contexts. CARCADE facilitates deeper biological understanding of treatment design and could ultimately enable identification of promising treatment strategies to accelerate solid tumor CAR T-cell design-build-test cycles.

Keywords: CAR T-cell; agent-based model; cell population dynamics; emergent dynamics; model-guided design; simulation.


Conflict of interest statement

The authors declare that the research was conducted in the absence of any commercial or financial relationships that could be construed as a potential conflict of interest.

Figures

FIGURE 1
FIGURE 1
CARCADE structure and CAR T-cell agent design. (A) Depiction of CARCADE components. Subcellular modules guide underlying cellular function to influence behavior (Gzm. B, granzyme B). Agents include tissue cell and CAR T-cell agents, each of which has separate rule sets and is depicted with surface ligands and CARs (dark gray). Tissue cells include both healthy cells and cancer cells. Agents exist in an environment where diffusion is controlled by partial differential equations and constant sources or vasculature provide nutrients. (B) Descriptions of each CAR T-cell agent state, separated by whether the state is desired or undesired for efficacious treatment. (C) Diagram of CAR T-cell metabolism and inflammation module interactions with small molecules, proteins, and regulatory edges. The inflammation module diagram is broken into two parts, showing differences between CD4+ CAR T-cells (light green, top) and CD8+ CAR T-cells (purple, bottom). All CAR T-cells use identical metabolism modules. Regulatory edges (upregulation: green arrow, downregulation: red flathead arrow) result from IL-2 binding and antigen-induced activation. G, glucose; O, oxygen; GB, granzyme B; OXPHOS, oxidative phosphorylation. Legend for cell color is consistent with panel B. (D) An example of a single dish and tissue simulation of untreated cancer and healthy cells shown at select time points. For tissue, the dynamic vasculature architecture is overlaid.
FIGURE 2
FIGURE 2
Impact of individual CAR T-cell and tumor features on cytotoxicity and CAR T-cell growth in dish. (A) Cell counts over time of untreated (black) and treated conditions (graded hues) holding all but one feature constant. Each column shows the axis being changed, where all other features are held constant at indicated intermediate values (indicated by asterisk, CAR T-cell dose = 500 CAR T-cells, CD4+:CD8+ ratio = 50:50, CAR affinity = 10−7 M, cancer antigens = 1000 antigens/cell), while rows show the cell type being plotted. (B) Normalized percent lysis curves for in silico and published experimental in vitro data. Plot for simulated data shows percent lysis for each set of CAR affinity values across normalized cancer antigen values. All other axes were held constant, and the data were averaged across replicates. Simulations with negative percent lysis indicate cancer cell growth. Experimental data—representing an array of CAR types, effector to target (E:T) ratios, ICDs, and cancer cell lines (Supplementary Table S6, Supplementary Data S5)—were normalized to maximum percent lysis and antigen levels with estimated error bars. The plots show percent lysis for each set of CARs tested per paper, each with unique CAR affinity and tested across a range of antigen target values. (C) Volume and cell cycle distributions for CAR T-cell populations at t = 4 d (filled) and t = 7 d (outline) holding all but CAR affinity constant at an intermediate value in monoculture. Legend is consistent with panel B. The data for cancer cell populations and for all other features can be found in the Supplementary Material. (D) Cell counts over time of untreated (black) and treated conditions (graded hues) holding all features constant at an intermediate value. Legend is consistent with panel B for both ideal and realistic co-culture. Solid lines represent total cell counts, dashed lines represent live cell counts.
FIGURE 3
FIGURE 3
Impact of individual CAR T-cell and tumor features on efficacy, selectivity, and cytokine production in monoculture vs co-culture. (A) Cancer and healthy cell counts over time of untreated (black) and treated (graded hues) conditions holding all but CAR affinity, which is reported in units of M, constant at an intermediate value and separating data by co-culture context. Column shows co-culture type, row shows cell type. Solid lines represent total cell counts, dashed lines represent live cell counts (live, excludes necrotic and apoptotic states as in Figure 2). Intermediate values of other features indicated by asterisk in panel B: CAR T-cell dose = 500 CAR T-cells, CD4+:CD8+ ratio = 50:50, cancer antigens = 1000 antigens/cell. (B) Scatter plots of normalized live healthy cell count ( NH ) vs normalized live cancer cell count ( NC ) for untreated (black) and treated conditions (graded hues) holding all but one axis constant at an intermediate value. Upper left plot shows quadrant meanings. Upper right plot shows scatter plot for different co-culture contexts. Columns show co-culture type, and each row indicates which feature is being plotted. (C) IL-2 and glucose concentrations over time holding all but CAR affinity constant at an intermediate value in monoculture. Legend is consistent with panel B. (D) IL-2 and glucose concentrations over time varying CAR affinity while holding all features constant at an intermediate value in ideal and realistic co-culture. Legend is consistent with panel B. (E) Parity plot of IL-2 concentration at final time point (t = 7 d) for all conditions in realistic (y-axis) vs ideal (x-axis) co-culture colored by each feature (column). Legend is consistent with panel B.
FIGURE 4
FIGURE 4
Collective impact of CAR T-cell and tumor features on dish outcomes. (A) Heatmap showing values for each feature with line plots showing normalized live cancer cell count ( NC ) sorted from highest (left) to lowest (right). The dashed line indicates value of NC = 1, meaning no net change due to treatment. Values of NC > 1 indicate net growth and values of NC < 1 indicate net killing. (B) Heatmap showing values for each feature with line plots showing normalized live cancer cell count ( NC ) and normalized live healthy cell count ( NH ) (dashed line indicates normalized live cell count of 1) and the difference in normalized live healthy and cancer cell counts ( NHNC ) for each ideal co-culture simulation individually (dashed line indicates NHNC = 0). The heatmap has been sorted from lowest (left) to highest (right) difference. All metrics were calculated at the final time point (t = 7 d). (C) Heatmap and normalized cell counts for realistic co-culture. Labels are consistent with panel B. Each feature is reported in the following units: CAR T-cell dose = number of CAR T-cells, CD4+:CD8+ ratio = unitless, CAR affinity = M, cancer antigens = antigens/cell.
FIGURE 5
FIGURE 5
Dynamic, spatial, and ranked outcomes for selected promising treatment combinations in tissue. (A) Live cell counts over time of untreated (black) and treated conditions (graded hues) normalized to cell count at start of treatment (t = 21 d), for all simulations, colored by cancer antigens (other features may be changing as well). Cancer antigens reported in antigens/cell. The same data colored by other features are shown in Supplementary Figure S12 (B) Scatter plots of normalized live cancer cell count ( NC , x-axis) vs normalized live healthy cell count ( NH , y-axis), each normalized to initial value at start of treatment (t = 21 d), for untreated (black) and treated conditions (graded hues) for all simulations, colored by one feature at a time. Each feature is reported in the following units: CAR T-cell dose = number of CAR T-cells, CD4+:CD8+ ratio = unitless, CAR affinity = M, cancer antigens = antigens/cell. (C) Normalized live cell counts over time (t = 21, 25, 28, and 30 d shown) for untreated (black) and treated conditions (graded hues), normalized to locations per radius, for all simulations, colored by cancer antigens. The columns indicate the timepoint in the simulation (day), while the rows indicate cell type plotted, and the x-axis for each plot shows the distance from the center. Legend is consistent with panel B. (D) Heatmap showing values for each feature with line plots showing normalized live cancer and healthy cell counts and difference in normalized live healthy and cancer cell counts ( NHNC , where healthy cell value is multiplied by the ratio of cancer to healthy cells at the start of treatment to ensure equal weighting since initial cell population sizes are not equal; dashed line indicates value of 0) at final time point averaged across replicates. The heatmap is sorted from lowest (left) to highest (right) difference. Feature legends are consistent with panels A and C. (E) Ladder plots of condition rankings in both dish and tissue, where condition outcome (averaged across replicates) is colored by each corresponding feature.

Similar articles

Cited by

References

    1. Akbar A. N., Henson S. M. (2011). Are Senescence and Exhaustion Intertwined or Unrelated Processes that Compromise Immunity? Nat. Rev. Immunol. 11 (4), 289–295. 10.1038/nri2959 - DOI - PubMed
    1. Altman B. J., Dang C. V. (2012). Normal and Cancer Cell Metabolism: Lymphocytes and Lymphoma. FEBS J. 279 (15), 2598–2609. 10.1111/j.1742-4658.2012.08651.x - DOI - PubMed
    1. Anderson A. R. A., Weaver A. M., Cummings P. T., Quaranta V. (2006). Tumor Morphology and Phenotypic Evolution Driven by Selective Pressure from the Microenvironment. Cell 127 (5), 905–915. 10.1016/j.cell.2006.09.042 - DOI - PubMed
    1. Arcangeli S., Rotiroti M. C., Bardelli M., Simonelli L., Magnani C. F., Biondi A., et al. (2017). Balance of Anti-cd123 Chimeric Antigen Receptor Binding Affinity and Density for the Targeting of Acute Myeloid Leukemia. Mol. Ther. 25 (8), 1933–1945. 10.1016/j.ymthe.2017.04.017 - DOI - PMC - PubMed
    1. Barrett D. M., Singh N., Porter D. L., Grupp S. A., June C. H. (2014). Chimeric Antigen Receptor Therapy for Cancer. Annu. Rev. Med. 65, 333–347. 10.1146/annurev-med-060512-150254 - DOI - PMC - PubMed