. 2022 Jul 12:15:900057.
doi: 10.3389/fnmol.2022.900057. eCollection 2022.

A New Perspective on the Pathophysiology of Idiopathic Intracranial Hypertension: Role of the Glia-Neuro-Vascular Interface

Affiliations

A New Perspective on the Pathophysiology of Idiopathic Intracranial Hypertension: Role of the Glia-Neuro-Vascular Interface

Per Kristian Eide et al. Front Mol Neurosci. .

Abstract

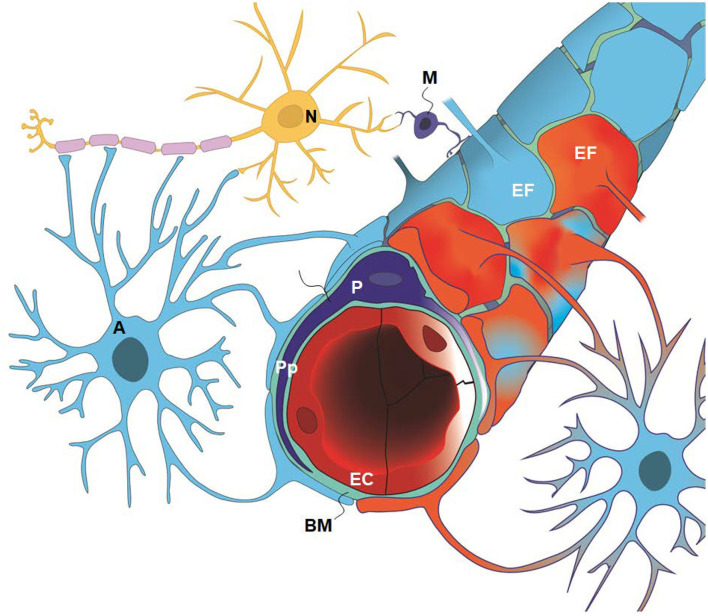
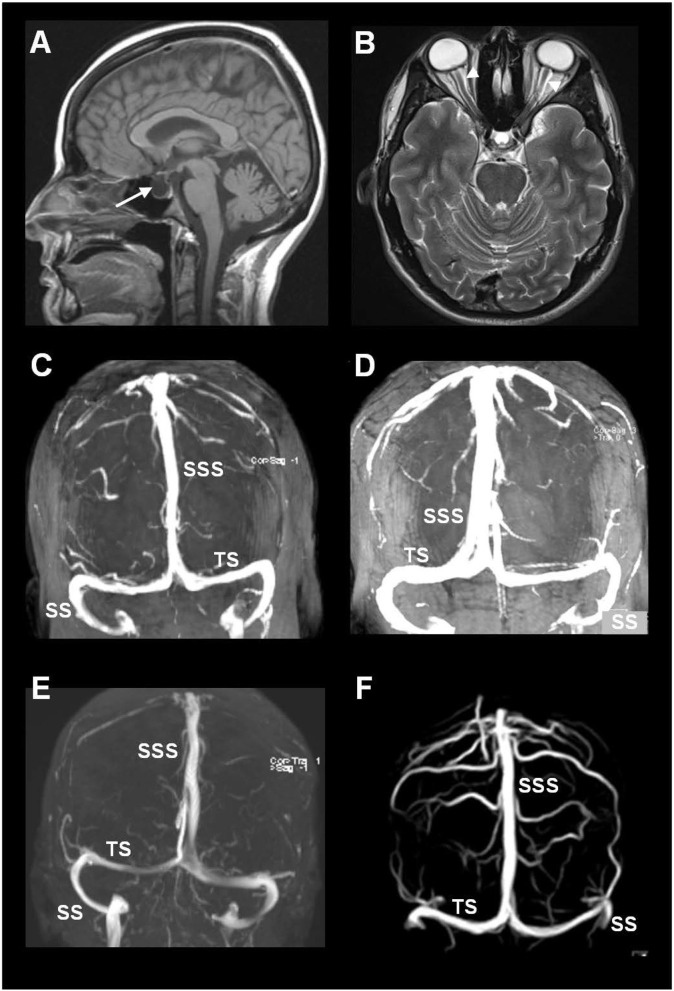
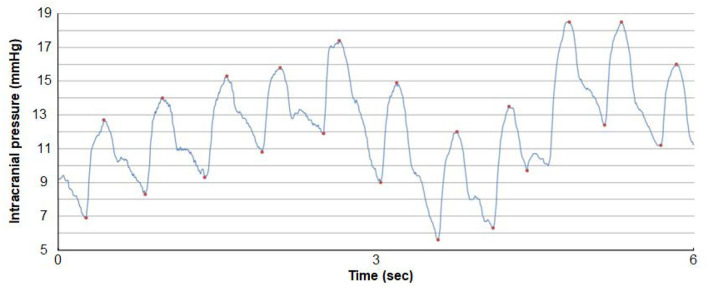
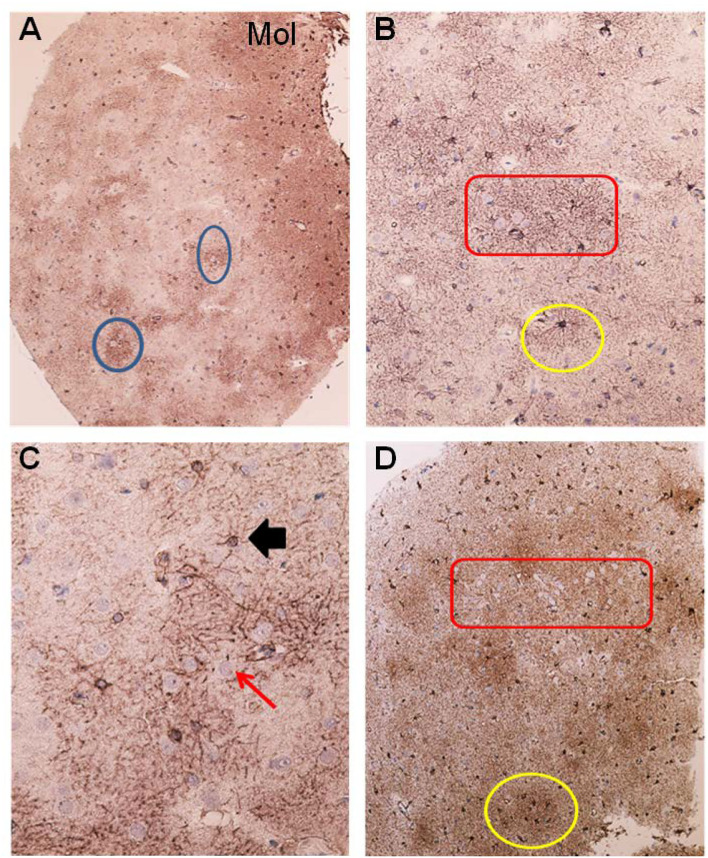
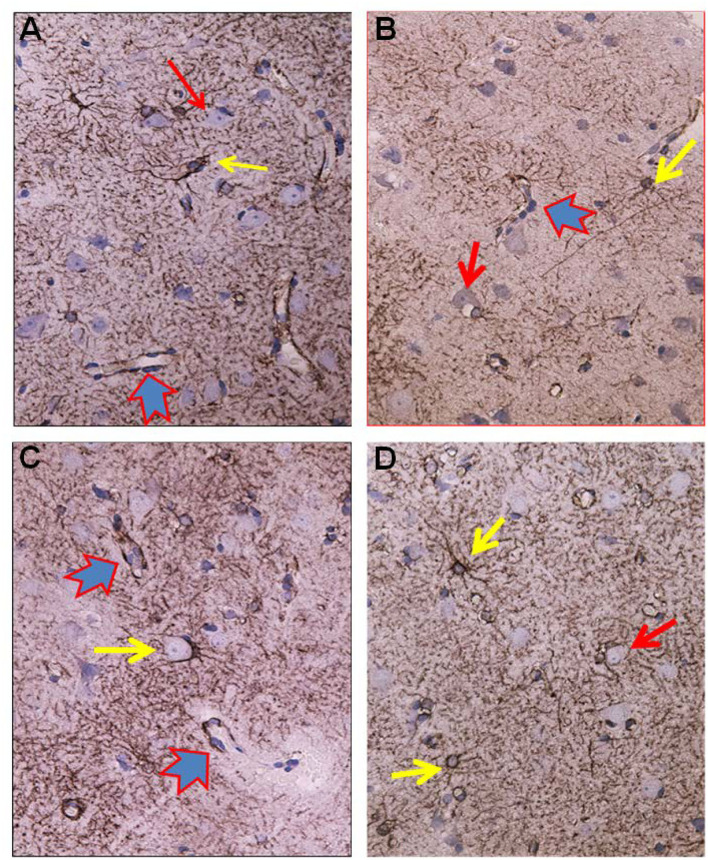
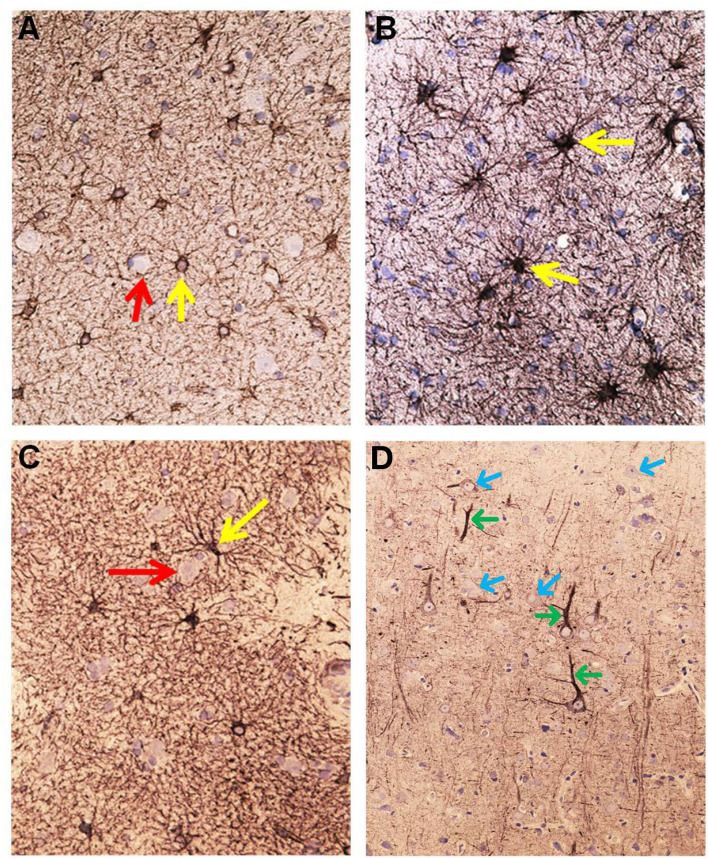
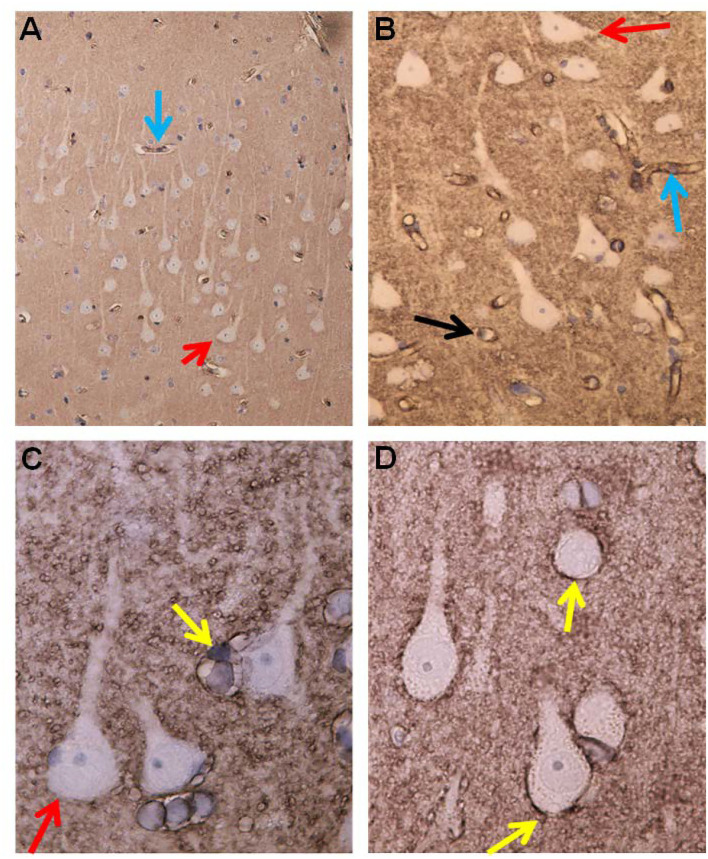
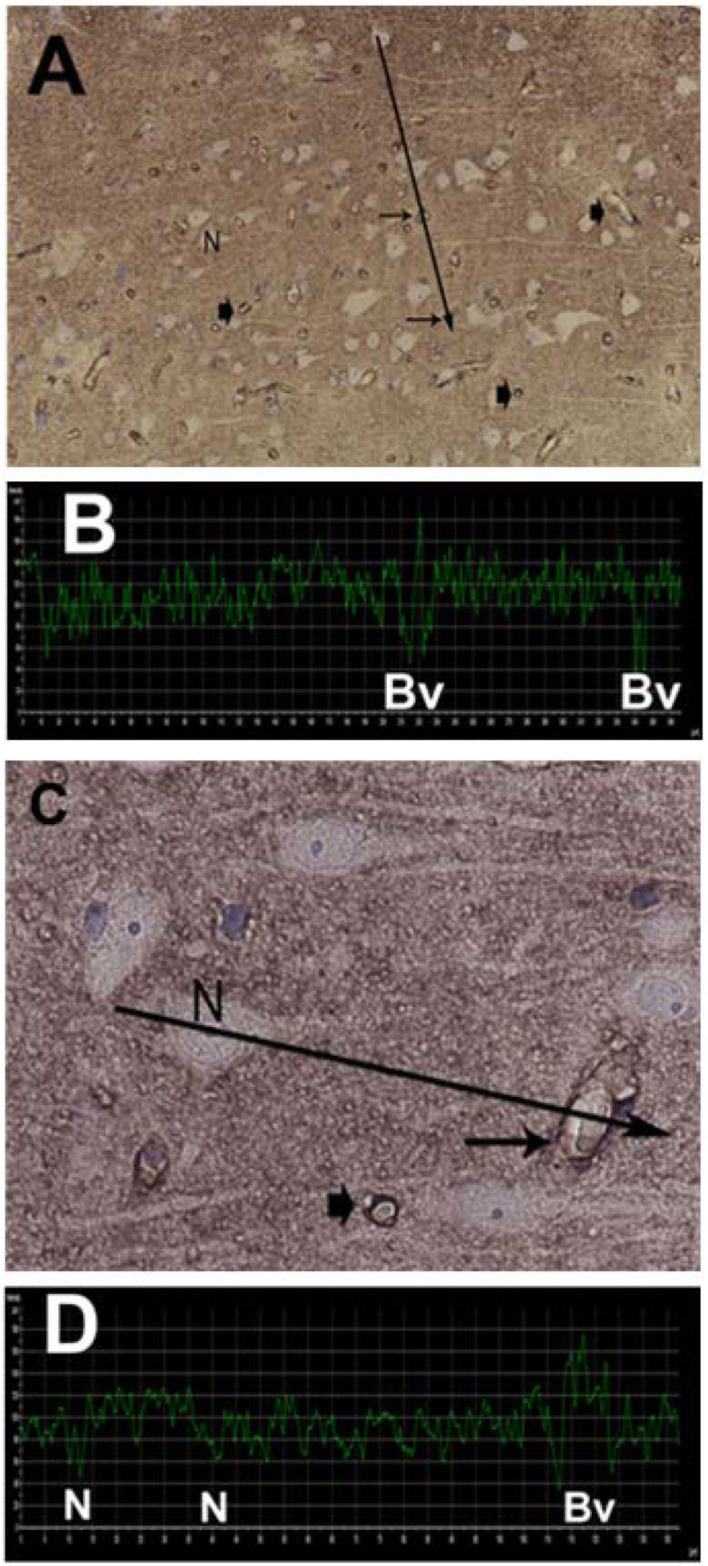
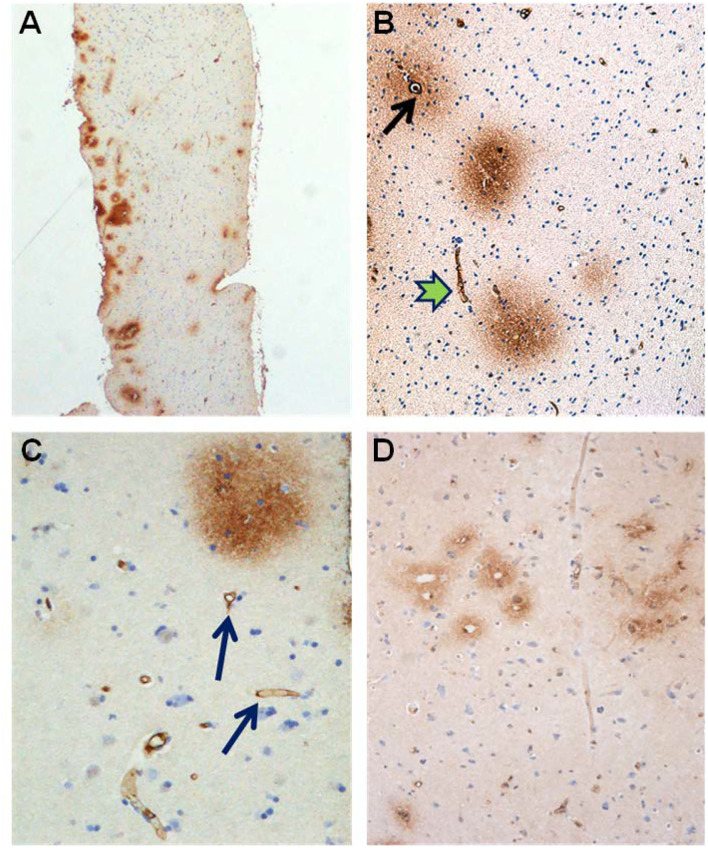
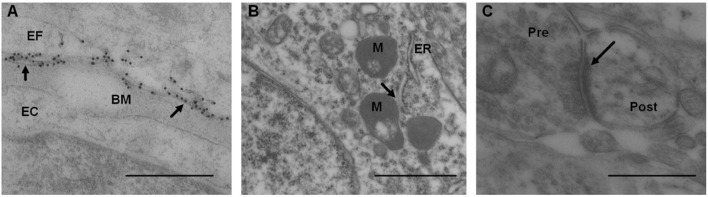
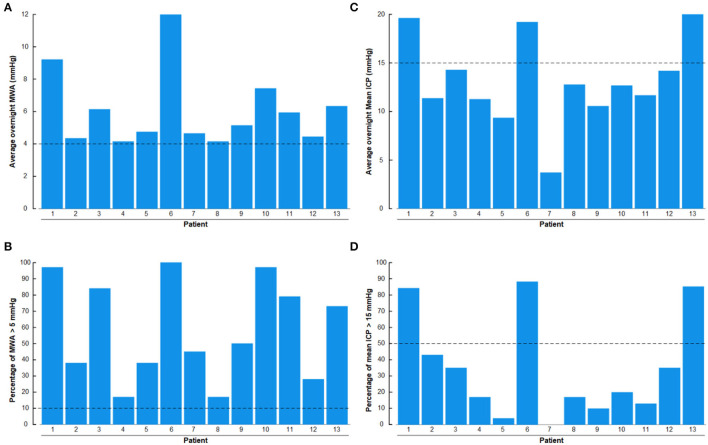
Idiopathic intracranial hypertension (IIH) is a neurological disease characterized by symptoms and signs of increased intracranial pressure (ICP) of unknown cause. Most attention has been given to the role of cerebrospinal fluid (CSF) disturbance and intracranial venous hypertension caused by sinus vein stenosis. We previously proposed that key pathophysiological processes take place within the brain at the glia-neuro-vascular interface. However, the relative importance of the proposed mechanisms in IIH disease remains unknown. Modern treatment regimens aim to reduce intracranial CSF and venous pressures, but a substantial proportion of patients experience lasting complaints. In 2010, the first author established a database for the prospective collection of information from individuals being assessed for IIH. The database incorporates clinical, imaging, physiological, and biological data, and information about treatment/outcome. This study retrieved information from the database, asking the following research questions: In IIH subjects responding to shunt surgery, what is the occurrence of signs of CSF disturbance, sinus vein stenosis, intracranial hypertension, and microscopic evidence of structural abnormalities at the glia-neuro-vascular interface? Secondarily, do semi-quantitative measures of abnormal ultrastructure at the glia-neurovascular differ between subjects with definite IIH and non-IIH (reference) subjects? The study included 13 patients with IIH who fulfilled the diagnostic criteria and who improved following shunt surgery, i.e., patients with definite IIH. Comparisons were done regarding magnetic resonance imaging (MRI) findings, pulsatile and static ICP scores, and immune-histochemistry microscopy. Among these 13 IIH subjects, 6/13 (46%) of patients presented with magnetic resonance imaging (MRI) signs of CSF disturbance (empty sella and/or distended perioptic subarachnoid spaces), 0/13 (0%) of patients with IIH had MRI signs of sinus vein stenosis, 13/13 (100%) of patients with IIH presented with abnormal preoperative pulsatile ICP [overnight mean ICP wave amplitude (MWA) above thresholds], 3/13 (23%) patients showed abnormal static ICP (overnight mean ICP above threshold), and 12/13 (92%) of patients with IIH showed abnormal structural changes at the glia-neuro-vascular interface. Comparisons of semi-quantitative structural variables between IIH and aged- and gender-matched reference (REF) subjects showed IIH abnormalities in glial cells, neurons, and capillaries. The present data suggest a key role of disease processes affecting the glia-neuro-vascular interface.

Keywords: astrocytes; benign intracranial hypertension; capillaries; idiopathic intracranial hypertension; intracranial pressure; pathophysiology; pseudotumor cerebri.


Conflict of interest statement

Figure 3 is from Sensometrics analytical software, which is used for digital recording of continuous pressure (ICP, ABP, and CSF pressure) signals. PE has a financial interest in the software company, dPCom AS, which manufactures this software. The remaining author declares that the research was conducted in the absence of any commercial or financial relationships that could be construed as a potential conflict of interest.

Figures

Figure 1
Figure 1
The glia-neuro-vascular interface (also denoted the glia-neuro-vascular unit/coupling) incorporates the capillary wherein its circumference consists of endothelial cells (ECs) having tight junctions and pericytes (P) with processes (Pp). The relationship between the endothelial cells and pericytes in humans is 1:1–3:1, decreasing with age and in diseases. The basement membrane (BM) is a loose matrix between endothelial cells (ECs) and pericytes (Ps) and the astrocytic end-feet (EF). The astrocytic end-feet processes create a donut shaped structure enclosing the basement membrane (BM). There are inter-end-feet-gaps between the endfoot (EF) processes enabling passage of molecules to the interstitial tissue. Normal end-feet (EF) are indicated in blue to the left while pathological end-feet (EF) in red color to the right. Other components are the astrocytes (A), neurons (N) and microglia (M). In IIH, there is patchy astrogliosis, causing changes to the normal configuration of astrocytes. Moreover, there is loss of integrity of the BBB with degeneration of basement membrane and pericyte processes, and BBB leakage of the blood proteins fibrinogen and fibrin. Extra-vascular fibrin(ogen) is not demonstrable in normal adult brains and is prominently pro-inflammatory. Our present disclosure of blood-brain-dysfunction in IIH subjects indicates that the glia-neuro-vascular unit is likely associated with the pathogenesis of the disease. Illustration: Ine Eriksen, University of Oslo.
Figure 2
Figure 2
MRI biomarkers indicative of CSF disturbance in IIH include the presence of (A) empty sella (arrow) and (B) distension of the perioptic subarachnoid spaces (arrowheads). (C–F) Sinus vein stenosis was assessed using MRI venography, here illustrated by MRI venography from four of the included patients with IIH. The image shows the transverse sinus (TS), sigmoid sinus (SS), and the superior sagittal sinus (SSS).
Figure 3
Figure 3
A continuous ICP signal measured from an ICP sensor placed in the frontal parenchyma of an individual with IIH. The level of ICP is shown on the y-axis and time on the x-axis. Both the pulsatile and static ICP are derived from the same ICP signal. The pulsatile ICP is described as the Mean Wave Amplitude (MWA) that refers to the pressure changes occurring during the cardiac cycle, that is, the increase in pressure from diastolic minimum pressure to systolic maximum pressure (here illustrated by the red dots). The mean ICP refers to the static ICP, that is, the absolute pressure measured against a reference pressure. The MWA and the mean ICP are determined over consecutive 6-s time windows; here mean ICP is 12.2 mmHg and MWA 6.4 mmHg. Image: Sensometrics Analytics, dPCom, Oslo, Norway.
Figure 4
Figure 4
Astrocytes visualized by GFAP IR in brain cortex biopsies from IIH patients. (A) Low magnification of a section of brain biopsy reveals a high prevalence of astrocytes in the subpial molecular layer (Mol; layer 1, also named Chaslin's layer) looking like clusters of dark dots. Patches of astrocytes enclosing neurons are seen in cortical layers 2/3 (blue circles). (B) Clusters of hypertrophic astrocytes are seen enclosing unstained neurons (encircled by a red line). An apparently normal-looking astrocyte (outlined by yellow circle) with radiating slender processes without having any processes from adjacent glial cells entering its domain. (C) Neurons (red arrow) in the center of the specimen are enclosed by astrocytes. Note that processes from adjacent astrocytes enter their neighbors' domains as well as having increased branching (black arrow). The GFAP-IR expression is low outside the patch of neurons and astrocytes. (D) A low magnification micrograph of the superficial cortex layers shows a cluster of neurons forming a patch surrounded by mainly glia cells (encircled by a red line). Adjacent cluster of astrocytes enclose only few neurons (yellow circle).
Figure 5
Figure 5
Visualization of astrocytes by GFAP-IR in cerebral cortex of IIH patients. (A) GFAP-IR is demonstrable forming an elaborated meshwork of processes and membranes. Note the swelling of the perivascular astrocytic end-feet along small blood vessels (red-blue arrow). Nerve cell marked by red arrow and astrocytes marked by yellow arrow. (B) Enlarged astrocyte end-feet, filled up by GFAP-IR material, were demonstrable along small blood vessel. The function, effects and importance of such enlarged GFAP-IR end-feet accumulations require further investigation. (C) The large nerve cell in the center (yellow arrow) is delimited by astrocyte membranes along its cell body. This is characteristic for synaptic stripping where the GFAP IR membrane continuously encloses half of the perikaryal circumference of the nerve cell body. Note that GFAP-IR profiles are demonstrable in only parts of the cortex specimen. Enlarged GFAP-IR end-feet marked by red-blue arrows. (D) Examples of close approximation between the astrocyte processes and the nerve cells. Further, the intensely stained GFAP-IR processes radiate from the astrocyte cell body, divide, and additionally entered neighbor cell domains. Red arrow toward nerve cell and yellow arrows toward astrocytes.
Figure 6
Figure 6
Aspects on the dynamics of astrocytes and neurons in the cerebral cortex of IIH patients. (A) Section of the subpial molecular cortex layer, which is dominated by astrocytes and have only scattered nerve cells. The GFAP-IR astrocytes (yellow arrow) are star-shaped with mainly slender radiating and non-dividing processes. Scattered nerve cells (red arrow) are seen in the neuropil. This illustrates the normal structure of cortex layer 1. (B) The astrocytes in this specimen of layer 1 are hypertrophic and their processes have abundancy of glio-filament (yellow arrow). The density of the GFAP-IR meshwork is increased in (B) as compared to (A). (C) A dense network of branching and prominently GFAP-IR processes of impressive density. (D) In cortex layers 2/3 of an IIH subject, NF-H-IR expression occurs in damaged or dying neurons (green arrows), while living neurons remain colorless (blue arrows). This indicates neuronal damage in IIH.
Figure 7
Figure 7
Aquaporin 4 (AQP4)—IR in cerebral cortex of IIH subjects. (A) In cortex layers 2/3 the neurons (red arrow) lack AQP4-IR. In contrast, the cell bodies and processes of astrocytes show moderate to strong AQP4-IR. Small blood vessels are distinctly outlined due to high AQP4 IR in the astrocyte end-feet (blue arrow). (B) This Figure illustrates that the small cerebral vessels are distinctly outlined due to the prominent AQP4-IR in astrocyte end-feet. Note that the perivascular end feet lining blood vessels are more intensely reactive than the neuropil. (C) Pyramidal nerve cells (red arrow) could be observed outlined by seemingly continuous AQP4-IR along the neurilemma, as noticed for many neurons (reference patient). In contrast, no enclosing continuous rim of AQP4-IR was observed in IIH. (D) The significance of the different patterns of AQP4 IR in end-feet in different locations ought to be further elucidated.
Figure 8
Figure 8
Semi quantitative densitometry determination of AQP4 IR in cerebral biopsies in IIH patients. (A) The pattern of AQP4 IR is revealed. The densitometric measurement in (A) along a line is shown in (B). Low transmission of light discloses strong AQP4 IR. The nerve cells are non-immunoreactive contrasting to the prominent AQP4-IR in the neuropil. Densitometric analysis enables mapping of the sites with reactive and non-reactive cell structures. (C) The relative intensity of the AQP4 IR can be mapped at the cellular level enabling more detailed analysis. The neurons are non-reactive. The perivascular astrocytic end-feet show prominent AQP4 IR. (D) The densitometric measurement.
Figure 9
Figure 9
Evidence of BBB dysfunction in IIH subjects. (A) The cerebral cortex biopsies comprised cortex tissue that was dissected and fixed by immersion within minutes to achieve best possible preservation. Extravasations of blood products were revealed by immunohistochemical demonstration of both fibrin and fibrinogen, i.e., the blood proteins detected by the used antibody. (B) Leakage from a small blood vessel (black arrow) in the center of extravasated fibrin(ogen). Note the vessel wall at the top is retaining blood proteins. (C) Fibrin (ogen) is demonstrable both extravasated (upper right corner) and in the walls of small brain vessels (arrow). (D) A cluster of small blood vessels is surrounded by leaked fibrin (ogen).
Figure 10
Figure 10
Transmission electron microscopy images of biopsy from right frontal cortex of IIH patients. (A) Expression of AQP4 was shown by immunogold labeling of AQP4 in perivascular astrocytic end-feet (EF) facing basement membrane (BM) and endothelial cells (EC); arrows indicate contact toward BM. Scale bar 500 nm. (B) Distance between mitochondria (M) and endoplasmic reticulum (ER) in patients with IIH, denoted mitochondria-ER-contact sites (MERCs; arrow). Shortened distance is indicative of pathology. Scale bar 1 μm (C) Post-synaptic density (PSD) length (arrow) in IIH, with pre (Pre) and post-synaptic (Post) nerve terminals. Reduced PSD length is indicative of pathology. Scale bar 500 nm.
Figure 11
Figure 11
The overnight recordings of MWA and mean ICP in the 13 Patients with IIH included in the study are shown on an individual basis. (A) Overnight average of MWA. (B) Overnight percentage of MWA > 5 mmHg. (C) Overnight average of mean ICP. (D) Overnight percentage of mean ICP > 15 mmHg. The horizontal lines indicate upper normal thresholds as defined by the first author: (A) Overnight MWA > 4 mmHg. (B) Overnight 10% of MWA > 5 mmHg. (C) Overnight Mean ICP > 15 mmHg. (D) Overnight 50% of Mean ICP > 15 mmHg.
Figure 12
Figure 12
Intrathecal contrast-enhanced MRI in one subject with IIH provides evidence for a glymphatic system in patients with IIH. Intrathecal injection of the MRI contrast agent gadobutrol (Gadovisttm, Bayer Pharma AG, Berlin, Germany) in a dose 0.5 mmol, serves as a CSF tracer molecule. Gadobutrol has a molecular size of about 604 Da and is highly hydrophilic, making it suitable for transport within the CSF. After arriving to the subarachnoid CSF, the tracer is contained outside the blood vessels since it does not pass the BBB. Using FreeSurfer, tracer in CSF spaces is subtracted, only showing enrichment of tracer in brain parenchyma over time in this IIH patient responding to shunt surgery. The tracer enriched in the interhemispheric fissure and Sylvian fissure and medial temporal where the large vessels resides anterior middle cerebral and posterior cerebral arteries, respectively. Moreover, the tracer enriched in a centripetal fashion; at 24 h the entire brain had enriched with tracer that lasted at 48 h. In vivo evidence for impaired glymphatic function in IIH has been given before (Eide et al., 2021b). Illustration: Lars Magnus Valnes, Department of neurosurgery, Oslo university hospital, Oslo, Norway.

Similar articles

Cited by

References

    1. Adderley N. J., Subramanian A., Nirantharakumar K., Yiangou A., Gokhale K. M., Mollan S. P., et al. . (2019). Association between idiopathic intracranial hypertension and risk of cardiovascular diseases in women in the United Kingdom. JAMA Neurol. 76, 1088–1098. 10.1001/jamaneurol.2019.1812 - DOI - PMC - PubMed
    1. Alafuzoff I., Adolfsson R., Grundke-Iqbal I., Winblad B. (1985). Perivascular deposits of serum proteins in cerebral cortex in vascular dementia. Acta Neuropathol. 66, 292–298. 10.1007/BF00690961 - DOI - PubMed
    1. Alberts B., Johnson A., Lewis J., Raff M., Roberts K., Walter P. (2014). Molecular Biology of the Cell. New York, NY: Garland Science.
    1. Albuquerque F. C., Dashti S. R., Hu Y. C., Newman C. B., Teleb M., McDougall C. G., et al. . (2011). Intracranial venous sinus stenting for benign intracranial hypertension: clinical indications, technique, and preliminary results. World Neurosurg. 75, 648-52; discussion 592–5. 10.1016/j.wneu.2010.11.012 - DOI - PubMed
    1. Alperin N., Ranganathan S., Bagci A. M., Adams D. J., Ertl-Wagner B., Saraf-Lavi E., et al. . (2013). MRI evidence of impaired CSF homeostasis in obesity-associated idiopathic intracranial hypertension. Am. J. Neuroradiol. 34, 29–34. 10.3174/ajnr.A3171 - DOI - PMC - PubMed

LinkOut - more resources